Design and Application of an Integrated Platform of Electronic Instrumentation, Data Acquisition and Client/ Server Software for Remote Structural Health Monitoring of Heritage Buildings
Design and application of an integrated platform of electronic instrumentation, data acquisition and client/server software for remote structural health monitoring of heritage buildings José Pereda, Ricardo Vela, Antolín Lorenzana, Ignacio Lombillo, Haydee Blanco, Luis Villegas
Abstract
The passage of time and environmental factors contribute to the progressive deterioration of buildings and, without the proper conservation or maintenance, structural pathologies may appear. When this is the case of cultural heritage buildings and there are rehabilitation plans, a previous study phase is mandatory, in order to advise on the severity of the developed structural problems and establish the proper intervention strategies. In this paper, a new integrated platform of electronic instrumentation, data acquisition and client/server software for the analysis of structural pathological processes is presented, with the following advantages for the researcher in charge of this phase of study, among others: Remotely monitoring of real-time evolution of the data collected by the sensors installed, avoiding the need of continuous travels to the location. Continuous recording of the data collected, allowing the generation of evolution graphs or having full raw files to perform several studies. Establishment of protocols to systematically evaluate risk factors, and setting of automatic alarms, in case the controlled variables exceeded preset limits values. The integrated platform presented is based on the installation of:
A centralized Industrial PC and several remote units with several data acquisition cards, according the type of sensors installed, in charge of collecting data continuously.
An application server, which communicates periodically with the central unit, extracting and persisting data.
A web server, which allows remote access to this data, through a JavaFX based client application, the new Java platform for developing rich client applications.
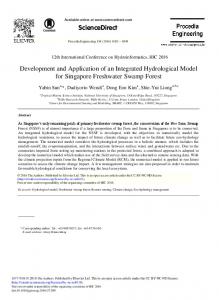
Figure 1. Example of sensor (left), industrial PCs (middle) and client software (right), as part of the platform
As an example of practical use of this platform, the case of the Church of the Major Seminary in Comillas, Spain, will be presented.
José Pereda is with Escuela de Ingenierías Industriales, Universidad de Valladolid, Spain (corresponding author to provide phone: +34 983 42 33 91, email:
[email protected]) Ricardo Vela is with Grupo Codelse, Cantabria, Spain (e-mail:
[email protected]) Antolín Lorenzana is with Cartif Research Centre, Boecillo (Valladolid), Spain (e-mail:
[email protected]). Ignacio Lombillo, Haydee Blanco and Luis Villegas are with Grupo I+D en Tecnología y Gestión de la Edificación (GTED-UC), Universidad de Cantabria, Spain (e-mails:
[email protected],
[email protected] and
[email protected])
577
I. INTRODUCTION From a technical perspective, the analysis of ancient buildings arises major challenges given the complexity of the geometry, the variability of the properties of traditional materials, different construction techniques, lack of knowledge about existing damage, and how certain actions affect throughout the building’s life [1]. Due to all these challenges, the cultural heritage buildings are subject to a vast number of difficulties in diagnosis and restoration. And that is why the understanding, analysis and repair of historic buildings are set as one of the most important challenges for technicians [2]. Monitoring systems will indubitably contribute to the knowledge of the evolution of certain pathological processes [3]. For example, the medieval structures of Pavia, Italy, are one of the most studied cases as, after the collapse of the Civic Tower in 1989, public safety was assured through the constant observation and online monitoring [4]. Similar works can be found in [5, 6, 7, 8 and 9]. In addition, after any intervention or in those cases where immediate action is not feasible, in terms of preventive maintenance, it is important to follow the evolution of certain parameters early enough to discern the need for possible future interventions. This paper presents a practical view on the integration of electronic instrumentation systems, data acquisition and software development applied to the monitoring of structural pathological processes. This integration is based on the implementation of a RTU architecture: A centralized Industrial PC acts as master unit (MTU) while several remote stations units (RTU) host data acquisition cards according to the type of sensors employed. An Ethernet network communicate all the equipment, allowing continuous data collecting. Another industrial PC hosts an application server, whose main task is communicate periodically with the system, extracting and giving persistence to the gathered data in a database. It also hosts a web server, which allows remote access to real time data. Finally, a desktop application, developed in JavaFX, the new platform for developing rich client applications, as a friendly user interface, allows remote access in real time to data, status, alarms, offset adjustments, etc. The architecture of the remote monitoring system installed at the Church of the Major Seminary in Comillas, Spain, will be showed. II. SCADA SYSTEM SCADA (Supervisory Control And Data Acquisition system) refers to the combination of telemetry and data acquisition. SCADA encompasses the collecting of the information via one or several RTU (Remote Terminal Unit), transferring it back to a master station (MTU) via a communications system [10]. A. MTU and the RTUs A MTU (Master Terminal Unit), the heart of the SCADA system, is located in a control room, and it request the information gathered by the RTUs, and interfaces with the application server. An RTU (Remote Terminal Unit) is a microprocessor-based device connected to sensors, transmitters or process equipment for the purpose of remote telemetry and control [11]. It is an electronic device located in a remote field installation which operates as a data acquisition and control unit, interfacing with local equipment through input/output physical connections. Its main purpose is monitoring and controlling equipment by gathering and uploading data from the process equipment installed at remote locations. A RTU manages connection across a remote communication link to a control room. There can be communication connections to other RTUs, forming a network structure for distributed communication. RTUs solve the challenges of remote monitoring and control by optimizing data collection and transmission, and by managing data communication so that a large number of remote devices can communicate within a system using cost effective remote communication links. A typical RTU hardware module, as shown in Figure 2, includes: Control processor unit (CPU). 16 or 32 bits microprocessor, memory, power supply, real time clock and watchdog timer. Digital Input. The card acquires the real world information, usually by an isolate voltage or current source to sense the position of a remote contact (open or close). Analog Input. Different types of analog inputs can be monitored: 0-1 mA, 4-20 mA, 0-10 V, -5 +5 V, so on. The RTU translates and scales this raw data into the appropriate units. Input resolution, in terms of number of discrete
578
digital values generated over the range of analog real values, is an important specification for performance and accuracy. For a n-bit resolution, 2n values are generated. Modern RTUs achieve 24-bits. Digital Output. The card can drive high current capacity relays to switch power on and off to devices in the field. Analog Output. The card can control devices that require varying quantities. Communications. A RTU may be interfaced to a MTU with serial ports (RS232, RS485, RS422) or Ethernet link. It support standard protocols, such as ModBus, IEC 60870-5, DNP3, IEC 60870-6, IEC 61850, …
Figure 2. Typical RTU hardware structure [10]
B. The EtherCAT solution Beckhoff, a German automation company founded in 1980 [12], developed in 1989 a fieldbus system called Fast Lightbus to correct the low bandwidth utilization problem present in other Ethernet protocols. This protocol led to EtherCAT which Beckhoff released in 2003. In 2004 they promoted the creation of the Ethernet Technology Group and the EtherCAT protocol, and the rights were donated to the group. EtherCAT stands for Ethernet for Control Automation Technology. It is an open high performance Ethernet-based fieldbus system, a real-time Ethernet (RTE) network. It is an Industrial Ethernet technology standardized by SEMI E54/20, IEC 61158, IEC 61784 and ISO 15745, supported by the EtherCAT Technology Group [13]. The performance and bandwidth limitation of classical fieldbus systems such as DeviceNet, Profibus, CC-Link, CANopen, or Modbus dictate the control architecture of semiconductor tools and fab automation systems. EtherCAT overcomes these limitations due to its unique functional principle – processing on the fly, Figure 3 – that makes full usage of the 100 Mbit/s Ethernet bandwidth and enables bus cycle times in the μs range instead of the ms range [14].
Figure 3. Frame Processing On-the-Fly [14]
With processing on the fly, the Ethernet packet is no longer first received, then interpreted and copied as process data at every connection. Instead, the EtherCAT Slave Controller chip in each slave node reads the data addressed to it, while the frame is forwarded to the next device. Similarly, input data is inserted while the frame passes through. The frames are hardly delayed at all. The frame sent by the master is passed through to the next device until it reaches the end of the segment. The last device detects no additional devices connected to the downstream port and therefore sends the frame back to the master.
579
The EtherCAT protocol, Figure 4, is optimized for process data and is transported directly within the Ethernet frame thanks to a special Ether-type consisting of several sub-telegrams, each serving a particular memory area of the logical process images, that can be up to 4 gigabytes in size. The data sequence is independent of the physical order of the Ethernet terminals in the network; addressing can be in any order. Broadcast, Multicast and communication between slaves are possible. Transfer directly in the Ethernet frame is used in cases where EtherCAT components are operated in the same subnet as the control computer.
Figure 4. EtherCAT protocol structure [15]
III. A CASE STUDY In the field of remote monitoring of cultural heritage buildings, one of the main issues is the big distances between the several areas of study. An optimal solution, in terms of reducing the amount of cabling from all the sensors to the control room, will be installing a MTU in this room and all the RTUs required in the different areas, providing an EtherCAT network joining all of them to the main CPU, in a line, tree or start topology. The required interfaces exist on the couplers installed at the beginning or at the end of each RTU, without the need of additional switches. In order to illustrate with a real case a suitable configuration of RTU architecture, the one installed in the Church of the Major Seminary of Comillas, Spain, will be analyzed.
Figure 5. Major Seminary of Comillas, Spain
580
A. The location The Major Seminary of Comillas, shown in Figure 5 is a Modernist building from the late nineteenth century [16]. This National Historic-Artistic Monument has been recently subjected to several studies under the coordination of the Building Technology R+D Group of the University of Cantabria (GTED-UC) first in 2006 [17], with the main aim of obtaining information, at previous studies level, before the development of the technical project, and later on in 2012 to control the evolution of damage presented in the church [18], Figure 6.
Figure 6. Scaffolding structure inside the church, and visible damage in the walls.
As a result of the last studies, different site plans with actual damage were drawn, like the one in Figure 7, where the most damaged area is highlighted.
Figure 7. Damaged areas report
581
B. Implementing a RTU architecture with EtherCAT Taking into account the reduced economical resources devoted to the damage control, a decision was made to monitor the most critical area in the church. Figure 8 shows over the church layout the selected areas and the location of the different units of the SCADA system installed for that task.
Figure 8. Selected areas of study and SCADA system location
As MTU the Industrial PC C6920 [19], designed for control cabinet installation, is used. The compact case shown in the is equipped with a 3½-inch motherboard for Intel® Core™ Duo or Core™2 Duo, 2 GB DDR3 RAM, 80 GB hard disk and Intel® GMA 4500MHD graphic adapter. All PC connections are located at the front of the housing. The cooling is done by internal cooling fins and an easily exchangeable fan cartridge at the bottom of the housing.
Figure 9,
Figure 9. Control cabinet Industrial PC C6950, unmounted (left) and mounted (right)
The top socket allows the 24 VDC power supply. The next two RJ-45 connectors allow 10/100/1000BASE-T LAN connection for Ethernet or EtherCAT. It has four USB 2.0 interfaces, a DVI connection for video signal and finally, on the bottom, a serial interface COM1 type RS232 and a fieldbus interface. CF-Card or hard disk can be connected on the slots hidden behind the front flap. As RTUs, three EtherCAT couplers EK1100 [20] are used, Figure 10.a. Basically, one terminal station consists of a coupler, any number of EtherCAT terminals and a bus end terminal (EL9011). The coupler converts the telegrams from Ethernet 100BASE-TX to E-bus signal representation in passing with minimum latency The coupler is connected to the network via the upper Ethernet interface. The lower RJ-45 socket may be used to connect further EtherCAT devices in the same strand, as shown in Figure 10.b, in which a tree topology network is created between the MTU and the three RTUs employed in the three areas of study from Figure 8
582
Figure 10. EtherCAT coupler EK1100 (left) and tree topology network MTU-RTUs (right)
The coupler supplies the connected terminals with the necessary E-bus current for communication. The coupler can supply a maximum of 5 V/2 A. Power feed terminals (EL9410) must be integrated if more current is required. The distance between stations should not go over 100 m. Each coupler has several terminals connected on the right hand side of the Fieldbus coupler, once this is attached to the mounting rail. In case of monitoring sensor values, analog input terminals (EL3xxx, Figure 11) will be mainly used. With 1, 2, 4 or 8 input channels, the signal can be voltage (EL3602, -5V to 5V), current (EL3052, 4 to 20 mA) or resistance (EL3692, 10 mΩ a 10 MΩ), in all cases with 24-bits resolution.
(a)
(b)
(c)
(d)
Figure 11. Analog Input Terminals: EL3052 (a), EL3602 (b) and EL3692 (c). Procedure for attachment to mounting rail (d) Figure 12 shows, on the left, how the three stations are manufactured, with the assembling of the different terminals with their coupler in each RTU, and the testing of the network with the MTU and the three RTUs, according to the final configuration, on the right.
Once everything is settled, now on site, Figure 13, the stations are installed in their cabinets anchored to the wall, the sensors are carefully placed, and all the wiring from the sensors to the RTUs and the EtherCAT connection from these to the MTU is done, taking into account the necessary measures to prevent any damage to the building and the risks involved in the process due to its condition. Table I lists the type of sensors employed while Figure 14 shows some of them and their final disposition at the location.
583
Figure 12. RTUs preparation (left) and network configuration (right)
Figure 13. On-site installation of sensors (left), MTU (middle) and RTUs (right) Sensor Inclinometer Crackmeter Tape Extensometer Thermo-hygrometer Anemometer Weathervane
Table I. Type of sensors installed Model Manufacturer Servo-inclinometer SX41100 Sensorex LVDT V02505SAN3 Solartrom Metrology WS10-50-R1K-L10-SB0-D8-HG ASM GmbH P18 PCE-Ibérica 3R KYWS Darrera 3R KYWD Darrera
Denomination INCL FIS CONV THG ANEM VEL
Figure 14. Sensors disposition (left) and some of the installed sensors (right)
584
As stated before, the EtherCAT distributed network collects all the data from the sensors through the terminals in the RTUs to the MTU where the software can performed some computations if required, applied some scaling (to convert raw measures to proper values). Figure 15 shows the TwinCAT System Manager [21], the configuration center for the system. It is where the inputs and outputs of the software tasks and the physical inputs and outputs of the connected fieldbusses are managed. TwinCAT stands for Total Windows Control and Automation Technology.
Figure 15. TwinCAT System Manager. I/O Configuration
Under I/O Configuration, the EtherCAT network configuration is scanned and displayed, showing in detail every RTU found with all its components (coupler and terminals). For each terminal, all the registered values, as well as other error variables, are transmitted to the MTU and displayed online. On the other side, under PLC Configuration, Figure 16, the software I/O variables are displayed and can be matched or linked with the physical I/O variables, so on runtime they are mapped to the real values, and the software tasks can be executed.
Figure 16. TwinCAT System Manager. PLC Configuration
The main tasks are related to scale the raw values to the corresponding units and magnitudes of their physical values, adding required offsets, setting alarms due to values out or range, and so on. For this, the TwinCAT PLC Control, a complete development environment (IDE), Figure 17, is used. From the different programming languages TwinCAT PLC supports conforming to the IEC 61131-3 (instruction list (IL), structured text (ST), sequential function chart (SFC), function block diagram (FBD) continuous function chart editor (CFC) and ladder diagram (LD)), the structured text, a higher-level C-like programming language, is the one used.
585
Figure 17. TwinCAT PLC Control
This IDE can be used from any PC, first to program the tasks, and later to monitor the results in real time. Once the different routines are programmed, the software is downloaded to the MTU, where the tasks will be performed automatically. For being able to access and extract all the data from the MTU, without using this IDE, a proper server will be installed in another computer, and with the right protocol, both will be connected. For that we’ll use Beckhoff ADS technology [22]. ADS stands for Automation Device Specification and describes a device- and Fieldbus-independent interface. Each ADS device has a unique identification (AdsAmsNetId) and a port number (AdsPortNr). The AdsAmsNetId is an extension of the TCP/IP address and identifies a TwinCAT message router (a TwinCAT PC). C. The Application Server and the Web Server A Java server is installed in this second PC, and a three-tier architecture is implemented, under the classic model-viewcontroller paradigm MVC/2, Figure 18 [23]. Under the business tier, the communication with the TwinCAT PC is performed (via ADS protocol), allowing the retrieval of all the global variables in the MTU at any given time (e.g. due to a client request) or periodically, so they can be persisted on the data tier.
Figure 18. Model-View-Controller paradigm
Under the presentation tier, the client/server communications are established. Servlets or RESTful web services are employed. Only authorized users can access these services, with certain limitations, according to their assigned roles. D. The User Interface The designed user interface application runs on a desktop PC. It allows remote access to the installation to gather and view in real time the data collected by the sensors through the different RTUs. It also allows the retrieval of data within a given range of time, to plot charts or store it (CSV format) for further processing. Designed with the JavaFX 2.2 platform [24], and updated to the new Java 8 version [25], it provides a lightweight, hardware-accelerated native Java graphic UI platform to access remotely the business application on the server side.
586
Figure 19. User Interface. Real time data monitoring
As shown in Figure 19, real-time data is presented at the exact location of each sensor, as they are displayed over the building plans. Figure 20 shows the charting capabilities, allowing the visualization of the evolution of one or several variables within a given range of time.
Figure 20. User Interface. Chart visualization
E. Validation and Results After the installation of this new integrated platform of electronic instrumentation, data acquisition and client/server software for the analysis of structural pathological processes, one of the necessary tasks was to validate the results coming from this platform. For that, several sensors were installed out of this system, to perform manual readings, and correlate the values with the equivalent sensors. As shown in Figure 21 there’s a perfect match between both systems, and the remote platform can be considered reliable. Regarding the evolution of the variables monitored in the Church of the Seminary, after a year of monitoring, it can be concluded that there has been no significant movements, mainly due to the presence of shoring structures and braces between buttresses [18].
587
Figure 21. Comparison of crack opening evolution with remote monitoring (red) and in situ measures (green) [18]
IV. CONCLUSION It can be concluded that remote monitoring systems will unquestionably contribute to the knowledge of the evolution of certain processes in a historic building. Throughout the work done at the Church of the Major Seminary in Comillas we have proven the versatility of the implemented system, both in terms of hardware: master, remote units, terminals and sensors, as in part of the software: application server, web server, data persistence, and user interface. REFERENCES [1] [2] [3] [4] [5] [6] [7] [8] [9] [10] [11] [12] [13] [14] [15] [16] [17] [18] [19] [20] [21] [22] [23] [24] [25]
Roca, P. (2007). “Aplicación de técnicas experimentales y numéricas al estudio del patrimonio arquitectónico”. Proc. Conf. sobre Metodologías no destructivas aplicables a la rehabilitación del patrimonio construido, Universidad de Cantabria, Santander, Spain, 53-70. Lourenco, P. B., Ramos, L. F., Vasconcelos, G., and Peña, F. (2008). “Monastery of Salzedas (Portugal): Intervention in the cloister and information management”. Proc. Int. Conf. On Structural Analysis of Historic Construction. Taylor & Francis Group, London, UK, 95-108. Binda, L., Anzani, A., and Cardani, G. (2009). “Methodologies for the evaluation of seismic vulnerability of complex masonry buildings: case histories in the historic centre of Sulmona”. Proc. 11th Int. Conf. on Structural Repairs and Maintenance of Heritage Architecture, Wessex Institute of Technology, Ashurst, Southampton, UK, 395-405. Macchi, G. (1993). “Monitoring Medieval Structures in Pavia”. Structural Engineering International, 3(1), 6-9. Binda, L., d Veckey, RC. (eds). (2001). “Onsite control and evaluation of masonry structures”. RILEM Publications, 369 p. Monitoring of Historic Structures (GUIDELINES). European Commission Research Project: SMooHS Smart Monitoring of Historic Structures (2010). Rossi, PP., Zaldivar, S. (1996). Testing and monitoring for the restoration of the Metropolitan Cathedral in Mexico City. Int. Conference, Napoli. Monti, C., Rossi, C., Vanessa, G. (1996). Methodological approach in análisis of static monitoring system data. Reports on Surveying ang Geodesic. Bologna. Rossi. PP. (1997). The importance of monitoring for structural analysis of monumental buidings. Keynote Lecture International Colloquium IABSE. Bergamo. Gordon R. Clarke, Deon Reynders, Edwin Wright, “Practical Modern SCADA Protocols: DNP3, 60870.5 and Related Systems.” Elsevier, 2004, ISBN 0-7506-5799-0. Francis Enejo Idachaba and Ayobami Ogunrinde, “Review of Remote Terminal Unit (RTU) and Gateways for Digital Oilfield deployments” International Journal of Advanced Computer Science and Applications(IJACSA), 3(8), 2012. Beckhoff Automation, GmbH. http://www.beckhoff.com/ EtherCAT Technology Group, http://www.ethercat.org M. Rostan, J.E. Stubbs, D. Dzilno, “EtherCAT enabled advanced control architecture,” Advanced semiconductor manufacturing conference, 2010. ASMC. 2010. EtherCAT System Documentation http://download.beckhoff.com/download/Document/BusTermi/BusTermi/EthercatSystem_en.chm Seminar History, Fundación Comillas http://fundacioncomillas.es/en/the-foundation/major-seminary/seminar-history/ L Villegas, I Lombillo, F López, “The importance of the previous studies in the interventions of refurbishment: A practical case, the Major Seminary of Comillas (Cantabria, Spain)”, Actas del I Congreso Internacional de Investigación en Edificación (ISBN 978-84-692-3580-5). Madrid, 2009. Lombillo, I., Blanco, H., Villegas, L., Balbás, J., Carrasco, C., Liaño, C., Vela, R., Pereda, J. (2014). “Monitorización remota de construcciones históricas: Metodología empleada y puesta en marcha en la Iglesia del Seminario Mayor de Comillas”. Congreso Latinoamericano REHABEND 2014, 734-745. ISBN 978-84-616-8863-0. C6920 | Control cabinet Industrial PC http://www.beckhoff.com/english.asp?industrial_pc/c6920.htm EK1100 | EtherCAT Coupler http://www.beckhoff.com/english.asp?EtherCAT/ek1100.htm Beckhoff TwinCAT software system, http://www.beckhoff.com/ Beckhoff ADS technology http://infosys.beckhoff.com/content/1033/tcconnectivity/html/tcconnectivity_intro.htm?id=17924 Pereda, J. “Metodología para el desarrollo de entornos amigables de diseño distribuido en ingeniería utilizando Internet. Aplicación al diseño de cajones flotantes de hormigón armado para muelles y diques”, Tesis doctoral, 2013, Universidad de Valladolid. JavaFX – The Rich Client Platform. http://www.oracle.com/technetwork/java/javase/overview/javafx-overview-2158620.html Dea, C., Heckler, M., Grunwald, G., Pereda, J. and Phillips, S., “JavaFX 8 Introduction by Example”, Apress, 2nd Edition, 2014, ISBN 978-1-43026460-6
588