communication overhead to the network message traffic of the sensor nodes. ... buildings, use a common communication protocol and follow a predetermined ... faults, while maintaining a high detection rate along with a low false positive rate;.
¨ ITAK ˙ c TUB Turk J Elec Eng & Comp Sci, Vol.19, No.1, 2011, � doi:10.3906/elk-0912-334
Design and evaluation of a query-based jamming detection algorithm for wireless sensor networks∗ ˘ ¨ ˙ Murat C ¸ AKIROGLU, Ahmet Turan OZCER IT Department of Computer Systems, Technical Education Faculty, Sakarya University, Sakarya-TURKEY e-mail: muratc{aozcerit}@sakarya.edu.tr
Abstract Jamming attacks, which are the main cause of data corruption and network blockages in wireless sensor networks (WSNs), are one of the most serious threats for WSNs. This type of attack not only blocks the ongoing communication in the network, but also causes the wireless nodes to exhaust their energy much earlier than expected. A countermeasure must be deployed against jamming attacks, especially in military and medical applications in which security breaches cannot be tolerated. In this paper, we have designed a new query-based jamming detection algorithm (QUJDA) to detect jamming attacks occurring in WSNs. QUJDA is an attack detection mechanism, which uses an anomaly-based approach and operates in a distributed manner. It separates attacking cases from natural network conditions by the help of packet delivery ratio, bad packet ratio, and the amount of energy consumption parameters. QUJDA enables sensor nodes to operate with their neighbors in a collective sense in order to achieve higher detection rates. QUJDA was evaluated and analyzed over 3 parameters: detection rates, false-positive rates, and communication overheads. According to the simulation results obtained, all critical jamming attacks can be detected with 97% or above detection rates, along with 0.95% or lower false positive rates. In addition, QUJDA only charges about 13% extra communication overhead to the network message traffic of the sensor nodes. Key Words: Wireless sensor network, jamming attacks, denial of service, intrusion detection
1.
Introduction
WSNs consist of several autonomous wireless sensor nodes that incorporate a series of small, integrated, application-specific sensors, a communication radio, and a battery. The size of these ad hoc-based networks primarily depends on the requirements of the application. The task of each node generally incorporates monitoring varied physical, chemical, or biological parameters in the target environment. The data obtained from sensor nodes is forwarded to the nearest neighbor nodes in an ad hoc manner. The nodes, scattered ∗ A preliminary version of this paper appeared in ACM Infoscale 2008, June 10-12, Italy [17]. This paper includes an updated version of jamming detection algorithm, detailed description of detection algorithm, and further performance analysis.
1
Turk J Elec Eng & Comp Sci, Vol.19, No.1, 2011
randomly in the target fields or buildings, use a common communication protocol and follow a predetermined scenario [1]. The sensor nodes usually operate outside and mostly in severe environments such as storms, blizzards, heavy rains, and so forth. Therefore, a risk of physical or functional damage cannot be avoided in many cases. Worse still, the sensor nodes can be reprogrammed by adversary people so that seized sensor nodes can cause several network failures [2]. This type of security hazard facilitates the development of various styles of attack in WSNs, such as the jamming-style denial of service (J-DoS) attacks, in which attacker nodes (jammers) inject strong artificial radio signals into the network to block the existing communication between the sensor nodes [3-5]. In earlier studies, several research topics were examined for the J-DoS attacks in the MAC and physical layers. While Wood et al. defined collision, exhaustion, and unfairness attacks [3], Xu et al. derived constant, deceptive, reactive, and random jammers inspired by those 3 jammers [4]. Reactive jammers resemble collision jammers, deceptive jammers resemble exhaustion jammers, and constant jammers resemble unfairness jammers. Each jammer has its own individual jamming technique; for example, the constant jammer sends out random bits to the medium without following any MAC-layer etiquette. The communication among the nodes is suspended by these activities. Instead of sending out random bits constantly, the deceptive jammer transmits the legitimate packets to the medium at high rates. In this manner, nodes remain in receiving mode constantly, and thus, the communication medium is kept unavailable all the time. On the other hand, the random jammer attacks the network at random time slots, and sleeps in the other periods to preserve its energy. As for the reactive jammer, it listens to the network constantly and initiates an attack when a preamble of a packet is detected. In other words, it attacks only when the network is busy. Law et al. proposed a couple of energy efficient jammers for various MAC protocols [6, 7]. They showed that many attacking scenarios could be implemented by utilizing the constant timing structure of the S-MAC protocol. Since no encryption technique is used in the data link layer, the contents of the data packets can be revealed without any difficulty. Thus, the listen/sleep timings of the nodes can be estimated with the help of SYNC packets. Using this mechanism, 3 energy efficient jammer models have been developed by Law et al.: a periodic listen interval jammer (LIJ), periodic control interval jammer (CIJ), and data packet jammer (DaJ). Another jammer type that has been developed by Law et al. uses a prediction mechanism on encrypted packets of the message. This jammer, called a periodic cluster jammer (PCJ), corrupts the data packets in the S-MAC frames [7]. In other research conducted by Wood et al., 4 new energy-efficient jammers were proposed [8]. The interrupt jammer (IJ) listens to the network to detect any packet traffic in the medium. Instead of constant listening, the IJ uses a peripheral hardware unit, which initiates an interrupt signal when a preamble and a start of frame delimiter (SFD) are encountered in the network, to reduce the energy consumption caused by its radio unit. When the packets are encrypted, the detection of packet segments (i.e. preamble and SFD) becomes complicated. The activity jammers are equipped with an extra unit to overcome this difficulty by periodically sensing the received signal strength indicator (RSSI) level. When a predefined level of RSSI is detected, the jammer initiates an attack by assuming the existence of an ongoing communication. Scan jammers search through all existing channels periodically, and as long as any network traffic is detected, they initiate an attack in the current channel. However, the pulse jammer remains on a single channel and sends out small packets periodically to impede the ongoing communication [8]. 2
˘ ¨ ˙ Design and evaluation of a query-based jamming detection..., C ¸ AKIROGLU, OZCER IT:
In this study, we designed QUJDA, which uses the anomaly method and operates in a distributed manner, to detect J-DoS type of attacks. Each sensor node in our simulation environment was assumed to be installed with QUJDA. QUJDA utilizes PDR, BPR, and ECA parameters to differentiate jamming conditions from natural network conditions. Moreover, QUJDA uses a collective determination approach, which is based on exchanging QUERY and REPLY packets between the neighbor nodes to improve detection performance. The contributions of this paper are: • Isolating jamming-style attacks from natural network conditions such as collision, hardware, and software faults, while maintaining a high detection rate along with a low false positive rate; • Wide-ranging and lightweight detection mechanism for various types of jamming attacks; and • No additional hardware (GPS, DSP, etc.) requirement for detection mechanisms. The rest of the paper is organized as follows. Section 2 presents the related research studies on jamming detection systems for WSNs. Section 3 describes the proposed query-based jamming detection algorithms for wireless sensor networks. The performance evaluation of the proposed query-based jamming detection algorithm is presented in Section 4. The paper is concluded by Section 5.
2.
Related works
Although many jammer models have been proposed in the literature, the detection methods for these jammer models have not been studied sufficiently. Xu et al. developed 2 distinct methods for the detection of 4 types of jammers that they had proposed earlier [4]. In the first method, packet delivery ratios (PDR) and RSSI dispersion ratios are used to distinguish the legitimate operations from the jammed ones. A range of scenarios was applied to measure the PDR parameters associated with RSSI values. In doing so, appropriate threshold signal levels were sampled so that 2 distinct regions in the network could be determined: benign and jammed regions. Any node having lower PDR levels than PDR threshold levels and higher RSSI level than RSSI threshold level suggests that an attack exists. The major disadvantage of this method is that the system is tested by only 3 nodes: a transmitter, a receiver, and a jammer. The collision rates can be augmented due to the high number of neighbor nodes; however, the RSSI parameter cannot be easily determined [9]. Thus, the detection performance of this method can be considerably decreased, especially in large-scale and high-density networks. In the second method proposed by Xu et al., PDR values and the location data of the nodes are utilized for detection procedures. However, this method requires some additional global positioning system (GPS) hardware or localization techniques. Another detection mechanism for jamming attacks was suggested by Wood et al., in which the jammers could be identified by the channel utilization rate compared with a specified threshold value [5]. However, the channel utilization rate can also be decreased by failures originating from the hardware and software faults of the surrounding neighbor nodes. The channel utilization rate, therefore, cannot be used alone to determine the presence of an attack. 3
Turk J Elec Eng & Comp Sci, Vol.19, No.1, 2011
3.
The design of the proposed query-based jamming detection algorithm
In order to fulfill all responsibilities and maintain all functions for a WSN, jamming attacks should be detected and an appropriate solution for each jammer should be provided accordingly. We designed QUJDA, in which an anomaly-based distributed method is used to detect the jammers listed above, by taking into account those requirements. In this section, the designed algorithm will be explained in detail.
3.1.
The detection parameters of jamming attacks
Jamming attacks can corrupt communication completely in the sensor networks or cause some abnormal conditions to occur. Many quantitative network parameters, such as collision rate, RSSI, and bad frame ratios, can reflect the stability of the network. Anomaly-based methods can make use of these parameters to determine the state of the network. However, abnormal conditions can also originate from either adverse scenarios or natural sources such as hardware faults, software bugs, heavy precipitation, and blizzards. For instance, congestion in a sensor network might be caused by one of these natural sources. The jamming detection procedures can be very complicated if smarter jammers are deployed in WSNs. For successful detection, the difference between normal and abnormal conditions must be clarified properly. Otherwise, false positive occasions may turn the detection mechanisms into useless and redundant resources. In our jamming detection system, we used some network parameters, such as PDR, bad packet ratio (BPR), and energy consumption amount (ECA), obtained from the MAC layer to differentiate the network conditions either caused by natural sources or jamming attacks. 3.1.1.
Packet Delivery Ratio (PDR)
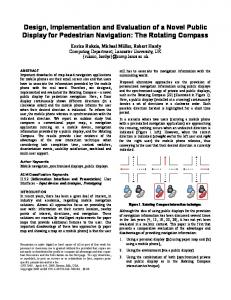
The packet delivery ratio is defined as the ratio of successfully delivered packets over the number of sent packets [4]. A sender node confirms the deliverance of a packet only upon receiving an ACK packet from a receiver node. If 4-way handshaking (RTS/CTS/DATA/ACK) is used, the PDR can be found by comparing the RTS/DATA packets sent with the CTS/ACK packets received. We conducted a set of network simulations to investigate the effect of PDR values over the performance of the detection procedures by which normal and abnormal network conditions are separated from each other. The sensor network under test was simulated throughout 36,000 s and the PDR parameter was measured with a sampling rate of 30 s intervals in the OMNET++ [10] simulation environment, about which details will be given in Table 3 in Section 4. Each bar in Figure 1 indicates minimum, average, and maximum PDR values obtained from a single node by a singular simulation with intervals of 30 s. PDR values obtained from all simulations, apart from natural network conditions, can be combined roughly into 4 groups. As seen in Figure 1, constant, deceptive, and control/listen interval jammers occupy the communication medium all of the time, and they impede the sensor nodes from sending any packets. Similarly, reactive and interrupt jammers corrupt the packets as soon as any transaction in the network is detected. As a result, the PDR values obtained during the attacking period of these jammers are almost 0. The second group includes a data packet and random jammers. The PDR values obtained while a random or data packet jammer operates in the network primarily depend on the sleep/attack periods of the jammer. As 4
˘ ¨ ˙ Design and evaluation of a query-based jamming detection..., C ¸ AKIROGLU, OZCER IT:
the attacking time gets longer, PDR values monitored in the sensor nodes are subject to substantial decrease, since these jammers can predict the timing of the packets precisely. However, the jamming performance depends on the effectiveness of the prediction mechanism in which CTS packets are detected. No:Normal ReJ:Reactive Jammer LIJ:Listen Jammer IntJ:Interrupt Jammer
Con:Congestion RaJ:Random Jammer CIJ:Control Jammer ActJ:Activity Jammer
Los:Lossy Link CoJ:Constant Jammer DaJ:Data Jammer PulJ:PulseJammer
NeiF:Neighboor Fault DeJ:Deceptive Jammer CluJ:ClusterJammer ScJ:Scan Jammer
100 Packet Delivery Ratio (%)
90 80 70 60 50 40 30 20 10 0
No
Con Los NeiF ReJ RaJ CoJ
DeJ LIJ CIJ Scenarios
DaJ CluJ IntJ ActJPulJ ScJ
Figure 1. The average PDR ratios sampled in a sensor node with diverse scenarios (sampling period: 30 s, simulation length: 36,000 s, error bars indicate extreme values).
Cluster and pulse jammers, forming the third group, have PDR ratios between 15% and 30%. Although a cluster jammer has a built-in prediction mechanism for data packet timings, some data packets can even be omitted. Likewise, the periodic nature of the pulse jammer impedes a prevailing jamming attack. Therefore, these jammers’ attack PDR values are not as low as expected. Finally, activity and scan jammers are not as efficient as the others are; PDR values are always above 50%, which means that the efficiency of the attack appears to be trivial for both jammers. Higher PDR values can be explained by the fact that activity and scan jammers are not fast enough to sense all of the network activities. The PDR parameter is not only decreased by a jammer attack, but is also decreased significantly by imperfect connections, faults in the neighbor nodes, or network collisions. In fact, the PDR cannot be used alone to discriminate natural network conditions from the symptoms of the attacks. 3.1.2.
Bad Packet Ratio (BPR)
As for the second parameter, BPR is defined as the number of damaged packets received divided by the total number of packets or preambles received for a sensor node. Sensor nodes determine the reliability of packets by using the cyclic redundancy check (CRC) test and drop off the packets if the CRC test returns a negative result. We repeated the simulation (details and configurations are given in Section 4) for the BPR parameter for 36,000 s with a sampling rate of 30 s intervals. Each bar in Figure 2 indicates minimum, average, and maximum BPR values obtained from a single node by a singular simulation with 30 s intervals. Since no valid preamble or packet exists in the case of constant or listen/control interval jammer attacking scenarios along with faulty 5
Turk J Elec Eng & Comp Sci, Vol.19, No.1, 2011
neighbor node scenarios, BPR values were obtained as almost 0. Having high BPR ratios in most attacking scenarios facilitates the separating of the attacking and natural network conditions from each other. However, in the event of low BPR ratios, separating the natural network conditions from the attacking conditions can be particularly complicated. No:Normal ReJ:Reactive Jammer LIJ:Listen Jammer IntJ:Interrupt Jammer
Con:Congestion RaJ:Random Jammer CIJ:Control Jammer ActJ:Activity Jammer
Los:Lossy Link CoJ:Constant Jammer DaJ:Data Jammer PulJ:PulseJammer
NeiF:Neighboor Fault DeJ:Deceptive Jammer CluJ:ClusterJammer ScJ:Scan Jammer
100
Bad Packet Ratioı (%)
90 80 70 60 50 40 30 20 10 0
No Con Los NeiF ReJ RaJ CoJ DeJ LIJ Scenarios
CIJ DaJ CluJ IntJ ActJ
PulJ ScJ
Figure 2. The average BPR ratios sampled in a sensor node with diverse scenarios (sampling period: 30 s, simulation length: 36,000 s).
PDR and BPR parameters demonstrate the quality of communication for the transmitter side and receiver side, respectively. These 2 parameters are in inverse proportion in most cases; however, both the BPR and PDR parameters can be low in some particular cases. For example in Figure 3, if node B and node C are assumed to be under an attack from constant, deceptive, or listen/control interval jammers, these sensor nodes cannot perform a healthy transaction because of persistent jamming signals. In such cases, the PDR ratios of the attack-free sensors (node A, a boundary node) can be decreased while their neighbor nodes are under attack, since they are
Sink Node
C B A
Jammer
Boundary Node Boundary Nodes
Figure 3. A jamming model.
6
˘ ¨ ˙ Design and evaluation of a query-based jamming detection..., C ¸ AKIROGLU, OZCER IT:
not able to receive ACK packets from their neighbors. However, the BPR ratios of such nodes remain at a very low level, as they are not subject to direct attacks. In such scenarios, even though the node is affected by the attack, both PDR and BPR levels can remain at low levels. This occurrence is contradictory to the common relationship between PDR and BPR parameters and, consequently, the jamming detection procedures can be intricate. 3.1.3.
Energy Consumption Amount (ECA)
ECA is defined as the approximate amount of energy consumed in a period of time by a sensor node. The ECA parameter can be calculated by the help of the periods of working modes of the MICA2 nodes. The radio unit of a MICA2 node consumes 16.5 mA, 9.6 mA, and 1 μA in transmit, receive, and sleep modes, respectively [11]. This means that with a 3 V battery, the radio unit of the MICA2 node dissipates 49.5 mW, 28.86 mW, and 3 μW of power per hour in the transmit, receive, and sleep modes, respectively. The estimated power dissipation of a MICA2 node can then be calculated for a specified time by using the operating periods of radio unit and the power dissipation rates given above.
Energy Consumption Amount (μW)
No:Normal ReJ:Reactive Jammer LIJ:Listen Jammer IntJ:Interrupt Jammer
480 440 400 360 320 280 240 200 160 120 80 40 0
Con:Congestion RaJ:Random Jammer CIJ:Control Jammer ActJ:Activity Jammer
Los:Lossy Link CoJ:Constant Jammer DaJ:Data Jammer PulJ:PulseJammer
NeiF:Neighboor Fault DeJ:Deceptive Jammer CluJ:ClusterJammer ScJ:Scan Jammer
No Con Los NeiF ReJ RaJ CoJ DeJ LIJ CIJ DaJ CluJ IntJ ActJPulJ ScJ Scenarios
Figure 4. The average ECA ratios sampled in a sensor node with diverse attacking scenarios, along with natural network conditions (sampling period: 60 s, simulation length: 36,000 s).
We repeated the simulation (details and configurations are given in Section 4) for the ECA parameter for 36,000 s with a sampling rate of 30 s intervals. Each bar in Figure 4 indicates minimum, average, and maximum ECA values obtained from a single node by a singular simulation with 30 s intervals. ECA values obtained from congestion, lossy links, or faulty neighbor nodes, along with some attacking scenarios, can be lower than the ECA values that are obtained from normal scenarios. This situation is caused by the fact that in normal scenarios, sensor nodes transmit and receive more packets compared to natural network conditions. In addition, in deceptive, constant, random, and listen/control interval jammer attacks, the ECA parameter of the sensor nodes is very high compared to natural network conditions. While deceptive jammers force the nodes to remain continuously in receive mode, constant and listen/control interval jammers force the sensor nodes to remain in listen mode, and therefore, ECA values obtained from the simulation can be verified in this manner. 7
Turk J Elec Eng & Comp Sci, Vol.19, No.1, 2011
Constant and listen/control interval jammers keep nodes in BACKOFF mode since the communication medium is always busy. The nodes continue to remain in listen mode, even though they are released from the BACKOFF period in the sleep mode. Therefore, nodes in the BACKOFF period cannot be shifted into a sleep period, and this constraint cause the nodes to deplete their batteries earlier. Since there is no IDLE mode in the CC1000 radio unit, the nodes dissipate equivalent power under attack from constant, listen/control interval, and deceptive jammers. The nodes under attack from random, constant, deceptive, and listen/control interval jammers consume more power than normal network scenarios and this outcome can be used to distinguish the normal and jamming scenarios from each other.
3.2.
The method of anomaly detection
We selected PDR, BPR, and ECA as system parameters that are directly affected by jamming attacks to determine anomalies in the network. Each node with a QUJDA unit utilizes the system parameters to compare initial network conditions with the current network conditions. The nodes measure and analyze the system parameters during the initialization period and, subsequently, the threshold values, which are used to separate normal network conditions from abnormal ones with the help of some statistical operations and dispersions, are determined. The flowchart of the determination of threshold values that were used for anomaly identification is illustrated in Figure 5. The critical threshold values that allow the separation of normal and abnormal network conditions were obtained from procedures in which software techniques such as system parameters dispersion and data mining were utilized. In the determination of infiltration systems, mainly statistical techniques, artificial neural networks, hidden Markov models, support vector machines, neuro-fuzzy operations, and genetic algorithms are deployed in the literature [12, 13]. However, statistical techniques are widely preferred because they induce an insignificant process burden into procedures. Therefore, statistical methods can be considered one of the appropriate solutions for sensor nodes that have limited computing and energy resources.
Start
Measure PDR, BPR, and ECA Parameters and record the dispersion (Periodically)
Initialization period over?
N
Y Determine threshold values using PDR, BPR, and ECA dispersion Stop
Figure 5. Obtaining threshold values for anomaly determination.
8
˘ ¨ ˙ Design and evaluation of a query-based jamming detection..., C ¸ AKIROGLU, OZCER IT:
The QUJDA system that we designed employs the 6-sigma (6 σ) statistical method to determine normal/abnormal network conditions. This method was originated by MotorolaTM in 1987. It is implemented with the goal of describing a high level of quality, which a company tends to achieve. This method includes a simple yet effective approach in which a low control limit (LCL) and high control limit (HCL) can be calculated with the help of the average and standard deviation of the distribution of the system parameters. In equations (1) and (2), while μ represents the average values of N numbers of data, σ stands for standard deviation. In a normal distribution, 99.99966% of the data is within the HCL and LCL. A value outside of the HCL and LCL can be accepted as abnormal, as seen in Figure 6. Each node deployed with QUJDA investigates the distribution of the PDR, BPR, and ECA parameters and tries to detect abnormal conditions. The jamming detection algorithm we proposed uses the 6-sigma methods for this purpose. LCL = μ + 6σ
(1)
HCL = μ − 6σ
(2)
f(x)
Abnormal
Abnormal
(LCL)
(HCL)
x
Figure 6. Determination of threshold values of the system parameters.
The LCL is calculated to find the PDR threshold value and the HCL is used to find the BPR and ECA threshold values. Since lower PDR levels can normally suggest an anomaly condition in the network, the LCL is used for the PDR threshold calculations. On the other hand, higher BPR and ECA levels can normally suggest an anomaly; therefore, the BPR and ECA threshold values are calculated by means of the HCL. Having performed these calculations, thresholds values belonging to the system parameters (PDR th , BPR th , and ECA th ) can be determined. According to the obtained results, having determined the threshold values, the 6-sigma method has produced optimum results. However, simulations in which lower sigma numbers (5-sigma, 4-sigma, etc.) are used result in increased detection rates along with greatly increased false positive rates. On the other hand, using higher sigma numbers (7-sigma, 8-sigma, etc.) decreases both detection and false positive rates together. As a result, we preferred the 6-sigma method in the determination process of threshold values through all simulations.
3.3.
A Query-based jamming detection algorithm
QUJDA is an anomaly-based and distributed algorithm by which jamming attacks can be detected by means of a set of network parameters, namely, PDR, BPR, and ECA. QUJDA, which is deployed in each node in the 9
Turk J Elec Eng & Comp Sci, Vol.19, No.1, 2011
network, monitors the PDR, BPR, and ECA parameters in a specified period and records the threshold levels of each parameter by the 6-sigma method when no attack is present. Having completed the initialization stage, each node continues monitoring its parameters periodically to observe any anomaly by comparing the initial and current levels of the parameters. Each node runs the QUJDA algorithm independently to detect network anomalies. However, this mechanism cannot be fulfilled by only the threshold mechanism when a high performance result is needed. For instance, a node that is located outside of the coverage area of the jammer, like node A in Figure 3, can be disturbed indirectly by the jammers through its neighbors, and that is called a boundary node. In the boundary nodes, while the PDR is measured as low, the ECA and BPR ratios can remain at normal levels. This condition can occur for the nodes that have a faulty neighbor node. In order to minimize these drawbacks, QUJDA uses a collective determination approach, which is based on exchanging QUERY and REPLY (QR) packets between the neighbor nodes that have assumed themselves to be under attack according to the correlation of the PDR, BPR, and ECA parameters. QUJDA samples the PDR, BPR, and ECA parameters periodically and compares them with the threshold values that are obtained during the initialization period of the network. If an abnormal condition is encountered in the comparison procedures, the node initiates the QUERY procedure immediately to discover the origin of the anomaly. Having sent a QUERY packet in a predefined time, the node waits for a reply packet from its neighbors. The REPLY packets received are used to observe the state of the neighbor nodes. In some scenarios, however, intricate conditions can occur throughout the QR packets’ transaction procedures. For instance, the constant and deceptive jammers can even block the QR packets since they occupy the channel all the time. While reactive jammers corrupt the QUERY packets, data packet jammers cannot attack QR packets. Therefore, to separate the jamming and bad network conditions from each other and to facilitate the detection procedures, we designed a special frame for the QR packets, as shown in Figure 7. 2 bytes
2 bytes
2 bytes
Node_ID
Target_ID
Packet_ID
N/A
1 byte Flags
.....
N/A
Forced
Alarm
Figure 7. The frame structure of QUERY and REPLY packets.
As seen in Figure 7, the QR packets consist of 7 bytes. While QUERY packets are sent by broadcast to the medium, the REPLY packets are sent by unicast. The ALARM flag in the QR packets indicates an anomaly and it is set if the anomaly is positive. A sensor node suspecting itself under a jammer attack will set the ALARM flag in the QUERY packet and wait for the REPLY packets from its neighbors in response. The neighbors that received QUERY packets check their PDR, BPR, and ECA values, and if an anomaly is detected, the ALARM flag in the REPLY packet is set. Additionally, the nodes can be informed by their onehop neighbors with the help of ALARM flags in the REPLY packets. This mechanism facilitates the detection of the jammers attacking the data packets in particular. Since these types of jammers attack only large-sized data packets, they can neither block nor corrupt the QR packets. The FORCED flag in the QUERY packets indicates that a sensor node has sent out a forced QUERY packet. If the node is not able to send a QUERY packet in a particular time, it assumes that the channel is occupied by a jammer. In this case, the node sends out a QUERY packet by setting the FORCED flag in 10
˘ ¨ ˙ Design and evaluation of a query-based jamming detection..., C ¸ AKIROGLU, OZCER IT:
the QUERY packet. Because the channel is busy all the time, the node sends out the packet by disregarding the contention rules and increasing the transmitter power level. Thus, the probability of the boundary nodes receiving QUERY packets can be augmented and jamming detection procedures can be further facilitated. QUJDA works as follows: 1. The node detecting an abnormal condition in the network tries to send a QUERY packet in 2 sampling periods by following node contention rules. By setting the ALARM flag in the QUERY packet, the node indicates that there is a high risk of an attack and the condition will be resolved by further transactions between its neighbors. (a) If the node sends the QUERY packet in the allocated time, it waits for the REPLY packets sent by neighbor nodes. (b) If the node is not able to send a QUERY packet in the allocated time, it assumes a jamming attack is in progress, caused by constant, deceptive, or listen/control interval jammers. 2. If the node resolves that an attack is present, in order to complete the jamming detection procedures in a secure manner, the node tries to send FORCED QUERY packets 3 times with random intervals by disregarding the contention rules. In this procedure, the node uses a higher rate of power for transmitting FORCED QUERY packets. Thus, the possibility of the boundary nodes receiving the FORCED QUERY packets and the accuracy of both detection rates and faulty conditions can be improved. 3. The nodes receiving QUERY packets check their PDR, BPR, and ECA parameters and send back the REPLY packets by either setting or resetting the ALARM flag in the REPLY packets. If PDR n < PDR th and ECA n > ECA th , or PDR n < PDR th and BPR n > BPR th conditions are true, the ALARM flag is set or reset if the conditions are false. Setting the ALARM flag in the REPLY packet means that the node is under abnormal conditions. 4. The node evaluates the REPLY packets once the REPLY timer is over and determines a jammer attack is present if the following conditions are true: (a) No REPLY packet is received. (b) The number of REPLY packets received is lower than the number of neighbors and no REPLY packet is received from the neighbors on the way of the sink node. (c) The number of REPLY packets received is lower than or equal to the number of neighbors and the ALARM flag in the REPLY packet, received from the neighbors on the way of sink node, is set. The notations used in QUJDA are given in Table 1 as a list, and in Table 2, the pseudocode of QUJDA not only incorporates basic network parameters (variables), but also deploys QR message procedures (functions). 11
Turk J Elec Eng & Comp Sci, Vol.19, No.1, 2011
Table 1. The notation used in QUJDA.
Notation SendingQuery QuerySent QueryRcvd ForcedQuerySent ForcedQueryRcvd QueryTimerOver ReplyTimerOver NumOfForcedQuery SetQueryTimerFunc() SetReplyTimerFunc() StopQueryTimerFunc() SendQueryFunc() SendForcedQueryFunc() AnalyzeReplyPacketsFunc()
Meaning A Boolean variable to indicate the state of a query being sent A Boolean variable to indicate the state of a query packet sent A Boolean variable to indicate the state of a query packet received A Boolean variable to indicate the state of a forced query packet sent A Boolean variable to indicate the state of a forced query packet received A Boolean variable to indicate the state of the query timer A Boolean variable to indicate the state of the reply timer An integer variable to indicate the number of forced query packets sent A function to set the query timer A function to set the reply timer A function to stop the query timer A function incorporating the query procedures A function incorporating the forced query procedures A function to analyze the reply packets
Table 2. Query-based jamming detection algorithm.
//Called each sampling period QueryBasedJammingDetectionAlgo(){ if ((PDRn < PDRth and ECAn > ECAth ) or (PDRn < PDRth and BPRn > BPRth )) //Anomaly if (SendingQuery = False) SendQueryFunc() SetQueryTimerFunc(Now+2*SamplingPeriod) SendingQuery = True else if (QueryTimerOver = False and QuerySent = True) StopQueryTimerFunc() SetReplyTimerFunc(Now+2*SamplingPeriod ) else if (QueryTimerOver = True and QuerySent = False) Jammed = True If (NumOfForcedQuery