AbstractâA software prototype to support the planning process ... home computer market. .... computer based planning tool in environmental planning and.
94
IEEE TRANSACTIONS ON REHABILITATION ENGINEERING, VOL. 8, NO. 1, MARCH 2000
Design and Evaluation of a Software Prototype for Participatory Planning of Environmental Adaptations Joakim Eriksson, Åsa Ek, and Gerd Johansson
Abstract—A software prototype to support the planning process for adapting home and work environments for people with physical disabilities was designed and later evaluated. The prototype exploits low-cost three-dimensional (3-D) graphics products in the home computer market. The essential features of the prototype are: interactive rendering with optional hardware acceleration, interactive walkthroughs, direct manipulation tools for moving objects and measuring distances, and import of 3-D-objects from a library. A usability study was conducted, consisting of two test sessions (three weeks apart) and a final interview. The prototype was then tested and evaluated by representatives of future users: five occupational therapist students, and four persons with physical disability, with no previous experience of the prototype. Emphasis in the usability study was placed on the prototype's efficiency and learnability. We found that it is possible to realise a planning tool for environmental adaptations, both regarding usability and technical efficiency. The usability evaluation confirms our findings from previous case studies, regarding the relevance and positive attitude towards this kind of planning tool. Although the prototype was found to be satisfactorily efficient for the basic tasks, the paper presents several suggestions for improvement of future prototype versions. Index Terms—Environmental adaptation, iterative prototyping, participatory planning, usability, usability testing.
I. INTRODUCTION A. Background
P
ARTICIPATORY planning is nowadays a widely adopted concept in ergonomics, where it has been employed in a wide range of disciplines, e.g., workplace design, work organization, production/manufacturing, and product design [1], [2]. The basic principle is to involve people in planning and controlling a significant amount of their own work activities. The planning should be viewed as an iterative process, where as many affected people as possible should be involved in successive workgroup meetings. It is important that this involvement is not merely to inform people on plans already decided upon, but rather to support a genuine and active influence throughout the process [3]. Wilson [1] describes a wide range of methods that have been used in different participatory planning situations, where selecting the appropriate method should be decided by the context of planning and the participants' expertise. He concludes that the “natural” participants in a planning group should have enough skills and knowledge to use the appropriate tool themselves (while having the possibility for obtaining assis-
Manuscript received August 18, 1999; revised October 13, 1999. This work was supported in part by the Swedish Handicap Institute. The authors are with the Department of Design Sciences, Lund Institute of Technology, Lund University, Lund SE-221 00, Sweden. Publisher Item Identifier S 1063-6528(00)01600-1.
tance from experts, when needed). One example of a computer based technique that directly addresses participatory planning has been presented by Akselsson et al., who developed a visualization technique for industrial production and organisation planning [4]. The production lines and the workers' actions were described by computer images and animations, and it was found that such visualisations supported understanding and communication between the participants. Workers who formerly had minor influence in the production planning could better contribute with their specific knowledge and make suggestions of their own. 1) Environment Adaptations: In the area of adapting or constructing environments for people with physical disabilities, it is of vital importance that the adaptation/construction is optimized with respect to the human-environment interactions with the end-user(s). In different countries, there may be a varying amount of rules and laws that guide and regulate such designs. For example, in the United States such sources are the Americans with Disabilities Act1 (ADA) [5] and the American National Standards Institute2 (ANSI). Also, one may find examples of nonlegislative recommendations in literature, such as in Goldsmith [6] who catalogues a large amount of design recommendations in this area. However, regulations or literature can never provide all the experience needed to completely avoid poor solutions. To overcome the lack of first-hand experience among architectural students, Lifchez [7] conducted field studies in which people with physical disability attended as consultants in design projects. These consultants were found to add valuable knowledge and experience to the project groups, and many issues were raised that would otherwise have been overlooked, indicating that the quality of a design benefits greatly from such cooperation in the design phase. Today, people with disability are encouraged to participate when discussing and planning for their rehabilitation. An occupational therapist (OT) has the skills for conducting an environmental and functional assessment. In order to obtain a barrier-free environment, an OT can together with the person with disability (PD), try out equipment, and consult with medical expertise, funding organizations, architects, engineers, etc. In Scandinavia and many other European countries, it is usually an OT who has the coordinating role when planning adaptations of interior environments (“environment” referring not only to constructional aspects of buildings, but also to furniture and equipment). In the U.S., environment adaptations are clearly within 1Americans
with Disabilities Act (1990): Public Law 101-336. National Standards Institute (1980): Specifications for making buildings and facilities accessible to, and usable by, the physically handicapped. 2American
1063–6528/00$10.00 © 2000 IEEE
ERIKSSON et al.: PROTOTYPE FOR PARTICIPATORY PLANNING OF ENVIRONMENTAL ADAPTATIONS
the scope of the OT profession according to the American Occupational Therapy Association (AOTA) [8], [9]. Although Taira [10] and Acheson-Cooper et al. [11] argue for an increased role for OT’s in environmental adaptations, there may, however, be cases where architects or engineers have the coordinating role instead (depending on the nature of the adaptations, and/or traditions of different states). In order to let involved people participate in the planning process, the coordinator may assemble planning groups to discuss, e.g., economic or technical issues. The size and structure of planning groups may differ substantially depending on the complexity of the adaptation. The participants in such a planning group may represent different categories as follows: • the coordinator, for instance an OT, architect, or engineer; • the PD(s), who are to be the primary end-user(s) of the adaptation; • relatives, work colleagues, nursing/home-service personnel, who are also to be users of the adaptation, or will be affected by it; • representatives of the financing organization; • architects and/or construction engineers, who may represent the municipality, or be contracted regarding construction of the adaptation. One should expect that the participants vary greatly in previous knowledge and experiences in environmental planning. It may therefore be beneficial to have a series of planning sessions where participants can communicate and make suggestions on equal terms. As an aid in such a process, a computer-based planning tool could be used to support communication between the individuals of the planning group, and increase understanding of what is being planned. Architectural and workplace design are areas in which considerations about physical functionality, such as space requirements and accessibility, frequently need to be evaluated. Since the 1960’s, both architects and ergonomists have employed computer-aided design (CAD) as an aid to evaluate these, and similar issues [12], [13]. CAD has been used particularly in workplace design to evaluate critical man–machine or man–environment interactions with the help of mannequins (i.e., computer models of humans), of which SAMMIE and JACK belong to the most well-known among ergonomists [14]–[16]. Furthermore, CAD serves as a communication channel between designers, and combined with this medium's built-in capacity to make an unlimited number of improvements, an iterative design process are thereby encouraged [17], [18]. Several examples of design studies directly address people with physical disabilities, where CAD and virtual reality have been used to improve the evaluation of human–environment interaction [19]–[22]. However, some special considerations need attention in order to use CAD (or similar three-dimensional (3-D) graphics techniques) in such planning processes addressed here: CAD systems are, in general, targeted for professional designers (for instance engineers and architects), and retain an extensive set of functions for this field of use. As these systems are required to be versatile, it is difficult to avoid a complex interface, where many symbols and operations may require background knowledge about the design context. For use by nonskilled designers,
95
it would be necessary to customize or filter out some interface components. Furthermore, CAD systems have typically been influenced by traditional, pre-computerized drawing methods, and in architecture CAD systems are still mainly used to produce two–dimensional (2-D) drawings [23], [24]. We believe that CAD or 3-D modeling systems that can support direct interaction with 3-D objects would better support nonskilled users. Nowadays, interactive 3-D-graphics are supported on a wide variety of platforms, and 3-D-modeling techniques and formats that are more object oriented have emerged [25]. B. Previous Work In previous work, we have investigated the possible use of a computer based planning tool in environmental planning and adaptation [26]. A prototype (compiled from commercially available programs) for 3-D modeling of planned environments was used in six real life case studies [27]. With these case studies, it was found that such a planning tool would be useful in supporting understanding, communication and participation among the people involved in the planning process. The coordinator would be able to design and evaluate multiple alternatives at an early stage, and make improvements throughout the planning process. The PD would also be able to plan his/her own environment and make suggestions throughout the planning process. During planning sessions, it would be possible to visualise different suggestions, and interactively make changes and explore new solutions. To gain general acceptance, objectives on efficiency need to be fulfilled concerning the use of a computer based planning tool in a planning process: 1) the planning process should not become delayed or unnecessarily complicated as a result of using such a tool; 2) the expenses in purchasing and maintaining such a planning tool should be moderate; and 3) as there may be considerable variations in computer experience among the persons involved in a planning process (as well as between different OT’s), such a planning tool must be easy to learn and easy to use, especially with frequently used operations, e.g., conducting walkthroughs or moving objects. The studies indicated that although the majority of the people involved found the prototype useful, several limitations were found regarding efficiency and supported features. Examples of flaws in the user interface were revealed, e.g., when changing viewpoint and importing new objects. The most important efficiency aid is the availability of an extensive library of 3-D objects. Much time can be saved if users can import objects, and if needed make some simple modifications, instead of modeling objects from scratch. OT’s would normally not be able to spend the time and effort required for modeling objects from scratch. As a conclusion of the case studies, we found that a future program must be appropriate for all people involved in a planning process. The program would be specialized in supporting the following activities: 1) choosing construction elements from a 3-D object library, such as modules of walls, doors, and windows, and assembling them into one or many rooms; 2) bring in furniture, or other equipment of interest, and creating different interior arrangements; 3) mannequin manipulation for testing ergonomic aspects such as reach, clearance, accessibility, etc.; 4) during planning sessions, support interactive walkthroughs
96
IEEE TRANSACTIONS ON REHABILITATION ENGINEERING, VOL. 8, NO. 1, MARCH 2000
and rearrangements. With this narrow scope, the purpose can not be to replace comprehensive CAD or 3-D modeling systems. Instead, the program must rely on an open, cross-application architecture where other programs provide supplementary functions. 1) Further Prototyping Based on Findings from Case Studies: Since the case studies found it necessary to develop the prototype further, the question arose whether we should select and modify an existing 3-D-graphics system among the hundreds that were commercially available, or whether we should design the software ourselves. If choosing the first approach, an appropriate system should have a flexibility in customizing the interface, in order to suit all kinds of people in a planning group, and focusing on interactive manipulation of 3-D models. Since many CAD systems have great potentials in customizing the interface and in adding/removing modules, this approach may have been possible to carry out. However, the latter approach was chosen considering the following aspects: 1) Cost effectiveness: If such a program are to be widely adopted it should preferably be a free-ware, or cost less than a few hundred dollars 2) Platform support: The program would clearly be used more if running on consumer oriented computer systems. 3) 3-D-acceleration: If one decides to settle for consumer oriented hardware and software components, one critical factor is rendering speed when interacting with 3-Dmodels, which can be improved by hardware acceleration. In recent years, the PC-game industry has stimulated the development of low-cost 3-D-acceleration hardware, and few graphic cards sold at present lack acceleration of 3-D-graphics. Unfortunately, not all existing CAD/3-D-modeling packages currently make optimal use of this, depending on what operating system they can run on, and whether they can benefit from a 3-D-graphics API (Application Programming Interface) [28]. A new prototype, to be used in the process of environmental adaptations, has been developed. Since the people involved in the planning process may lack or have only limited computer experience, it places great demands upon the design of the prototype's user interface; it must be easy to learn and easy to use. Emphasis on user-friendliness was kept in mind all through the development of the prototype. At this stage in the development, we therefore conducted a controlled usability test, and evaluated how well two groups of future users, OT’s and PD’s, interacted with the prototype. C. Paper Objectives This paper will deal with the following: • possibilities for realizing a planning tool in the context of environmental adaptations; • the relevance of and attitude towards the planning tool as well as its efficiency and learnability; • plans of action for further prototyping. The paper consists of the following three parts: 1) Identification of features to be implemented; 2) software implementation; 3) usability test and evaluation based on representatives of future users.
Software design is nowadays often considered as an iterative prototyping process, i.e., a software prototype evolves through repeated stages of development and evaluation [29], [30]. Therefore, the findings from the usability test presented here will provide the basis for further development. II. IDENTIFICATION OF FEATURES TO BE IMPLEMENTED Based on the observations and experiences from the case studies [26], a list of features assumed to be the most frequently used, and thus would be the primary implementation candidates, were identified. These features were: Change viewpoint and perspective; Move objects; Manipulate segments (e.g., opening doors, altering body postures); Change an object's width, height, and depth; Import objects from the library; Use background grids; Use ruler object; and Prepare material for presentations. Three OT’s from the Orup Rehabilitation Centre, Sweden, who had previously participated in the case studies, possessed first-hand experiences with the previous system. A tape-recorded group interview with the OT’s was performed in November 1994. They were asked how frequently they had used each feature in the list, and how difficult they felt it was. The interviewer registered their consensus opinions regarding each feature. They were also asked whether they could think of any other feature, not covered by the list, or whether something in the previous system had been missing. A. Interview Answers The consensus of the OT’s opinions about frequency and simplicity are found in Table I. “Move objects” and “change viewpoint and perspective” were performed most frequently. The OT’s reported some difficulties regarding deficient control of what came into view after changing the viewpoint, and some unexpected behavior when attempting to move certain objects (see comments under Table I). “Prepare material for presentations” and “use ruler object” were performed frequently and were found to be generally easy to do. Regarding “use ruler object”, they preferred a tool that could stretch and measure the distance between two arbitrary points, instead of importing a rigid 3-D object to be used as a measuring-stick. “Import objects from the library” was also frequently performed but was rated difficult to use due to the many steps necessary to complete it, and the appearance of imported objects at an arbitrary altitude. The features “manipulate segments” (e.g., opening doors, altering body postures), “change an object's size”, and especially “use background grids” were used rarely and were rated as difficult. Especially regarding “manipulate segments”, the high degree of difficulty caused this to be used less frequently. The OT’s could not report having used any additional features, not covered by the list, which seemed to confirm that the list covered those features most frequently used in planning tasks. New features desired by the OT’s were also discussed. One item was that imported objects should be automatically placed on the “ground”, and objects should remain at the ground level when moving them around. One OT mentioned the word gravitation in describing such a behavior. Another item was collision detection, meaning that moving objects should automatically
ERIKSSON et al.: PROTOTYPE FOR PARTICIPATORY PLANNING OF ENVIRONMENTAL ADAPTATIONS
97
TABLE I THREE OT’S OPINIONS ABOUT FEATURE FREQUENCY AND SIMPLICITY PERFORMED WITH THE FORMER PROTOTYPE
detect and indicate a collision with another object, thus keeping objects from intersecting. We discussed possible drawbacks from implementing such features: the interaction would be slower, and possibly becoming an undesirable hindrance. Such features should be completely automated and the user should be able to turn it on or off. Finally, we also discussed how to improve the directness and simplicity of changing viewpoints. This had been limited in the older prototype because of the long wait in rendering, and also because many operations could only be controlled by numeric input. Furthermore, the metaphor for changing a viewpoint could be described as “moving the world,” i.e., the viewing frustum remains in a fixed position while the world is translated, rotated or re-sized. An alternative metaphor would be “moving cameras,” i.e., the world remains in a fixed position and size while the view is directed through a certain type of object in the world: a camera. The OT’s were asked about which metaphor they would prefer, but as the OT’s had no experience with the latter metaphor, they did not want to give an opinion. III. SOFTWARE IMPLEMENTATION The implementation of the prototype aimed, first of all at ensuring real-time interactivity with a 3-D-modeled environment: A user's viewpoint should be controlled incrementally, thus providing the means for walkthroughs [31]. Furthermore, common operations on 3-D-objects should be controlled by direct manipulation techniques [32] (e.g., moving an object would be performed by dragging it around with the mouse). In order to deliver interactive 3-D-graphics, the prototype utilises the API QuickDraw 3-D, developed by Apple Computer, Inc. [33]. QuickDraw 3-D (QD3-D) also provides a platform independent file format that can store not only its standard objects and attributes but also custom defined ones.
The target platform for this version of the prototype was Macintosh systems. In order to simplify future platform migrations, the software was divided into two major parts: the interface and the database. The interface contained the classes that handled the user interface (e.g., windows, icons, and keyboard/mouse actions), file handling, and rendering. The database was intended to be platform independent, and contained classes that handled the 3-D data-structure. A. Implemented Features The following features were implemented in the prototype. • Change viewpoint and perspective. In order to support multiple cameras and views, the “camera” metaphor was employed. The cameras retained its position, orientation, field of view, type of perspective (normal perspective or orthographic). Camera motion was controlled by the keyboard's arrow keys. • Move objects. The horizontal and vertical translation of an object could be performed either by direct manipulation or by numeric input. However, object rotation could only be controlled by the “ ” and “ ” keys. Any of an object's six degrees-of-freedom could be locked, thereby inhibiting movement/rotation in that direction. Objects could also be linked together, for instance when a computer is to be placed on a table, and when moving that table, the computer moves along with it. • Manipulate segments (e.g., opening doors, altering body postures). Parts of an object, were named segments, and separate manipulation tools were implemented for their translation and rotation. As for whole objects, any of a segment's six degrees-of-freedom could be locked, and a range constraint could also be defined by setting a minimum and maximum value.
98
IEEE TRANSACTIONS ON REHABILITATION ENGINEERING, VOL. 8, NO. 1, MARCH 2000
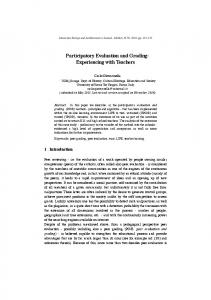
Fig. 1. The interface of the prototype. Two windows show the world viewed through two different cameras. A selected object (in this case, the computer on the table) is indicated with a red bounding box. To the upper left, the toolbar contains buttons for selecting, moving, rotating, linking, and un-linking objects; moving and rotating segments; measuring distances; and taking photos. Below to the right, the “Object Information” window supports editing of an object's name, size, position, rotation, degrees-of-freedom, etc. To the upper right, the “Library” window supports browsing for, and importing new objects into the world. The window shows a preview image and text information of an object (if present), and a file/folder browser.
• Change an object's width, height, and depth. This was supported with numeric input alone, and with no direct manipulation tool. • Import objects from a library. An object library window can be opened in order to rationalise searching for objects and adding them to a world. In the window, one can browse through the folders and files of the object library with the help of preview images and additional text information. • Use ruler object. A metric distance between two arbitrary points is carried out with a direct manipulation tool: after the first point is selected, a “measuring-tape” is dragged by the mouse to the second point. • Prepare material for presentations. A tool was implemented for “taking photos”, i.e., storing the currently visible image on a file. Such images could later be used for printouts, pictures in documents, etc. Fig. 1 illustrates the interface: Two windows show the world through two different cameras. The toolbar contains buttons
for selecting, moving, rotating, linking, and unlinking objects; moving and rotating segments; measuring distances; and taking photos. The “Object Information” window supports editing of an object's name, size, position, rotation, degrees-of-freedom, etc. The “Library” window supports browsing for and importing new objects into the world. The window consists of fields for a selected object's preview image, text information about the object, and a file browser. B. System Performance The frame-rate (i.e., the rate at which the system can render to a window) is an important factor for the interactivity with the program, since a low frame-rate causes manipulations to be jerky, and the sense of presence becomes impaired [34]. The prototype ran on a Power Macintosh 9500 with 48 MB of RAM, and equipped with a 3-D accelerator card. A test scene, which was considered to represent a basic level of complexity, contained one office-room with three windows and one door, a man in a wheelchair, a table,
ERIKSSON et al.: PROTOTYPE FOR PARTICIPATORY PLANNING OF ENVIRONMENTAL ADAPTATIONS
a computer, two shelves, and one chair for visitors. The registered frame-rate was at minimum 12 fps. With the accelerator card removed, the frame-rate dropped to 4–5 fps. To achieve an acceptable frame-rate, it was evident that dedicated hardware for 3-D acceleration must be present. However, the frame-rate is far from dependent on system hardware alone. The number of objects put into a world also significantly affects the frame-rate. It is therefore important that providers of object libraries offer objects with an appropriate balance between realism and complexity. The use of textures, for instance, can make an object look very realistic, and can enhance the perception of depth [35]. This is especially useful on large and otherwise plain objects such as walls and floors. However, since a large number of textures puts great demand on the hosting system, a future object library may have to supply objects in multiple versions of complexity. IV. USABILITY TEST AND EVALUATION A usability test was designed and performed in order to test and evaluate the prototype, and to identify usability problems. The test subjects represented future users of the prototype. Emphasis was laid on evaluating how well the subjects succeeded in using the fundamental operations of the prototype. In the test, the subjects had to perform a number of tasks which were intended to be realistic, i.e., reflecting common tasks performed with the program on the jobs or in the home, according to recommendations in Lewis and Rieman [36]. Löwgren [37] defines the usability of a system as the result of its Relevance, Efficiency, Attitude and Learnability (the REAL approach). The “Relevance” of and “Attitude” towards a system are defined as how well the system serves the users' needs, and as the users' subjective general feelings about the type of system, respectively. “Efficiency” reflects how efficiently users can carry out specified tasks using the system. Finally, “Learnability” describes how easy the system is to learn initially and whether it is easy to remember how to use it over time. An interface that is easy to remember is an important quality for users who use a system intermittently. Users who have used a system before do not need to learn it from scratch, but rather just need to remember how to use it based on their previous learning. Interface memorability can be tested by conducting a user test with users who have been away from the system for a specified amount of time [38]. In our case, the intended users of the prototype will tend to use it intermittently. Therefore, the individual test subjects in the study returned for retesting three weeks after a first session, in order to obtain an indication of how well they remembered the system. While the prototype's “Relevance” and “Attitude” have been investigated earlier in the project through six case studies, additional information about this was obtained in the usability study which includes an interview of the test subjects. The emphasis in this test concerned the prototype's “Efficiency” and “Learnability”. A. Method 1) Selection of Test Subjects: The prototype was evaluated with two groups of possible future users. The first test group,
99
five OT students near the end of their education (OT group), was selected based on questionnaire information about computer (relatively limited) and 3-D (limited) experience (see Table II for more information about test subjects). The second test group consisted of four persons with disability (PD group) who all had major physical impairments, and had had their home environment adapted because of this. When choosing the PD group, the same criteria regarding computer and 3-D experience were used as for the OT group. The PD group was also selected so as to have no visual or cognitive impairments, and to be able to move their arms and hands efficiently (i.e., be able to handle a computer mouse and keyboard). None of the subjects had any prior knowledge or experience with this research project. In order to get some indication about a highest possible level of performance, an expert who was one of the developers of the prototype performed the same usability test as the test subjects. 2) Procedure of the Usability Test: The usability test of the prototype included two test sessions for each single subject. Session I, which had a duration of approximately two hours, started with a 45-min standardized introduction of the program, given by the tester. The purpose for this introduction was first to give the subject a chance to learn how to use the program, and secondly to ensure that all subjects had the same level of exposure to the program before they began solving the tasks presented in the test. During the introduction, the subject was allowed to ask questions and was encouraged to perform and repeat program operations. After a short break, the subject used the program to carry out 12 specific tasks. Test session II was a follow-up test three weeks later (without an introduction), to test the subject's recollection concerning the program. In this session, which had a duration of approximately one hour, nine specific tasks were given. After completion, the subjects were interviewed regarding experiences and opinions about overall ease of use, satisfaction with the various tools and features, functions they had missed, specific problems they had experienced, interest in using it in the future, etc. During the two test sessions the subject had a quick reference card at hand, describing the prototype's toolbuttons and the keypresses used in the program. The subject also had an architectural plan of the simulated environment in front of him/her, which would serve as an aid, for example in walkthrough tasks. All subjects were asked to perform the tasks at their usual working pace. In order to rehearse all the steps in the usability test, two pilot tests were conducted with persons without any knowledge about the prototype, a procedure suggested by Dumas and Redish [39]. Especially the instructions given in the standardized introduction were checked to be sufficiently clear. 3) Purpose and Design of the Tasks: The different tasks given in the two test sessions had the purpose of testing the following specific operations in the prototype: moving an object horizontally; rotating an object horizontally; rotating segments (i.e., a part of an object); using the ruler object (i.e., measuring distances); taking pictures; deleting an object; importing objects from the object library; and changing viewpoint and perspective by moving the camera (e.g., walkthrough tasks). The final task in test session I was a “Think aloud” task, where the subject was asked to think aloud, while designing a bath-
100
IEEE TRANSACTIONS ON REHABILITATION ENGINEERING, VOL. 8, NO. 1, MARCH 2000
room for a person with disability. This allowed us to understand the subject's opinions, expectations and thought process when performing the task. The nine tasks in session II were different from those in the first session, but had corresponding context as in first session tasks. The purpose was to test the subjects' recollection of the program. 4) Performance Observation and Measures: The subject's performance was directly observed and video-/audio-recorded during the two test sessions. A camera and microphone were mounted on the ceiling in the test room, and the camera was zoomed in on the subject's actions with the keyboard and mouse. This video-signal was mixed together with the signal from the computer screen. A tripod-mounted camera was placed on the front left side of the subject and recorded the subject's facial expressions during the test sessions. The information thus gathered was evaluated according to the following standardized performance measures, based on measures suggested by Dumas and Redish [39]: • Success rate. The success rate (i.e., number of completed tasks per subject). Failure meant not completing a task or not completing it correctly. The success rates were presented as an average for each test group. • Usage and error patterns. By observing the subjects' usage of the program, we looked for specific error patterns (e.g., incorrect toolbutton choices), and whether the program functioned as the subjects expected it to function. • Task time. Time for each correctly completed task. The time from when the subject started working on a task after reading the task instruction, until he/she indicated aloud that the task was completed. To get a baseline from which to judge the times that subjects took to complete a task, we timed the expert when performing the same tasks. As was also the case for the test subjects, the expert was asked to perform the tasks at his usual working pace. • Error time. The amount of the task time the subject spent in errors. An error was defined as performing an act which does not belong to the task (at that stage), e.g., wrong key presses, choice of wrong tool, entry in wrong menu or opening wrong folder in the object library. This measure was expressed both as absolute error time and as percentage of total task time. • Number of times using quick reference card. The number of times the subject looked at the card, regardless of the duration of that usage. • Recollection of program operations. In order to see how easy it was to remember the program over time, the subjects performed a second test session three weeks after the initial one, with no exposure to the program in the meantime. We were thus able to compare their performance with that in session I on the above observations. B. Results of the Usability Test It should be stressed that although the results from the OT and PD groups are presented separately, it is not our intention to draw any general conclusions about differences in performance between these two groups. The subjects' performance
was studied in detail in order to provide a basis for further improvement and draw conclusions about the program's usability. 1) Success Rate: The average success rate in session I for the OT group was 97%, and in session II 96%. Hence, the average success rate for the OT group in both sessions was 96%. The average success rate in session I for the PD group was 81%, and in session II 78%. Regarding both sessions, the PD group's average success rate was 80%. The number of failed tasks for each individual test subject is given in Table II. 2) Error Patterns and Difficulties: When completing the tasks, a number of errors and difficulties occurred for the subjects in the two test groups. In both groups, subjects had difficulties in finding the correct rotation tools when trying to rotate an entire object and a segment, respectively. When doing this, they often mistakenly rotated the camera and especially in the second session. One subject in the OT group was at times unaware of the possibility of moving the camera and therefore failed two tasks. Another subject in this group had problems in taking photos (both sessions), first choosing the Photo tool in the toolbar and thereafter the Take a picture option in the File menu, thus doing the same operation twice. Two PD subjects had problems with the use of double-clicks when opening the various folders in the program's object library. This problem had diminished in the second session. Three of the four PD subjects had an initial problem in distinguishing a table (imported from the library) from the floor, this due to similar coloring of the table and floor. This problem occurred when the camera viewed the simulated environment from above. It should be noted again that none of the subjects in the PD group had any physical problems with their hands, arms or eyes. One subject in the PD group was reluctant to move the camera and therefore failed one task. Another PD subject had repeated problems in remembering the use of the key presses when rotating an object. This was partly due to the way those two key presses are placed on the key board, which the subject found uncomfortable to use. The subject wanted the two key presses for rotating an object to be placed next to each other. Yet another subject in the PD group frequently tried to rotate objects by using the mouse (which is not possible with the program). 3) Usage Patterns: Strategies Used When Performing Walkthrough Tasks and “Think Aloud” Task: Tasks involving moving the camera to a new perspective and the “Think aloud” task, had the purpose of discovering the strategies the subjects used when solving these tasks. One of the tasks in the first session was to get the same visual perspective as a man sitting in a wheelchair. A majority of the OT subjects solved this task by lowering the camera from its initially high level and thereafter moving it as if they were walking around in the apartment. They placed themselves behind the man, and moved the camera back and forth through his head, in order to get the same perspective as the man's eyes. A majority of the PD subjects remained at the initial high camera level, and placed the camera over the man. Thereafter they lowered the camera, and tried to tilt it up to get the same perspective as the man. This failed because they could not find the correct key presses for tilting the camera.
ERIKSSON et al.: PROTOTYPE FOR PARTICIPATORY PLANNING OF ENVIRONMENTAL ADAPTATIONS
101
TABLE II INDIVIDUAL OT AND PD TEST SUBJECTS' CHARACTERISTICS AND PERFORMANCES IN SESSION I AND II (SESSION TIME AND ERROR TIME IN MINUTES)
TABLE III TIME INCREASE FACTOR FOR THE TWO TEST GROUPS BETWEEN SESSION I TO SESSION II. (n NUMBER OF COMPARISONS THAT COULD BE CALCULATED)
=
In the walkthrough tasks, the majority of the subjects in both test groups walked through the rooms as human beings would, i.e., taking shortcuts through walls (which is possible with the program) was unintentional and accidental. Furthermore, they very seldom lost orientation within the environment. In the “Think aloud” task (designing a bathroom for a person with disability), both the OT and PD group focused on describing the needs of the person with disability instead of describing how they were handling the program. More than half of the OT subjects moved the camera to get a better view when
placing equipment and measuring distances. They used the measuring tool frequently. In contrast, the PD subjects never moved the camera or used the measuring tool. A great majority of the subjects in the two groups placed the man in wheelchair and his assistant in the bathroom in order to see whether there was enough space for them. When doing this, they found it desirable (especially OT’s) to be able to steer the wheelchair in a more efficient manner without having to switch between the mouse and the ± keyboard presses as is the case at present. 4) Task Time in Session I and II: In order to compare subjects' performance across the two sessions, a time increase factor (i.e., session II task time/session I task time), was calculated for the nine tasks which had corresponding contents in session I and session II (Table III). As shown in Table III, the subjects in both test groups took a longer time to complete all types of tasks in session II than in session I. From the results presented in Table III, it was found that the average increase in time across all tasks was 2.1 times longer for OT’s and 2.6 times longer for PD’s in session II compared to session I. The expert completed the tasks in the first session about 2.3 times as quickly as the OT subjects, and about 4.2 times as quickly as the PD subjects. In the second session, he completed the tasks about 4.4 times and 7.4 times as quickly, respectively. The expert completed almost all tasks in both sessions, in a time of less than 0.75 min per task. The mean session I task time for tasks which had a similar content in session I and session II was 0.9 min for OT’s and 1.8 min for PD’s. Their mean task times in session II were 1.5 min and 2.4 min, respectively. The total session time for each individual is given in Table II.
102
IEEE TRANSACTIONS ON REHABILITATION ENGINEERING, VOL. 8, NO. 1, MARCH 2000
USE
OF
TABLE IV QUICK REFERENCE CARD, MEAN TASK TIME, NUMBER OF PERSONS COMPLETING AND PERCENTAGE ERROR TIME PER TASK, IN SESSION I AND II
5) Error Time in Session I and II: The walkthrough tasks and the Think aloud task were of a nature where error time measurements were less relevant. For both test groups, mean percentage error times (i.e., the time spent in errors relative to the total task time) were notably higher in session II than in session I, as shown in Table IV. In the OT group, the mean percentage error time was 14% in session I and 26% in session II. In the PD group, the mean percentage error times in the two sessions were 30% and 39%, respectively. In session I the percentage error times for the OT group and the PD group were notably high in Task I.2 Rotating a rug (36% and 59%, respectively) and in Task I.10 Opening a door (56% and
THE
TASK,
63%, respectively). Additionally, Task I.11 (Finding object out of view) seems to have given the PD group difficulties as noted in high error time (52%). On some of the tasks in session II, the longer mean error time (compared to session I) in the total OT group was due to problems for one of the subjects, while on other tasks, for example Task II.1, Rotating a computer, most of the subjects in the OT group evidenced problems. In session II, the two test groups had problems with the same tasks, although the percentage error times were always greater in the PD group (Table IV). The total error time for each individual is given in Table II.
ERIKSSON et al.: PROTOTYPE FOR PARTICIPATORY PLANNING OF ENVIRONMENTAL ADAPTATIONS
6) Number of Times Using Quick Reference Card: The OT subjects consulted the quick reference card much more frequently in session II than in session I (Table IV). In contrast, two PD subjects read through the reference card and located the relevant key presses on the keyboard before they began solving the session II tasks. One of these two also consulted the reference card during the two sessions. That subject used the card more frequently in session I than in session II. 7) Results from the Interviews: From the interviews it was found that all test subjects thought the program was feasible and interesting for use in their future work (OT’s), and they were generally enthusiastic about the program in total. All subjects thought they had been well received in the usability test, and that it had been interesting to be a test subject. However, two of the nine subjects reported they had felt stressed due to their desire to perform well. The subjects had a number of suggestions for improvements and additions: • steering objects (e.g., the wheelchair) without having to switch between the Horizontal move and Horizontal rotation tools; • visual indicator that gives information about how the camera is tilted; • collision detection, to indicate when two objects intersect (e.g., man in wheelchair hitting wall), but it should be able to be turned off when so desired; • be able to undo a consecutive number of actions, not just the last action; • distance measures visible in the viewer-window, placed on and between objects; • be able to measure areas and circumferences; • improve visibility of the measuring tool. V. DISCUSSION Relevance and Attitude: The interviews after the second session, explored the OT students' and the PD’s opinions concerning the relevance of the program, and their attitudes towards using it. All subjects in both groups were very positive towards the program, and were enthusiastic about using it in their future work, or from the PD’s point of view, a very welcome opportunity to on their own plan and make alterations in their home environment, and present their own ideas. These results confirm previous findings made in case studies earlier in the project. Efficiency: The OT subjects managed to correctly solve almost all of the tasks presented to them in the test, which must be considered very satisfactory given the subjects' previous level of computer experience, and given the limited learning time of the program (45 min of introduction). This also describes the PD group, which had a success rate of about 80%. As compared to the expert user, the OT’s took more than twice as long to complete the tasks in the first session, and almost five times as long as the expert in the second session. The PD’s took more than four times as long as the expert in the first session, and almost eight times as long in the second. With these results in mind, we believe that the amount of time the OT subjects spent on the tasks would be quite satisfactory when using this program in a real work situation. The PD’s solved the tasks at slower pace
103
than both the expert and the OT group, but we believe that such a time-factor is not as important for this group as their use of the program would be more limited. The subjects’ performance on the “Think aloud” task represented good evidence of the program’s efficiency, in that the subjects were found to focus on describing the needs of the person with disability rather than describing how they were using the program. Learnability: The learnability of the program can be divided into two areas, i.e., how easy the program is to learn initially, and whether it is easy to remember how to use it over time. In the first session the number of incorrect toolbutton choices was notably higher on the initial tasks, but subsequent tasks including the same tool had low percentage error times. This suggests that the subjects had learned to use that tool efficiently. This could be one sign of how easy the program is to learn initially. The three-week pause caused slower performance times, increased percentage error time, and increased use of the quick reference card. Given the general similarity of tasks in session I and II, this seems as a sign of forgetting how to use the program. A majority of the subjects showed great difficulty in remembering how to use the program in the very beginning of the second session. A quick reference card or an on-line guide could provide good help when not having used the program for a period of time. A. Design of the Usability Test According to Virzi [40], a group of four or five subjects would be sufficient to reveal 80% of the usability problems. This supports the conclusion that the number of subjects in each test group in this test would be sufficient. However, when drawing conclusions from the performed test, one should be aware of that only two categories of prospective users (PD’s and OT’s) were included in this test. The OT group was generally younger than practicing OT’s, but nevertheless represents future potential users within this occupational category. As it is a serious limitation that only PD’s and OT’s were included in this test, it would be beneficial to conduct additional studies with other categories included as well, for instance architects and construction engineers. It is assumed, though, that these users would be more experienced in using computers (and also perhaps in using CAD applications). Thus, factors such as learnability would perhaps be less critical for these people. The fragmented tasks and the test situation itself are of course different from the program's natural usage. Although most of the tasks were kept small in order to better quantify the performance, a few more “realistic” tasks were also included, such as furnishing a kitchen and especially the “Think aloud” task of equipping a bathroom for a person in wheelchair. The tasks in session I and II were designed to test similar operations but they were not identical. Therefore, it may have been more appropriate to let half of the subject groups start with the tasks in session II instead, in order to avoid biased results of memorability. We believe however that influence from these biases should be very small. Question may be raised as to whether the artificial test situation, with videofilming, presence of the tester, stress to perform well, etc., can have influenced the subjects' performance in a negative or positive manner. No answer can be made with certainty, but efforts were made to put the subjects at ease and make
104
IEEE TRANSACTIONS ON REHABILITATION ENGINEERING, VOL. 8, NO. 1, MARCH 2000
the test as nonstressful as possible. Still, two of the nine subjects reported they had experienced some stress to perform well. B. Suggestions for Improvements The observations and interview answers concerning common usability problems yield suggestions for improvements in future prototype versions: • The subjects reported difficulties in controlling the camera and assessing how the camera was oriented. There seems to be a need for a graphic interface, that visualizes current position, orientation, tilt angle, altitude, etc., thus supplementing the keyboard keys. • A common difficulty was choosing the correct direction when to rotate an object or a segment. One improvement may be to redesign the symbols on the tool-buttons to be easier to understand (perhaps in combination with a text message). It may also be beneficial to project the current axis-of-rotation on the object to be rotated, thus giving the user a visual hint as to how the object will rotate before executing the operation. A different approach, common in other 3-D software, would be to display a “widget” around the object to be rotated, i.e., a 3-D help object with handles for each direction of rotation. When mouse-dragging on such a handle, the object rotates in a corresponding way. • After the three weeks, most subjects found it difficult to remember using the keys when rotating an object. Instead, they often mistakenly used the arrow keys which affect the camera. To avoid such a mix-up, the rotation-tools should support direct manipulation, i.e., mouse-dragging directly controls the angle of rotation. The need for remembering which keys to use would be eliminated if the camera could be controlled by graphical buttons, in the above suggested camera control panel. • Imported objects sometimes appeared out of view, or became occluded by a nearer object. Hence, there was no visual indication that the object had been properly imported. One solution could be an indicator that points towards the imported object. • Regarding the measuring tool, its visibility need to be improved. • Acollisiondetectionfeaturewasdesiredinordertoavoidintersection of objects, and to avoid cameras passing through walls. This was desired from both the OT’s in the previous case studies, as well as the subjects in this usability test. • For exact positioning of objects (for instance construction modules such as walls, windows and doors) a “snap-to” function would be useful, either in positioning to a nearest metric value (e.g., to nearest centimeters or inches), or an automatic alignment to a neighboring object. • The subjects wanted a special function that would allow the wheelchair (or similar object) to be driven more naturally. There should perhaps be separate controls for such operations: e.g., a 3-D mouse, a joy-stick, or the numeric keys to the right of the keyboard. • Although the subjects answered that the quick reference card provided sufficient help and that an on-line help would be unnecessary, we believe that the quick reference
card should be as redundant as possible during normal use, and instead, those parts in the interface that caused the most frequent consultations of the reference card should be improved. • An on-line help could be implemented as a series of htmldocuments (i.e., web-pages), thereby ensuring compatibility and familiarity when reading and navigating through these documents. • An undo-function is desired, that would give the possibility to undo several previous actions, not just the last action. • More object properties should be editable, such as surface material, color, pivot-offset, mass, centre of mass, etc. • To improve effectiveness when building rooms, it should be made possible to photoscan paper drawings, and then apply them as textures on the floor. With the support of visual landmarks, it would then be easier to place out construction modules. In the case when a drawing already exists in a digital format, it would of course be feasible with automated conversion and extrusion into 3-D geometries. We believe, however, that this would require some professional skills, and this can perhaps be better supported on existing, advanced 3-D modeling packages. Although the design of this usability test has been found to provide important information at this initial prototyping stage, it would be desirable that future usability tests give a more holistic view of the usability virtues/problems and involve a wider range of prospective users (e.g., architects, engineers, relatives, homeservice personnel, etc.). If continuing with the controlled experiment approach, the tasks should perhaps be more extensive (as in the “think aloud” task of this study). Furthermore, it should be important to observe situations where two or more people work together with the program, for example, in order to evaluate the communicative aspects. Such a case study approach could be employed, in order to evaluate the program under entirely realistic conditions. A long-term objective may also be to release a future version as a freeware on the Internet, providing a wider audience with the possibility of testing, and giving feed-back about the program. So far, the scope has mainly concerned barrier-free environments for various forms of physical impairments. In the future, it should be interesting to investigate possible usage in other areas, such as for visual impairments. In this case, light planning and coloring of walls, floors and furniture, may be critical factors, for instance. After the version described in this paper was finished, the decision was made to transform the code to the Windows 95/NT platform. There currently exists a prototype version for Windows 95/NT where the 3-D graphics are supported through Direct3D (Microsoft Corp.). VI. CONCLUSION • The implementation of this prototype indicates that it is possible to realise a planning tool for environmental adaptations, both regarding usability and technical efficiency. • The usability evaluation with representatives of future users confirms our findings from the case studies, regarding the
ERIKSSON et al.: PROTOTYPE FOR PARTICIPATORY PLANNING OF ENVIRONMENTAL ADAPTATIONS
relevance and positive attitude towards this kind of planning tool. • The prototype was found to be satisfactorily efficient for the basic tasks completed by two prospective user groups. • A list of suggestions for improvements in future versions have been forwarded.
ACKNOWLEDGMENT This prototype was programmed by R. Olsson, M. Nilsson, M. Löfstrand, M. Vågbäck, and J. Eriksson. The authors would like to thank Prof. R. Akselsson and M. Haake for valuable ideas and feedback.
REFERENCES [1] Participatory Ergonomics, Handbook of Human Factors, G. Salvendy, Ed., Wiley, New York, 1997, pp. 490–513. [2] A. S. Imada, “The rationale and tools of participatory ergonomics,” in Participatory Ergonomics, K. Noro and A. S. Imada, Eds. London, U.K.: Taylor and Francis, 1991, pp. 30–49. [3] P. Shipley, “Participation ideology and methodology in ergonomics practice,” in Evaluation of Human Work, J. R. Wilson and E. N. Corlett, Eds. London, U.K.: Taylor and Francis, 1990, pp. 819–834. [4] K. R. Akselsson, P. Bengtsson, C. R. Johansson, and J. af Klercker, “Computer aided participatory planning,” in Proc. Ergonomics of Hybrid Automated Systems II. Amsterdam, The Netherlands, 1990, pp. 69–76. [5] D. Ellek, “The Americans with disabilities act of 1990,” Amer. J.Occupational Ther., vol. 45, no. 2, pp. 177–179, 1991. [6] S. Goldsmith, Designing for the Disabled. London, U.K.: RIBA, 1976. [7] R. Lifchez, Rethinking Architecture—Design Students and Physically Disabled People. Berkeley, CA: Univ. California, 1987. [8] “Official position paper: Occupational therapy's role in independent or alternative living situations,” Amer. J. Occupational Therapy, vol. 35, no. 12, pp. 812–814, 1981. [9] “The role and functions of occupational therapy services for the severely disabled,” Am. J. of Occupational Therapy, vol. 37, no. 12, pp. 811–814, 1983. [10] E. D. Taira, “An occupational therapist's perspective on environmental adaptations for the disabled elderly,” Occupational Ther. Health Care, vol. 1, no. 4, pp. 25–33, 1984. [11] B. Acheson-Cooper, U. Cohen, and B. R. Hasselkus, “Barrier-free design: A review and critique of the occupational therapy perspective,” Amer. J. Occupational Ther., vol. 45, no. 4, pp. 344–350, 1991. [12] A. J. Ferrante, L. F. R. Moreira, J. M. B. Videla, and A. Montagu, Computer Graphics for Engineers and Architects. Amsterdam, The Netherlands: Elsevier, 1991. [13] J. M. Porter, K. Case, and M. C. Bonney, “Computer workspace modelling,” in Evaluation of Human Work, J. R. Wilson and E. N. Corlett, Eds. London, U.K.: Taylor and Francis, 1990, pp. 472–499. [14] M. Dooley, “Anthropometric modeling programs—A survey,” IEEE Comput. Graph. Appl., vol. 2, no. 9, pp. 17–25, 1982. [15] J. M. Porter and K. Case, “SAMMIE can cut out the prototypes in ergonomic design,” Control and Instrumentation, pp. 28–29, Jan. 1980. [16] M. R. Grosso, R. D. Quach, and N. I. Badler, “Anthropometry for computer animated human figures,” in State-of-the-Art in Computer Graphics, N. Magnenat-Thalmann and D. Thalmann, Eds. Berlin, Germany: Springer Verlag, 1989, pp. 83–96. [17] A. G. P. Brown and F. Horton, “Computer aids for design developmet,” in Computers in Architecture, F. Penz, Ed. London, U.K.: Longman and Harlow, 1992, pp. 15–24. [18] W. Barfield, T. Chang, A. Majchrzak, R. Eberts, and G. Salvendy, Technical and Human Aspects of Computer Aided Design (CAD), G. Salvendy, Ed. New York: Wiley, 1997, Handbook of Human Factors, pp. 1618–1656. [19] R. Brown and D. K. Wright, “The application of computer aided design and analysis for rehabilitation engineering,” in Computers for Handicapped Persons—Proc. 3rd Int. Conf., W. Zagler, Ed.. Vienna, Austria, 1992, pp. 570–574.
105
[20] D. R. Browning, C. Cruz-Neira, D. J. Sandin, and T. A. DeFanti, “CAVE automatic virtual environment: Projection-based virtual environments and disability,” in Proc. Virtual Reality Persons Disabilities, 1993. [21] O. Riedel, J. Eriksson, and A. Rössler, “Planning environments for disabled people in virtual worlds,” in Proc. 1st Eurograph. Workshop Virtual Reality, M. Goebel, Ed., 1993, pp. 17–20. [22] D. R. Browning and J. G. Edel, “Virtual reality and accessible transit design—New access methods project,” in Proc. Virtual Reality Persons Disabilities, 1995. [23] G. N. Schmitt, “Computer graphics in architecture,” in New Trends in Animation and Visualization, N. M. Thalmann and D. Thalmann, Eds. London, U.K.: Wiley, 1991, pp. 153–163. [24] J. Hare, “What do architects expect from computer-aided design?,” in Computers in Architecture, F. Penz, Ed. London, U.K.: Longman and Harlow, 1992, pp. 65–69. [25] J. D. Foley, A. Van Dam, S. K. Feiner, and J. F. Hughes, Computer Graphics: Principles and Practice. Reading, MA: Addison-Wesley, 1990. [26] J. Eriksson, G. I. Johansson, and K. R. Akselsson, “A planning tool prototype for environment adaptations,” IEEE Trans. Rehab. Eng., vol. 3, no. 3, pp. 283–287, 1995. [27] J. Eriksson and G. I. Johansson, “Adaptation of workplaces and homes for disabled people using computer aided design,” Int. J. Industr. Ergonom., vol. 17, no. 2, pp. 153–162, 1996. (Special Issue: “Rehabilitation Engineering”). [28] U. Flohr, “3-D for everyone,” BYTE, 1996. October issue. [29] J. D. Gould, “How to design usable systems,” in Readings in HumanComputer Interaction: Toward the Year 2000, R. M. Baecker, J. Grudin, W. A. Buxton, and S. Greenberg, Eds. San Francisco, CA: Morgan Kaufman, 1995, pp. 93–121. [30] A. Dix, J. Finlay, G. Abowd, and R. Beale, Human-Computer Interaction. New York: Prentice Hall, 1993. [31] R. S. Kalawsky, The Science of Virtual Reality and Virtual Environments. Reading, MA: Addison-Wesley, 1993. [32] J. E. Ziegler and K. P. Fähnrich, Direct Manipulation, M. Helander, Ed. Amsterdam, The Netherlands: Elsevier, 1988, Handbook of Human-Computer Interaction, pp. 123–133. [33] 3D Graphics Programming with QuickDraw 3D. Reading, MA: Addison-Wesley, 1995, Apple Computer Inc.. [34] R. Held and N. Durlach, “Telepresence, time delay and adaptation,” in Pictorial Communication in Virtual and Real Environments, S. R. Ellis, Ed. London, U.K.: Taylor and Francis, 1991. [35] J. T. Todd and R. A. Akerstrom, “Perception of three-dimensional form from patterns of optical texture,” J. Exper. Psychol.: Human Perception Perform., vol. 13, no. 2, pp. 242–255, 1987. [36] C. Lewis and J. Rieman, “Getting to know users and their tasks,” in Readings in Human-Computer Interaction: Toward the Year 2000, R. M. Baecker, J. Grudin, W. A. Buxton, and S. Greenberg, Eds. San Francisco, CA: Morgan Kaufman, 1995, pp. 122–127. [37] J. Löwgren, Human-Computer Interaction. What Every System Developer Should Know. Lund, Sweden: Studentlitteratur, 1993. [38] J. Nielsen, Usability Engineering. London, U.K.: Academic, 1993. [39] J. S. Dumas and J. C. Redish, A Practical Guide to Usability Testing. Norwood, N.J.: Ablex Publishing Corp., 1993. [40] R. Virzi, “Refining the test phase of usability evaluation: How many subjects is enough?,” Human Factors, vol. 34, pp. 457–468, 1992.
Joakim Eriksson received the M.Sc. degree in computer science and engineering from Lund Institute of Technology, Lund University, Lund, Sweden, in 1990 and the Ph.D. degree in ergonomics from the Department. of Design Sciences, Lund Institute of Technology, in 1998. Currently, he is a Visiting Postdoctoral Researcher with the Department of Production and Systems Engineering, University of Santa Catarina, Brazil. His current research interests include 3-D graphics, virtual reality, human–computer interaction, and digital human modeling.
106
IEEE TRANSACTIONS ON REHABILITATION ENGINEERING, VOL. 8, NO. 1, MARCH 2000
Åsa Ek received the M.Sc. degree in computer science and engineering from Lund Institute of Technology, Lund University, Lund, Sweden, in 1997. She is currently the Ph.D. degree candidate in ergonomics from the Department of Design Sciences, Lund Institute of Technology, Lund University. Her research area concerns human factors and risk, including human–machine interaction and safety culture in organizations.
Gerd Johansson received the M.Sc. and the Ph.D. in 1974 and 1981, respectively, from the Department of Physics at Lund Institute of Technology, Lund University, Lund, Sweden. She is currently a Lecturer and Researcher at the Department of Design Sciences, Lund Institute of Technology, Lund University. She is currently doing research on human–machine interaction, and on using virtual reality in rehabilitation for people with disabilities, especially for people with brain injuries.