International Journal of Engineering Research Volume No.4, Issue No.9, pp : 574-578
ISSN:2319-6890)(online), 2347-5013(print) 01 Sept. 2015
Design and Fabrication of a Spring Constant Testing Machine and Determination of Spring Constant of a Compression Spring Muhammad Abu Rahat1, Muhammad Ferdous Raiyan2, MD. Safayet Hossain3, J.U. Ahamed4, Nahed Hassan Jony5 Department of Mechanical Engineering, CUET, Chittagong, Bangladesh
[email protected],
[email protected],
[email protected],
[email protected],
[email protected] Abstract: The main objective of this project is to determine the stiffness which is commonly known as spring constant of a compression spring under various load. The kit which has been built into a machine to stretch or compress test springs, while measuring load and displacement is called spring testing kit. It tests springs and finds their properties – good for mechanical workshops use. It includes a set of different springs to compare spring rates and effect of different spring sizes. It has wide range and variety of experiments. Easy-to-use, compact instrument that fits on a small bench or desktop and as a spring force constant determination as a learning tool for graphing and modeling. Compression of a spring in a spring constant testing machine is an example of a loading that can be treated as a combination of a direct shear load and a torsional load. This project is just a prototype which can be improved for implementation in industrial work. Keywords: Spring testing kit, hook’s law, stiffness, shear stress, Wahl factor. I. INTRODUCTION Spring testing kit is an instrument that builds into a machine to stretch or compress test springs, while measuring load and displacement. The kit includes a spring for tensile tests and a different spring for compression tests. A spring is an elastic object used to store mechanical energy. Springs are usually made out of spring steel. Small springs can be wound from pre-hardened stock, while larger ones are made from annealed steel and hardened after fabrication. Some non-ferrous metals are also used including phosphor bronze and titanium for parts requiring corrosion resistance and beryllium copper for springs carrying electrical current (because of its low electrical resistance). When a spring is compressed or stretched, the force it exerts is proportional to its change in length. The rate or spring constant of a spring is the change in the force it exerts, divided by the change in deflection of the spring. That is, it is the gradient of the force versus deflection curve. An extension or compression spring has units of force divided by distance, for example 𝑙𝑏𝑓 ⁄𝑖𝑛 or 𝑁/𝑚. Torsion springs have units of force multiplied by distance divided by angle, such as 𝑁 · 𝑚⁄𝑟𝑎𝑑 or 𝑓𝑡 · 𝑙𝑏𝑓/𝑑𝑒𝑔𝑟𝑒𝑒.The inverse of spring rate is compliance that is: if a spring has a rate of 10 𝑁⁄𝑚𝑚, it has pliance of 0.1 𝑚𝑚⁄𝑁 .The stiffness (or rate) of springs in parallel is additive, as is the compliance of springs in series. Depending on the design and required operating environment, any material can be used to construct a spring, so long as the material has the required combination of rigidity and elasticity: technically, a wooden bow is a form of spring. IJER@2015
Compression of a helical spring is an example of a loading that can be treated as a combination of a direct shear load and a torsion load. The relationship between the load and deflection of the spring is referred to as the spring constant, with units of load per deflection. With load plotted along the Y-axis and deformation plotted along the X-axis, the spring constant is determined as the slope of the straight line. Various research works were done and also many experiments were conducted for the determination of spring constant. A method for determining the spring constant of cantilevers for atomic force microscopy was conducted by [1]. Experiment regarding effect of spring stiffness to check the suspension capability as shock absorber in a bus was carried out by [2]. There are springs with controllable stiffness and test was done on controllable stiffness by [3]. Design and manufacturing of hydraulic spring stiffness testing machine was done by [4]. Variable stiffness coil spring for vehicle was optimized, designed and calculated by [5]. Further researches were also conducted on the determination of spring constant. Determination of spring constant as a learning tool for graphing and modeling was done by [6]. A simplified dynamic model for constant force compression spring was developed by [7]. The spring constant testing kit which we developed in this experiment will be able to determine the value of stiffness for spring. Calibration of torsional spring constants was compared by different methods by using torsional photo detector. [8]. Research were performed for design, analysis and optimization of leaf spring where spring stiffness was also calculated [9]. Spring constant for helical spring was found by finite element method and abacus script [10]. II. MATERIAL AND METHODOLOGY At first assemble the spring tester on a task frame (MF, separately). The kit includes a spring for tensile tests and a different spring for compression tests. Then apply a compressive or tensile force to the spring by turning an adjustment screw. A load cell (available separately) shows the force applied to the spring. By moving freely with the load cell, scales behind the spring directly measure the spring extension or compression. From the value of load, displacement we can easily measure the spring constant using Hooke`s Law. A complete list of essential equipment is given below: A. Spring The test includes a compression spring. B. Frame High quality, specially made frames that provides a sturdy base to set up experiments. There are two frames. The larger upright frame Page 574
International Journal of Engineering Research Volume No.4, Issue No.9, pp : 574-578
ISSN:2319-6890)(online), 2347-5013(print) 01 Sept. 2015
comes with feet and clamps. The feet allow the frame to stand on a III. COMPLETE MODEL OF SPRING TESTING KIT workbench or table. After assembling the load cell, spring, scale and mini frame we will The mini frame shown in Fig.1 is for smaller and more compact get the complete model of spring testing kit. The complete model experiments. of spring testing kit is shown in Fig.3.
Fig.3 Spring Testing Kit IV. EXPERIMENT AND ANALYSIS If a weight, 𝑊 = 𝑚𝑔, is applied on an ordinary spring, causing it to stretch a distance x, then an equal and opposite force, F, is C. Load Cell (LC) Load cell Fig.2 is the method of choice for weighing applications. created in the spring which opposes the pull of the weight. If W is not so large as to permanently distort the spring, then this force, F, An easy-to read scale that measure force (load). will restore the spring to its original length after the load is removed. The magnitude of this restoring force is directly proportional to the stretch; this relationship for elastic behavior is known as Hooke's law and is described by 𝐹 = 𝑘𝑥 (𝑒𝑞. 1) Where k is the constant of proportionality called the spring constant. The spring’s restoring force acts in the opposite direction to its elongation, denoted by the negative sign. For a system such as the spring's compression, (𝑥 − 𝑥0 ), is dependent upon the spring constant, k, and the weight of a mass, mg, which compress the spring. If the system of forces is in equilibrium (i.e., it has no relative acceleration), then the sum of the forces down (the weight) is equal and opposite to the sum of the forces acting upward (the restoring force of the spring), or 𝑚𝑔 = 𝑘(𝑥 − 𝑥0 ) (𝑒𝑞. 2) Comparing equation 2 with the form for the equation of a straight line (𝑦 = 𝑚𝑥 + 𝑏), we can see that if we plot the force produced by different masses (mg) as a function of the displacement from equilibrium (𝑥 − 𝑥0 ), the data should be linear and the slope of the line will be equal to the spring constant, k, whose standard metric units are 𝑁/𝑚. The maximum stress in the wire may be computed by superposition of the shear stress is given by the equation 3. Fig.2 Load cell (𝑒𝑞. 3) 𝑇 = 8𝑊𝐷⁄(𝜋𝑑 3 × 𝐹) D. Scale By moving freely with the load cell, scale behind the spring directly Here, 𝑊 = (4𝐶 − 1)/(4𝐶 − 4) + 0.615/𝐶 is the Wahl factor of a compression spring. measures the spring extension or compression. Fig.1 Mini frame
IJER@2015
Page 575
International Journal of Engineering Research Volume No.4, Issue No.9, pp : 574-578
3. 4.
5.
V. PROCEDURE Firstly, place a spring on the angled plate bar. Attach a mass hanger directly to the bottom of the spring and record the position of the bottom of the mass relative to a meter stick. Add masses to the spring and record the position of the bottom of the mass hanger. A load cell shows the force applied to the spring. By moving freely with the load cell, scale behind spring directly measures the spring compression. And thus by getting the load and displacement we can measure spring constant of the compression spring. Repeat for other masses.
VI. DATA COLLECTION In this experiment we determine the spring constant of compression spring by using three springs. Here we use Hook’s law to determine the spring constant. We make three experiments and there is some error in every step.
4.6
Series1
Linear (Series1)
4.55
FORCE(KN)
1. 2.
ISSN:2319-6890)(online), 2347-5013(print) 01 Sept. 2015
4.5
4.45
4.4
4.35 0
0.05 0.1 DISPLACEMENT(M)
0.15
Fig. 4. Force vs. displacement for sample 1
Sample 1: 𝐿𝑓𝑟𝑒𝑒 = 8 𝑖𝑛; 𝐷 = 2.1 𝑖𝑛; 𝑑 = 5.4 𝑚𝑚; 𝐿𝑤𝑖𝑟𝑒 = 78.9 𝑖𝑛; 𝜌 = 7500 𝑘𝑔/𝑚3 ; 𝑀 = 0.344 𝑘𝑔; 𝐶 = 𝐷/𝑑 = 9.9
Sample 2: 𝐿𝑓𝑟𝑒𝑒 = 6 𝑖𝑛; 𝐷 = 1.7 𝑖𝑛; 𝑑 = 6.35 𝑚𝑚; 𝐿𝑤𝑖𝑟𝑒 = 48.9 𝑖𝑛; 𝜌 = 7500 𝑘𝑔/𝑚3 ; 𝑀 = 0.295 𝑘𝑔; 𝐶 = 𝐷/𝑑 = 6.8
Table 1: Experimental Data for sample 1
Table 2. Experimental data for sample 2
No of obs.
Mass (kg)
Force (N)
1. 2. 3. 4. 5.
25 30 35 40 45
245 294 343 392 441
Initial dis, X (m) 0.2032 0.2032 0.2032 0.2032 0.2032
Final dis, X0(m)
0.1473 0.1372 0.127 0.1168 0.1067
1. 2. 3. 4. 5.
Change of dis, (X-X0) (m) 0.05588 0.06604 0.07620 0.08636 0.09652
IJER@2015
Mass (kg)
Force(N)
1. 2. 3. 4. 5.
30 40 50 60 70
294 392 490 588 686
Initial dis, X (m) 0.1524 0.1524 0.1524 0.1524 0.1524
Final dis, X0(m) 0.1423 0.1397 0.1372 0.1346 0.1321
Table 2 (continued)
Table 1 (continued) No of obs.
No of obs.
Wahl Factor, W
Shear Stress, 𝜏(𝑀𝑃𝑎)
Spring constant, k (KN/m)
1.15 1.15 1.15 1.15 1.15
243.04 291.65 340.25 388.86 437.47
4.384 4.451 4.501 4.539 4.569
No of obs.
Wahl Factor, W
Shear Stress, 𝜏(𝑀𝑃𝑎)
1. 2. 3. 4.
Change Of dis, (X-X0) (m) 0.01016 0.01270 0.01524 0.01778
1.22 1.22 1.22 1.22
154.03 205.37 256.72 308.06
Spring constant, k (KN/m) 28.94 30.87 32.15 33.07
5.
0.02032
1.22
359.41
33.75
Page 576
International Journal of Engineering Research Volume No.4, Issue No.9, pp : 574-578 Series1
Linear (Series1)
Average Spring Constant, k = 22.4445 = 4.489 KN/m
35
FORCE(KN)
ISSN:2319-6890)(online), 2347-5013(print) 01 Sept. 2015
Error =
34 33
4.628−4.489 4.628
× 100 = 3%
From, Sample-2 and Table-2 Ideal condition, spring at rest
32 31
Spring constant, k =
30 29
8𝐷3 𝑛
Where, D = 0.04318 m; k =
28 0
0.005
0.01
0.015
0.02
0.025
DISPLACEMENT(M)
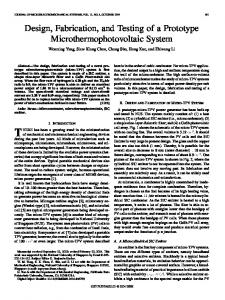
Fig.5 Force vs. displacement for sample 2 Sample 3: 𝐿𝑓𝑟𝑒𝑒 = 5.85 𝑖𝑛; 𝐷 = 1.7 𝑖𝑛; 𝑑 = 6.1 𝑚𝑚;
17
Series1
(0.0065)4 (79.3×10⁹ ) 8(0.04318)3 ×6
= 33.364 KN/m, n = 6 Actual condition, 1. Spring constant, k = 2940.01016 = 28.94 KN/m 2. Spring constant, k = 3920.01270 = 30.87 KN/m 3. Spring constant, k = 4900.01524 = 32.15 KN/m 4. Spring constant, k = 5880.01778 = 33.07 KN/m Average Spring Constant, k = 158.785 = 31.76 KN/m
𝑘𝑔
𝐿𝑤𝑖𝑟𝑒 = 66 𝑖𝑛; 𝜌 = 7500 3 ; 𝑀 = 0.367 𝑘𝑔; 𝑚 𝐶 = 𝐷/𝑑 = 7.08 Linear (Series1)
16.5
Error =
33.36−31.76 33.36
× 100 = 4.7%
From, Sample-3, Ideal condition, spring at rest Spring constant, k =
16
FORCE(KN)
𝑑4𝐺
𝑑4𝐺 8𝐷3 𝑛
Where, D = 0.04318 m, k =
15.5 15
(0.0065)4 (79.3×10⁹ ) 8(0.04318)3×6
= 15.49 KN/m, n = 11
14.5
Average Spring Constant, k = 76.445 = 15.29 KN/m
14
Error =
13.5 0
0.01
0.02
0.03
DISPLACEMENT(M)
Fig.6 Force vs. displacement for sample 3 VII. CALCULATION The calculation of the experiment is given below: From, Sample-1 and Table-1 Ideal condition, spring at rest Spring constant, 𝑘 =
𝑑4 𝐺 8𝐷3 𝑛
Where, D = 0.5334 m; 𝑘 =
(0.0054)4 (79.3×10⁹ ) 8(0.05334)3 (12)
= 4.628 KN/m, n = 12 Actual condition, 1. Spring constant, k = 2450.05588 = 4.384 KN/m 2. Spring constant, k = 2940.06604 = 4.451 KN/m 3. Spring constant, k = 3430.07620 = 4.501 KN/m 4. Spring constant, k = 3920.08636 = 4.539 KN/m 5. Spring constant, k = 4410.09652 = 4.569 KN/m IJER@2015
15.49−15.29 15.49
× 100 = 1.3%
VIII. RESULTS AND DISCUSSIONS At the beginning, assemble the spring tester on a task frame (MF, separately). The kit includes a spring for compression tests. Then apply a compressive force to the spring by turning an adjustment screw. A load cell (available separately) shows the force applied to the spring. By moving freely with the load cell, scales behind the spring directly measure the spring extension or compression. From the value of load, displacement we can easily measure the spring constant using Hook`s Law. We know Hook’s Law states that “as the extension so is the force”. IX. SUMMARY RESULTS The summary result of this experiment is given below. 1. Average Spring Constant, k = 4.489 KN/m Error = 3.0% 2. Average Spring Constant, k = 31.76 KN/m Error = 4.7% 3. Average Spring Constant, k = 15.29 KN/m Error = 1.3% Page 577
International Journal of Engineering Research Volume No.4, Issue No.9, pp : 574-578
ISSN:2319-6890)(online), 2347-5013(print) 01 Sept. 2015
X. DISCUSSIONS ON RESULTS In this experiment, we determine the spring constant of a compression spring using Hook’s Law. We took three springs of different sizes. But every steps some error occurred. For first spring error is 3%, for second spring error 4.7% and for third spring error 1.3%. The sources of error in this part of the experiment are due to the precision of the location measurement using the meter stick and the accuracy of the slotted masses. The meter stick was mounted vertically and behind the spring. By plotting the value of force and displacement on the graph a straight line is found. REFERENCES i. Akihiro Torii, Minoru Sasakir, Kazuhiro Hane and Shigeru Okuma, “A method for determining the spring constant of cantilevers for atomic force microscopy”, Measurement Science and Technology, Vol.7, No.2, 1995. ii. Dragan Sekulic, Vlastimir Dedovic, “The Effect of Stiffness and Damping of the Suspension System Elements on the Optimization of the Vibrational Behavior of a Bus”, International Journal of Traffic and Transport Engineering, Vol.1, No.4, pp 231-244, 2011. iii. Waldemar Razcka, “Testing of a spring with Controllable Stiffness”, MECHANICS, AGH University of Science and Technology, Vol.25, No.2, 2006. iv. Avdhut R. Jadhav, Gajendra J Pol and Amit A Desai, “Design and Manufacturing of a Hydraulic Spring Stiffness Testing Machine”, International Journal of Emerging Engineering Research and Technology, Vol.2, No.7, pp 184-190, 2014. v. Qu Xian and Zhao Shu-en,,“Optimization , Design and Calculation of the Variable Stiffness Coil Spring Applied to Vehicles” , International Journal of Science and Research, Vol.3, No.4, pp 25622565, 2014. vi. Newton, I. Galilei, G. and Einstein, “Spring Force Constant Determination as a Learning Tool for Graphing and Modeling”, NCSU Physics 205 Section 11, 2002. vii. Ikechukwu Celestine UGWUOKE, “A Simplified Dynamic Model for Constant-Force Compression Spring”, Leonardo Journal of Sciences, Issue.13, pp. 30-43, 2008. viii. Torbjorn Pettersen, Niklas Nordgren, Mark W. Rutland, Adam Feiler.”Comparison of different methods to calibrate torsional spring constant and photodetector for atomic force microscopy friction measurement in air and liquid”, American Institute of Physics. ix. Dhiraj K. Bhandarkar, Sanjay P. Shekhawat, “Design, Analysis and Optimization of Leaf Spring”, International Journal of Innovative Research in Science, Engineering and Technology”, Vol.3, Issue 6, 2014. x. Biswajit Banaerjee, Finding the Spring Constant of a Helical Spring”, January 2012, imeccanica.org/files/helical spring.
IJER@2015
Page 578