member of the team, for the coffee breaks, and for the good work environ- ment that there is in the ..... Respect to NLD features for the analysis of pathological speech; the work proposed by Patricia ...... android 4.x and linaro ubuntu 12.10 ...
Design and Implementation of a Portable Device for Real Time Analysis of Speech of People with Parkinson’s Disease Juan Camilo V´ asquez Correa
Department of Electronics and Telecommunications Engineering Facultad de Ingenier´ıa, Universidad de Antioquia UdeA; Calle 70 No. 52-21 Medell´ın, Colombia 2013
Design and Implementation of a Portable Device for Real Time Analysis of Speech of People with Parkinson’s Disease Juan Camilo V´ asquez Correa
Document in partial fulfillment of the requirements for the degree of: electronic engineering
Director: MSc. Juan Rafael Orozco Arroyave Advisors: Ph.D. Julian David Arias Londo˜ no Ph.D. Jesus Francisco Vargas Bonilla
Research topic: Digital Signal Processing Research Group: Grupo de Investigaci´on en Telecomunicaciones Aplicadas (GITA). Department of Electronics and Telecommunications Engineering Universidad de Antioquia UdeA; Calle 70 No. 52-21 Medell´ın, Colombia 2013
II
Acknowledgments First, I want to say thanks to my parents, for offer me an excellent education based on values; and for make me understand that by means of education, a better world can be constructed. I thank to the rest of my family including my sister, aunts, uncles, and cousins for their unconditional support during the development of this work. To my friends, who accompanied me during all the formation process to reach this degree, and give me their friendship and support when needed. To every one of the members of GITA research group, for accept me like a member of the team, for the coffee breaks, and for the good work environment that there is in the group. Specially, to every one of my three advisors, ”Rafa”, ”Julian”, and ”Pacho”, thanks for the accompaniment during all the development of this work, and for allow me to discover the amazing world of pattern recognition and digital signal processing. Finally, to Noel clinical center, Neurociencias group, and Fundalianza Parkinson Colombia for the support of this work.
III
IV
Contents 1 Introduction 1.1 Context . . . . . . . . . . . . . 1.2 Motivation . . . . . . . . . . . . 1.3 Hypothesis . . . . . . . . . . . . 1.4 Objectives . . . . . . . . . . . . 1.4.1 General objectives . . . 1.4.2 Specific objectives . . . . 1.5 Organization of the manuscript
. . . . . . .
1 2 2 3 4 4 4 4
2 State of the art 2.1 Speech analysis of people with Parkinson’s disease . . . . . . . 2.2 Implementation of devices for real time analysis of speech . . .
5 6 8
. . . . . . .
. . . . . . .
. . . . . . .
. . . . . . .
. . . . . . .
. . . . . . .
. . . . . . .
3 Feature estimation 3.1 Acoustical features . . . . . . . . . . . . . . 3.1.1 Fundamental frequency (pitch) . . . 3.1.2 Jitter . . . . . . . . . . . . . . . . . . 3.1.3 Shimmer . . . . . . . . . . . . . . . . 3.2 Articulation features . . . . . . . . . . . . . 3.2.1 Vocalic formants . . . . . . . . . . . 3.2.2 Vowel Space Area (VSA) . . . . . . . 3.2.3 Formant Centralization Ratio (FCR) 3.3 Non-Linear Dynamics features . . . . . . . . 3.3.1 Embedding . . . . . . . . . . . . . . 3.3.2 Correlation Dimension . . . . . . . . 3.3.3 Largest Lyapunov Exponent . . . . . V
. . . . . . .
. . . . . . . . . . . .
. . . . . . .
. . . . . . . . . . . .
. . . . . . .
. . . . . . . . . . . .
. . . . . . .
. . . . . . . . . . . .
. . . . . . .
. . . . . . . . . . . .
. . . . . . .
. . . . . . . . . . . .
. . . . . . .
. . . . . . . . . . . .
. . . . . . .
. . . . . . . . . . . .
. . . . . . .
. . . . . . . . . . . .
. . . . . . . . . . . .
11 12 12 12 13 13 13 14 15 15 16 18 20
VI
Contents
4 Platforms development and implementation 4.1 Graphical User Interface in Matlab . . . . . 4.1.1 Operation of the system . . . . . . . 4.1.2 Processing . . . . . . . . . . . . . . . 4.2 DSP TMS320C6713 Prototype . . . . . . . . 4.3 Device based on Odroid-U2 . . . . . . . . . 4.3.1 Features of the device . . . . . . . . 4.3.2 Operation of the system . . . . . . . 4.4 Praat analysis . . . . . . . . . . . . . . . . . 5 Results and discussion 5.1 Database . . . . . . . . . . 5.2 Tests and discusion . . . . 5.2.1 Differences between 5.2.2 Differences between
. . . . . . . .
. . . . . . . .
. . . . . . . .
. . . . . . . .
. . . . . . . .
. . . . . . . .
23 24 24 26 28 30 31 33 35
. . . . . . . . . . . . . . . . . . . . . . . . . . . . . . PD and HC speech . . . . devices and Praat analysis
. . . .
. . . .
. . . .
. . . .
. . . .
39 40 40 41 43
. . . . . . . .
. . . . . . . .
. . . . . . . .
. . . . . . . .
6 Conclusion 49 6.1 Conclusion . . . . . . . . . . . . . . . . . . . . . . . . . . . . . 50 Bibliography
53
List of Figures 3.1 3.2 3.3 3.4
Pitch estimation process . . . . . . . . . . . . . . . . . . LPC response . . . . . . . . . . . . . . . . . . . . . . . . A). Sinusoidal signal. B). Sinusoidal signal attractor . . . A). Vowel /a/ speech signal. B). Speech signal attractor
. . . .
. . . .
. . . .
13 14 18 19
4.1 4.2 4.3 4.4 4.5 4.6 4.7 4.8 4.9 4.10 4.11 4.12 4.13 4.14 4.15 4.16 4.17
Main window of Matlab Graphical User Interface . . . . . Window to entry the information of the patients . . . . . . Visualization of the acoustical features . . . . . . . . . . . Visualization of articulation features . . . . . . . . . . . . Visualization of the NLD features . . . . . . . . . . . . . . Digital signal processor TMS320C6713 . . . . . . . . . . . DSP block diagram . . . . . . . . . . . . . . . . . . . . . . A). Vowel /a/ speech signal. B) Fundamental frequency . . Real time processing strategy on DSP . . . . . . . . . . . . Odroid U2 board for the embedded system implementation Real time processing strategy on Odroid . . . . . . . . . . Embedded system based on Odroid-U2 . . . . . . . . . . . Main window of GUI implemented on portable device. . . Window to entry the information of the patients . . . . . . Visualization of the acoustical features . . . . . . . . . . . Visualization of the articulation features. . . . . . . . . . . Visualization of the NLD features . . . . . . . . . . . . . .
. . . . . . . . . . . . . . . . .
. . . . . . . . . . . . . . . . .
25 26 27 27 28 29 30 30 31 32 33 34 34 35 36 36 37
5.1 5.2 5.3 5.4 5.5
Pitch envelope from voice recording (PD: left, HC: right) . . . VSA calculated on the Odroid U2 . . . . . . . . . . . . . . . . Phase space obtained from voice recordings (PD: left, HC: right) A) Jitter increase in PPD. B) Shimmer increase in PPD . . . A) VSA decrease in PPD. B) FCR increase in PPD . . . . . . VII
41 42 42 43 44
VIII 5.6
LIST OF FIGURES A) CD increase in PPD. B) LLE increase in PPD . . . . . . . 44
List of Tables 4.1 4.2
TMS320C6713 DSP features . . . . . . . . . . . . . . . . . . . 29 Odroid U2 features . . . . . . . . . . . . . . . . . . . . . . . . 32
5.1
Mean and standard deviation of jitter and shimmer measured on each platform . . . . . . . . . . . . . . . . . . . . . . . . Mean and standard deviation of VSA and FCR measured on each platform . . . . . . . . . . . . . . . . . . . . . . . . . . Mean and standard deviation of CD and LLE measured on each platform . . . . . . . . . . . . . . . . . . . . . . . . . . Mean squared error between the values obtained with each platform and Odroid . . . . . . . . . . . . . . . . . . . . . .
5.2 5.3 5.4
IX
. 45 . 45 . 46 . 47
X
LIST OF TABLES
Abstract Parkinson’s disease (PD) is a neurodegenerative disorder that affects the coordination and regulation of muscles and limbs, including those responsible of speech production, resulting alterations in voice intelligibility. It is already demonstrated that the constant speech therapy can improve the communication skills of the patients; however, the assessment of the speech quality and the progress of the therapy is made in a subjective manner by the medical experts. Due to this it is required the development of flexible tools able to assess objectively and guide the speech therapy. In this work one embedded system for the real time analysis of speech of people with PD is presented. Three platforms are developed. First, a Matlab Graphical User Interface is presented; second, a prototype based on the Texas Instrument TMS320C6713 DSP is implemented. The final application is implemented in a minicomputer that has an audio codec, storage capacity and an efficient processing unit. The device has been equipped also with a LCD monitor to display the information on real time and a mini keyboard for the interface with the user. Different measurements that are commonly used in the assessment of speech of people with PD are evaluated. The analysis includes acoustic and nonlinear features. In agreement with the state of the art, an increment of the pitch variation is shown for patients with PD, additionally; lower values of the vowel space area are also shown for speech recordings uttered by people with PD.
Chapter 1 Introduction Contents 1.1
Context . . . . . . . . . . . . . . . . . . . . . . . .
2
1.2
Motivation
. . . . . . . . . . . . . . . . . . . . . .
2
1.3
Hypothesis . . . . . . . . . . . . . . . . . . . . . .
3
1.4
Objectives . . . . . . . . . . . . . . . . . . . . . . .
4
1.5
1.4.1
General objectives . . . . . . . . . . . . . . . . . .
4
1.4.2
Specific objectives . . . . . . . . . . . . . . . . . .
4
Organization of the manuscript . . . . . . . . . .
1
4
2
Chapter 1. Introduction
Parkinson’s Disease is a neurodegenerative disorder that affects coordination and regulation of muscles and limbs, including those responsible of speech production; resulting alterations in the phonation, articulation and prosodic capabilities of people who have the disease. The constant speech therapy is fundamental in the recovering process of the communication capabilities of the patients. This research work presents the design and implementation of a portable device in order to perform a real time analysis of speech of people with Parkinson’s disease (PPD), and provide support in the phonoaudiologic therapy process. At first, a matlab Graphical User Interface (GUI) is developed. Once the algorithms are designed and tested on the GUI, they are implemented on the DSP TMS320C6713 from Texas Instruments. At the end, a portable device based on the minicomputer Odroid-u2 is developed; which includes the necessary peripherals for the data acquisition, and its subsequent processing and visualization. Classical techniques of speech acoustic analysis are used; and some techniques of nonlinear dynamics are proposed for the phonoaudiologic evaluation.
1.1
Context
PPD exhibit a chronic degenerative brain disease characterized especially by progressive loss of dopaminergic neurons, particularly in the substance nigra, which is responsible of coordinate and regulate the movement at level of muscular tone, including those muscles responsible of speech production; resulting alterations in voice intelligibility. these alterations are called hypokinetic dysarthria; which is perceptually characterized by reduced pitch variation (monotonicity), reduced loudness, breathy voice, imprecise in consonants production, variable speaking rate, and short rushes of speech [1].
1.2
Motivation
Parkinson’s Disease (PD) has been placed on the second position of the most frequent neurodegenerative illnesses list, after Alzheimer [2]. In case of Colombia, prevalence of PD is around of 172.4 cases per 100.000 population [3]. Speech impairments are commonly found in 90% of PPD, and, only from
1.3. Hypothesis
3
3% to 4% of the patients receive speech treatment [4]. The constant phonoaudiologic therapy is fundamental in the recovering process of the communication capabilities of the patients; however, the evaluation of the therapeutic exercises is performed perceptually and subjectively by the speech therapist. Also; the patients generally present difficulties in their displacement to the medical center in order to realize the therapy in that place, due to their lack of mobility. Due to this; the development of a portable computational tool that serves as guide in the therapeutic process of dysarthric voices is very important. There exist works focused on analyze the speech of people with Parkinson’s disease, however, the experiments have been realized in controlled environments; and devices that perform an analysis of speech of PPD in real environment, realize non invasive measures through a microphone; and use the bio-feedback concept in speech therapy, with the aim of serve as guide in therapeutic process; not have been implemented. The device must present results in real time and in a quantitative manner; also, it is required that the device has portability, in order to patients can carry it to their home. The real time analysis consists in the acquisition of speech signals through non-invasive methods, estimation of features, and results visualization while therapeutic exercise is performed. This evaluation allows generate a feedback process that is reflected in the evolution of the communicative capabilities of those conducting the therapy. The device must be in capacity of store the evaluation results; in order to both the doctor and patient have access to the evaluation; so they can observe the evolution process of the therapeutic exercise and guide it for a better way.
1.3
Hypothesis
Starting from point of view of speech acoustic analysis and non-linear dynamics, using digital signal processing techniques, it is possible develop a portable device, which realizes non invasive measures, in order to conduct a quantitative analysis of the severity of PD, and allows to the medical and the patient have knowledge about the evolution of the therapeutic process of speech signal.
4
Chapter 1. Introduction
1.4 1.4.1
Objectives General objectives
Develop an embedded system for real time analysis of speech of people with Parkinson’s disease, in order to support the development of speech therapy, and evaluate the progress of the disease.
1.4.2
Specific objectives
1. Design an strategy that allows estimate features of speech signal, including pitch, jitter, shimmer, vocalic formants, Vowel Space Area, Formant Centralization Ratio, Correlation Dimension, and Largest Lyapunov Exponent. 2. Develop a matlab Graphical User Interface that estimate in real time the described parameters, in addition to displaying the results in numerical and visual manner. 3. Develop a prototype over a DSP TMS320C6713, that allows estimate the described features in real time. 4. Implement the developed algorithms for the evaluation of speech signal over a minicomputer Odroid-U2; including the necessary peripherals for the acquisition and information processing; besides the displaying and storage of results.
1.5
Organization of the manuscript
The rest of work is distributed as follows: Chapter two contains a contextualization of the problem to be worked. Chapter three contains a detailed description of the estimation of features: Acoustical and non-linear dynamics; and the methods used to calculate them. Chapter four describes every one of the developed systems; first, the matlab GUI, following the DSP prototype, and finishing with the development of final device over the Odroid-U2 board. Chapter five describes the tests realized on each platform and shows the derived results of this work. Finally, chapter six shows the main conclusion derived of this work.
Chapter 2 State of the art Contents 2.1
Speech analysis of people with Parkinson’s disease
6
2.2
Implementation of devices for real time analysis of speech . . . . . . . . . . . . . . . . . . . . . . . .
8
5
6
Chapter 2. State of the art
With the aim of find solutions to the speech impairments or to reach an earlier diagnose, there exist different tools and methodologies focused on the characterization and classification of speech of people with PD. So, this chapter presents the review of some of the more representative works that are applied in the analysis of speech of PPD, using acoustic and nonlinear dynamic (NLD) features. Also, works focused on implementation of devices for real time analysis of speech are presented.
2.1
Speech analysis of people with Parkinson’s disease
Currently, several computational tools focused on estimation of features and automatic classification of speech signals of PPD have been developed; in order to find solutions that allow improve the intelligibility of the speech signal, or perform an early diagnosis of the disease. Several laboratories and research centers have developed a great deal of methodologies focused on signal analysis and pattern recognition with the aim of measure the affectation degree of the speech signal due to PD, and perform an automatic classification of people with the disease. This kind of researches that are centered on the features of speech that are more affected due to Parkinson’s disease begin with the work published by Canter in 1963 [5]; the author performed measures of speech of 17 patients with PD and found that in people with the disease, the fundamental frequency range is reduced. After, in 1987 was proposed the Lee Silverman Voice Treatment (LSVT) as a protocol for the auto-therapy in speech of PPD. This protocol includes five tasks: The sustained phonation of vowel /a/ in constant tone; varying from high to low tone; varying from low to high tone; reading of 10 words; and reading of a 60 words text. This procedure has shown have positive effects in speech of PPD in early stage of the disease [6]. Later on, in 1998 [7] the authors analyze the pitch variation on the intonation of certain phrases where a decrease or increase of pitch has been found; the authors found that the difference in pitch between PPD and HC is reduced in patients. The following year, Wong [8] investigated the tone production of PPD using acoustic measures of pitch and energy as a comparison between PPD and HC. The authors validate previous investigations finding that the
2.1. Speech analysis of people with Parkinson’s disease
7
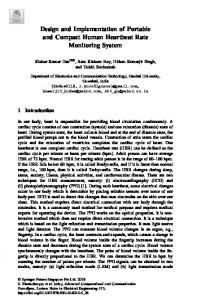
tone space and pitch range of PPD is limited. In 2010. Sapir [9], proposes a new feature to measure the articulation capability of PPD: the Formant Centralization Ratio (FCR). According to various experiments realized, this feature shows a better robustness and a higher discriminant ability between healthy and pathological speech than other kind of features as Vowel Space Area (VSA) in linear and logarithmic scale. On same year, Tsanas [10] describes a new system based on different acoustic, noise, and NLD measures, in order to perform a tele-monitoring of speech signal of PPD through a call phone, and perform an automatic classification of the illness; the authors reach a classification rate of 98.5%. Recently, in [11], the authors analyze the articulation capability of PPD based on VSA and Vowel Articulation index (VAI) measures; finding that VAI value is significantly reduced in PPD respect HC. The study considers a total of 68 patients: 34 men, and 34 women; and healthy control group compound by 32 persons: 16 men and 16 women; the database is balanced by age and gender. On same year, Mekyska [12], provides a description of the most commonly used features to reach the best automatic classification between several stages of PD. The authors describe the importance of features as jitter and shimmer. Jitter presents a higher value in PPD due to the inability to maintain laryngeal muscles in a stable position for a longer period of time; a higher value is presented in shimmer too, due to, in terms of respiration, speakers do not breathe efficiently. Respect to the articulation capabilities, the authors describe the discriminant ability of features as vocalic formants, according to the estimation of VSA and FCR. In [13], the authors analyze the tremor, gait, and speech signals of PPD; the authors emphasize about the importance of NLD features. The analysis is realized using several computational tools as CDA, Nlyzer, and TISEAN [14], [15], [16]; The authors indicate that nonlinear dynamics (NLD) features are important for such diagnosis, and highlight the capability of correlation dimension (CD) and largest Lyapunov exponent (LLE) to classify between PD patients and healthy controls. Last year, Other works have been developed, with the aim of perform an analysis of speech of PPD using spectral measurements [17] [18]. The first explores the low frequency bands of speech spectrum using the Teager Energy Operator (TEO), and Modified Group Delay Functions (MGDF), in order to classify the speech of people with PD of speech from healthy people. The authors reach classification rates around 92.5 % for the analysis of phonations
8
Chapter 2. State of the art
of vowel /e/. In [18], the authors analyze the discriminant ability of several features as Linear Prediction Coefficients (LPC), Cepstral LPC (LPCC), Mel Frequency Cepstral Coefficients (MFCC), Perceptual Linear Prediction Coefficients (PLP), and two kinds of Relative Spectral Coefficients (RASTA); in order to reach an automatic classification of PPD respect to HC. The authors reach a success rate around of 76%. Respect to NLD features for the analysis of pathological speech; the work proposed by Patricia Henr´ıquez in 2009 is highlighted [19]; the authors study and analyze the behavior of six non linear dynamic features and chaos theory in order to realize an automatic classification between healthy and pathological voices. The features include the first minimum of mutual information, the correlation dimension, the correlation entropy, the first and second-order R´enyi entropies, and Shannon entropy. The authors perform the feature estimation and classification on two databases, and reach a success rate of 82.47% over the first data base, and 99.69% over the second. On the same year, in [20], the authors include four NLD features accompanied of acoustic features with the aim of reach an automatic classification between healthy and PD voices, NLD features included are: Correlation Dimension, Recurrence Period Density Entropy (RPDE), Detrended Fluctuation Analysis (DFA), and a new feature called Pitch Period Entropy (PPE) is proposed; the authors achieve a classification rate of 91.4%; however, the evaluation protocol applied by the authors includes only sustained utterances of vowel /a/, keeping off fundamental aspects related to the communicative capabilities of patients. Later on, in 2011, [21], the authors develop a system to detect vocal pathologies through Hidden Markov Model (HMM) using NLD features as CD and LLE, the set of features is completed with noise measures and MFCC. Last year, in [22], NLD features are used in order to reach an automatic classification between PPD and HC people. the authors use only NLD features as CD, LLE, Lempel-Ziv complexity, Hurst exponent, RPDE, DFA, and others; the authors find success rate of 77% using only NLD features.
2.2
Implementation of devices for real time analysis of speech
Currently, there exist several works focused on analyze speech signals in real time, with the aim of serve as a guide of therapeutic process, and create a
2.2. Implementation of devices for real time analysis of speech
9
bio-feedback element for the patient, in order to they can know in every time instant the result of their therapeutic evaluation. In agreement with this framework; in 1980, Zicker [23], developed a portable device for the control and monitoring of the speech loudness of PPD through an auditive bio-feedback mechanism. The device designed sends an alarm to the patient when the loudness of his voice is out of a predefined threshold. After, in [24] was developed a system based on feedback concept too. The system provides real time information about the intensity of speech of the patient. The device integrates to the device proposed in [23] visual feedback mechanisms and data transfer to a host-PC in order to realize an analysis of the results of the therapeutic process. There exist also different patents related to the bio-feedback process. In [25] the authors present the details of a bio feedback method to train people in their self-regulation of physiological functions. The method is based on displaying the results of the analysis, giving useful information to correct the parts of the process that the patient is performing badly, or in order to display information that explains to the patient what is actually happening on his/her organism. Later on, in [26], was developed a system that allows perform the following of the therapeutic exercise in people with stuttering, the system makes emphasis on the assessment and visualization of the results while the patient performs the therapy. Recently, in [27] was developed a system to monitor in real time the intensity of speech when the patients are outside of the medical center; the results obtained show the importance of the training using biofeedback therapy method. The device realizes the measurement through a contact microphone that is sticked to the neck of the patient while the results are displayed on a LCD monitor. In 2011, was developed a device called Voxlog [28], this device consists in an accelerometer located on the neck of the patient with the objective to measure in real time the Skin Acceleration Level (SAL), the Sound Pressure Level (SPL), the fundamental frequency and the phonation rate. On the same year, in [29], were designed several methods and algorithms which are implemented on Voxlog device; the designed algorithms include estimators of fundamental frequency and SPL. The algorithms are implemented on first instance on Matlab and on a prototype based on a DSP Blackfin ADSPBF526; finally, the obtained results between the two platforms are compared, and are implemented on Voxlog device. In this device, the signal is acquired through a contact microphone and an accelerometer attached to the neck of
10
Chapter 2. State of the art
the patient. Last year, in [30], was implemented a portable device for the real time analysis of speech; the device allows identify different vocal disorders. In the feature estimation, the authors give special treatment to the fundamental frequency estimation in this kind of analysis. Also, the device measures the Sound Pressure Level and the phonation duration; The acquisition of signal is realized through and an electret condenser microphone attached to the neck of the patient. It is important to note that the methods presented in [29], [26], and [30] are all invasive and based on the use of external instruments that are added to the body, which can be uncomfortable for the patients. Although there are different works focused on the analysis of speech of people with PD, there is a lack of portable devices that allow the speech analysis by means of a common microphone, not adhering external things to the neck of the patients, and providing the bio-feedback to the user in real time.
Chapter 3 Feature estimation Contents 3.1
3.2
3.3
Acoustical features
. . . . . . . . . . . . . . . . .
12
3.1.1
Fundamental frequency (pitch) . . . . . . . . . . . 12
3.1.2
Jitter . . . . . . . . . . . . . . . . . . . . . . . . . 12
3.1.3
Shimmer
. . . . . . . . . . . . . . . . . . . . . . . 13
Articulation features . . . . . . . . . . . . . . . .
13
3.2.1
Vocalic formants . . . . . . . . . . . . . . . . . . . 13
3.2.2
Vowel Space Area (VSA) . . . . . . . . . . . . . . 14
3.2.3
Formant Centralization Ratio (FCR) . . . . . . . . 15
Non-Linear Dynamics features . . . . . . . . . .
15
3.3.1
Embedding . . . . . . . . . . . . . . . . . . . . . . 16
3.3.2
Correlation Dimension . . . . . . . . . . . . . . . . 18
3.3.3
Largest Lyapunov Exponent . . . . . . . . . . . . . 20
11
12
Chapter 3. Feature estimation
Acoustic features estimated are: Fundamental frequency of speech (pitch), perturbation parameters as jitter and shimmer; and formats. Additionally, after estimate formants, VSA [11] and FCR [9] are calculated. Non-linear features included in the implemented systems are Correlation Dimension [31] and Largest Lyapunov Exponent [32]; these NLD features have been used constantly with the purpose of differentiate pathological of healthy voices [19] [21] [22]. The features are estimated in real time, while the patient is doing the therapy, or a recording is loaded on the system in order to be analyzed.
3.1 3.1.1
Acoustical features Fundamental frequency (pitch)
Pitch is defined as the fundamental frequency of the speech signal and it is associated to the vibration period of the vocal folds [33]; in people with speech disorders developed due to the presence of PD, this feature shows an unstable behavior and a decrease of its range, producing a monotonic speech [13]. The process to estimate the pitch is as follows: The energy of the normalized speech signal is calculated, then only the frames of the speech that exceed a threshold are considered to calculate the autocorrelation function according to the equation 3.1. Negative part of the autocorrelation function is eliminated (clipping) and finally, the pitch is estimated as the distance between the first two peaks in the clipped auto-correlation function. The procedure is summarized in Figure 3.1. Rxx [n] =
∞ X
x[k] ∗ x[k − n]
(3.1)
k=0
For n=0, 1, 2, ...
3.1.2
Jitter
This feature provides information about the temporal variation of the fundamental frequency values along the phonation [34]. Jitter value is estimated using the equation 3.2, for a signal of N frames of length; where Mp is the maximum value of pitch; which is constantly updated in every phonation
3.2. Articulation features
13
Figure 3.1: Pitch estimation process
period. Jitter(%) =
3.1.3
N 100 X |pitch(k) − Mp | N ∗ Mp k=1
(3.2)
Shimmer
Shimmer provides information about the amplitude changes in the speech signal every phonation period [34]. The estimation of this feature for a speech signal of N frames of length is shown in the equation 3.3, where A(k) corresponds to the signal amplitude in every period, Ma is the maximum amplitude of the signal. Shimmer(%) =
3.2
N 100 X |A(k) − Ma | N ∗ Ma k=1
(3.3)
Articulation features
This kind of features are estimated through the frequency response of the speech signal, and establish an indicator about the articulation capabilities of patients; in this work, vocalic formants, VSA and FCR are estimated.
3.2.1
Vocalic formants
Vocalic formants are widely used for the evaluation of the articulation capabilities of patients [11]. They can be found by tracking the peaks in the envelopment of the linear speech spectrum, determining the existence of several laryngeal, vocal and nasal resonances in the speech signal [11]. The estimation method is based on Linear Prediction Coefficients (LPC Analysis). This
14
Chapter 3. Feature estimation
strategy calculates the spectrum envelope of speech signal through an allpole filter. According to the Toeplitz Symmetry exhibited on the correlation matrix, the filter coefficients are estimated trough the Levinson-Durbin algorithm. The frequency response of the LPC filter corresponds to the spectrum envelope of the speech signal; the two first peaks on the envelope correspond to the first and second formant respectively (F 1 and F 2). As illustration, in Figure 3.2 is shown the speech signal spectrum of a vowel /a/ recording speech signal accompanied of it LPC filter.
Figure 3.2: LPC response
3.2.2
Vowel Space Area (VSA)
After estimate F 1 and F 2 for vowels /a/, /i/, /u/, a triangle formed by a plane of F 2 in function of F 1 is created, the area of that triangle is known as the Vowel Space Area [11]. This feature is calculated using the equations 3.4, 3.5, 3.6, 3.7, 3.8. Where S corresponds to the semi-perimeter of the triangle, and l1 , l2 , and l3 correspond to the length of every one of the triangle sides. p V SA = 2 S(S − l1 )(S − l2 )(S − l3 ) (3.4) S=
l1 + l2 + l3 2
(3.5)
3.3. Non-Linear Dynamics features l1 = l2 = l3 =
3.2.3
15
p 2 (F 1/a/ − F 1/i/)2 + (F 2/a/ − F 2/i/)2
(3.6)
p 2 (F 1/u/ − F 1/i/)2 + (F 2/u/ − F 2/i/)2
(3.8)
p 2 (F 1/a/ − F 1/u/)2 + (F 2/a/ − F 2/u/)2
(3.7)
Formant Centralization Ratio (FCR)
This feature was purposed in [9] as an alternative for measure the articulation capability of the patients; it is calculated using the equation 3.9, after estimate the vocalic formants for /a/, /i/, and /u/ vowels. F CR =
3.3
F 1/i/ + F 1/u/ + F 2/u/ + F 2/a/ F 2/i/ + F 1/a/
(3.9)
Non-Linear Dynamics features
The problem of analysis of speech pathologies have been classically addressed by speech acoustical analysis techniques; however, there exist cases where the pathology level is so high that the acoustical theory not offer 100% reliable results [35]. The speech production model involves some non-linear process as non-linear pressure flow in glottis, and non-linearity that occurs in the vocal fold collision [21]; these processes can not be characterized using classical measures. In order to resolve this problem, the NLD analysis has been established as a mathematical alternative for the analysis of this kind of process. The nonlinear dynamic analysis describes the temporal evolution of a system through a multiple dimension space on which the signal speech is reconstructed. The NLD analysis begins with the reconstruction of the state space of the speech signal; in this way, topological features of the phenomenon can be analyzed [36]. The state space is known as phase space or attractor. The next subsections describe, on first instance the method to the construction of the state space, and the estimation of its associated parameters as the embedded dimension and the time delay; after, the features derived of that space as the correlation dimension and largest lyapunov exponent are described. These features allow measure the complexity and aperiodicity of the speech signal.
16
Chapter 3. Feature estimation
3.3.1
Embedding
The embedding process is the first step for the state space reconstruction of a dynamical system in order to observe a time series. The most common technique consists in the method proposed by F. Takens [37]. Where, for a time series x(i) i = 1, 2, 3 . . . Nm , a vector set X[k] are defined in a new space analysis defined by the equations 3.10 and 3.11. X[k] = {x[k], x[k + τ ], x[k + 2τ ], ...x[k + (m − 1)τ ]} x1 x1+τ ··· x1+(m−2)τ x1+(m−1)τ x2 x2+τ ··· x2+(m−2)τ x1+(m−1)τ .. . . . . .. .. .. .. X[k] = . xNm −1 xNm −1+τ · · · xNm +1−(m−2)τ xNm +1−(m−1)τ xNm xNm +τ · · · xNm −(m−2)τ xNm −(m−1)τ
(3.10)
(3.11)
Where Nm = N − (m − 1)τ is the reconstructed vector length; τ is known as time delay; and m is defined as the embedding dimension. In order to reach a good representation of the state space, the associated parameters to the attractor as time delay τ and embedded dimension m must be carefully estimated. Embedding dimension Embedding dimension is defined as the minimum dimension that describes the phase-space’s behavior in a complete way. If a higher dimension is chosen, the time series representation will be redundant, and will be influenced by noise; in return, if the chosen dimension is too small, reconstruction phase space could not reflect the dynamics of the original system. [36]. An effective method to estimate the embedding dimension it is called the method of false nearest neighbors. This method was proposed by M. Kennel [38]; in essence, this method determines when points in dimension m are neighbors of one another by virtue of their projection onto a low dimension. The algorithm employed for the embedding dimension estimation using false nearest neighbors include following steps. 1. Embedding vectors in m0 dimension are defined according to the equation 3.12. X[k] = {x[k], x[k + τ ], x[k + 2τ ], ...x[k + (m0 )τ ]}
(3.12)
3.3. Non-Linear Dynamics features
17
2. X[k]N is defined in equation 3.13 as the nearest neighbors of vector X[k] in the phase-space. � X[k]N = x[k]N , x[k + τ ]N , x[k + 2τ ]N , ...x[k + (m0 )τ ]N
(3.13)
3. The distance between the vectors X[k] and X[k]N is shown as follows in the equation 3.14 2 Rm [k]
=
m0 X
(x[k + i ∗ τ ] − xN [k + i ∗ τ ])2
(3.14)
i=0
4. The phase space is reconstructed in (m0 + 1) dimension, which imply add (m + l)th coordinate onto each of the embedding vectors. Therefore the distance between the vectors X[k] and X[k]N in a (m0 + 1) dimension is: 2 Rm+1 [k] =
m 0 +1 X
(x[k + i ∗ τ ] − xN [k + i ∗ τ ])2
(3.15)
i=0
2 = Rm [k] + (x[k + (m0 + 1) ∗ τ ] − xN [k + (m0 + 1) ∗ τ ])2
5. If Rm+1 [k] is too high when it is compared with Rm [k], the nearest neighbor in phase space it is considered as false and the embedding dimension must be increased. The equation 3.16 is a criterion used for judge the false neighbors [39]. s
2 2 Rm0+1 [k] − Rm0 [k] 2 Rm0 [k]
x[k + (m0 + 1) ∗ τ ] − xN [k + (m0 + 1) ∗ τ ] ≥ RN N = Rm0 [k]
(3.16)
Where RN N is a threshold level that is chosen of heuristic way. Finally, the embedding dimension is correct when the result of evaluate the expression 3.16 drops to zero.
18
Chapter 3. Feature estimation
Time delay With the aim of complete the phase space reconstruction, it is necessary find the time delay τ that allows reach a suitable representation of the state space. The known methods to find a time delay value are based on: One on the first minimum of mutual information function, and other on the first zero of the auto-correlation function (FZA). This work uses the FZA criterion, according to the equation 3.1. The smaller positive value of n which Rxx (n) ≥ 0 is commonly used as time delay τ , however, some authors consider the n value when the autocorrelation drops to 1 − 1e as a criterion to evaluate time delay [40]. As illustration, the figure 3.3, shows the attractor generated by a sinusoidal function accompanied of the time signal; and, in the figure 3.4 can be appreciated the attractor generated by a speech signal of vowel /a/.
Figure 3.3: A). Sinusoidal signal. B). Sinusoidal signal attractor
3.3.2
Correlation Dimension
After the reconstruction of the phase space that was described in the previous subsection, an analysis of the complexity and dimensionality of the reconstructed attractor must be realized. In order to perform that analysis, the concept of correlation dimension appears, which is tied to the concept of fractal dimension; this feature establishes a measure about of the exact space that is occupied by the attractor in the multidimensional space where is constructed. This concept was proposed by Grassberger and Procaccia in [31].
3.3. Non-Linear Dynamics features
19
Figure 3.4: A). Vowel /a/ speech signal. B). Speech signal attractor
To estimate the correlation dimension, it is defined correlation sum according to the equation 3.17. N X N X 1 C(ε) = lim Θ(ε − |Xi − Xj |) n→∞ N (N − 1) i=1 j=i+1
(3.17)
Where Θ is the Heaviside step function, C(ε) counts the distances between the points Xi and Xj that are less than a threshold ε. Note that the correlation sum C(ε) is just a probably function, where the favorable cases are the number of points that are contained in an hyper-sphere of m dimension and ε radius, and the possible cases are the number of points that create the multidimensional system (N ∗ (N − 1)). Grassberger and Procaccia consider that for small values of ε, can be demonstrated the following expression: C(ε) = limεCD ε→0
(3.18)
Where CD is the correlation dimension. According to this; CD can be estimated through the equation 3.19. CD = lim
ε→0
ln(C(ε)) ln(ε)
(3.19)
In order to estimate CD, is necessary to plot ln(C(ε)) versus ln(ε), the slope of the resulting line, when a linear regression is realized for small values of ε corresponds to the correlation dimension CD.
20
Chapter 3. Feature estimation
A good estimation of CD must guarantee that the embedded dimension must be almost the double plus one of the correlation dimension, namely, m = 2CD + 1 [39].
3.3.3
Largest Lyapunov Exponent
The dynamic of a periodical signal is fully identified by closed attractors, while for an aperiodic signal, an irregular curves series are generated in phase state (strange attractors). The Largest Lyapunov Exponent (LLE) quantifies the exponential divergence of neighbor trajectories in a phase space. In other words, the largest Lyapunov exponent, measures the aperiodicity degree over an speech signal. This aperiodicity establishes an indicator about the existence of pathologies on the speech signal [21]. The algorithm described in [40] is used to estimate the Largest Lyapunov Exponent in this work; this method has a high robustness degree for the evaluation of speech signal affected by noise and short length. The estimation process begins with the reconstruction of the phase space using the Takens theorem [37], according to the expressed at the beginning of this section. After the attractor’s reconstruction, the nearest neighbor of every point in the trajectory is located.The nearest neighbor Xˆj is that which minimizes the euclidean distance from the benchmark Xj , according to the equation 3.20.
dj (0) = min Xj − Xˆj (3.20)
Where dj (0) indicates the initial divergence between Xj and its nearest neighbor Xˆj ; and, kk is the euclidean distance between points. One condition must be imposed in order to guarantee that the neighbors data are in different trajectories in the phase space. For that, in the time series, the data must be separated a distance bigger than the signal average period, according to the equation 3.21. (3.21) j − ˆj > mean period
The largest Lyapunov exponent is estimated as the mean separation rate between the nearest neighbors according to the Oseledec theorem [41], which is shown as follows in the equation 3.22. d(t) = Ceλ1 t
(3.22)
3.3. Non-Linear Dynamics features
21
Where: λ1 corresponds to LLE; d(t) is the mean divergence in t instant, and C is a constant used for normalization effects. If it is taken that the j−th pair of neighbors diverges at LLE rate can be demonstrated the next equation. dj (i) = Cj eλ1 (i∆t)
(3.23)
Where Cj is the initial separation. When the ln function is evaluated in both sides of the equation 3.23, it is obtained the equation 3.24 ln dj (i) ≈ ln Cj + λ1 (i · ∆t) This equation represents parallel lines with λ1 slopes.
(3.24)
22
Chapter 3. Feature estimation
Chapter 4 Platforms development and implementation Contents 4.1
Graphical User Interface in Matlab
. . . . . . .
24
4.1.1
Operation of the system . . . . . . . . . . . . . . . 24
4.1.2
Processing . . . . . . . . . . . . . . . . . . . . . . . 26
4.2
DSP TMS320C6713 Prototype . . . . . . . . . .
28
4.3
Device based on Odroid-U2 . . . . . . . . . . . .
30
4.4
4.3.1
Features of the device . . . . . . . . . . . . . . . . 31
4.3.2
Operation of the system . . . . . . . . . . . . . . . 33
Praat analysis
. . . . . . . . . . . . . . . . . . . .
23
35
24
Chapter 4. Platforms development and implementation
All features that were described in the previous chapter, are coded over three different platforms in order to guarantee more flexibility and more robustness for the obtained results. First, a Matlab GUI is developed, which acquires the speech signal using a PC audio card, also, the GUI displays in real time the pitch, jitter, shimmer, F1, F2, and NLD features values in a numerical and graphical way. When the patient realize phonations for vowels /a/, /i/, /u/, VSA and FCR are calculated. Second, the algorithms that are designed and tested on Matlab, are implemented over a DSP TMS320C6713 from Texas Instruments, in order to develop the first prototype, which evaluate pitch, jitter, shimmer, and the vocalic formants. Third, the final device is based on the minicomputer Odroid-U2 [42]. This board has an ARM Cortex A9 at 1.7GHz processor, and 2GB RAM memory, also has USB ports for peripherals connection. To guarantee the good performance of implemented devices, the obtained results in every one of the platforms designed are compared with those obtained using a standard phonetical analyzer software as Praat [43].
4.1
Graphical User Interface in Matlab
This section describes the process of realization of Matlab GUI, in first subsection, a description of the interface is realized; second, the methodology for the data processing is described.
4.1.1
Operation of the system
The GUI developed in matlab estimates all features described in the previous chapter, and displays the results of the evaluation in numerical and graphical way. In Figure 4.1 the main window of GUI is shown. In that main window,the buttons for the control and management of the interface can be observed, which are described as follows: 1. Register Patient: This button is to do the registration of the personal information of new patients. 2. Generate Report: At the end of the process, when a click in this button is made, a report file with a *.pdf file is generated; this report contains
4.1. Graphical User Interface in Matlab
25
Figure 4.1: Main window of Matlab Graphical User Interface
the results of the evaluation of therapy. 3. Reset: This button cleans all the data of evaluation, in order to realize a new recording, or repeat the therapeutic exercise. 4. Record : This button is to start the recording process through a microphone that is plugged in to PC. 5. Load : This button allows to load a *.wav audio file to the software. 6. Play: This button plays the sound that was recorded from the microphone, or a recording that was loaded. 7. Stop: Finish recording of audio samples. Additionally, the main window has a vowels selector, in order to choose which vowel is going to be evaluated among /a/, /i/, /u/. Also, the speech signal and its fundamental frequency are deployed in real time in a graphical way. The rest of features (jitter, shimmer, F1, F2, CD, LLE) are observed in a numerical way; VSA, and FCR values are shown after that the evaluation is realized for sustained phonations of the vowels /a/, /i/, and /u/. Also, this window has others three buttons called View Plots, in order to watch with more details every one of the features that are evaluated. The acoustical features at left, the spectral and articulation features at middle, and the NLD measures at right side of the window.
26
Chapter 4. Platforms development and implementation
When a click on the button Register Patient is made, a second window appears in order to digit the personal information of the patient, this second window can be observed in the figure 4.2. After the estimation of features,
Figure 4.2: Window to entry the information of the patients
when the View Plots button at the left side is clicked; the window of the figure 4.3 appears, this window shows with more detail the pitch, jitter, and shimmer values. The figure 4.4 shows the window that appears when a click is made in the button View Plots at the middle of the interface, in the panel Articulation. There are shown with detail, the formant values for vowels /a/, /i/, and /u/, and the plot of the vocalic triangle of the patient accompanied by a reference triangle that was obtained in the evaluation of HC group. The figure 4.5 shows the result of evaluation of the NLD features, the window shows the plot of attractor of the speech signal, the correlation dimension and the largest lyapunov exponent. This window appears when click in the View Plots button of the right side of the GUI is made.
4.1.2
Processing
The processing of information on the Matlab GUI is explained as follows: 1. The speech signal of the patients is acquired through the PC audio card with a sample frequency of 44100Hz and 16 quantization bits.
4.1. Graphical User Interface in Matlab
Figure 4.3: Visualization of the acoustical features
Figure 4.4: Visualization of articulation features
27
28
Chapter 4. Platforms development and implementation
Figure 4.5: Visualization of the NLD features
2. While the signal is acquired, 50ms frames of speech signal are made, every one of them is processed in an individual way. 3. all features in every one of the frames of speech signal is estimated. 4. The result of feature estimation is displayed numerically, and graphically. 5. This process is repeated until the patient has ended the utterance, or the recording is finished.
4.2
DSP TMS320C6713 Prototype
First prototype, is based on T M S320C6713 development system; this board is a low cost development platform, for real time digital signal processing; it contains a T M S320 processor developed by Texas Instruments, with floating point unit. This platform also includes an audio codec with the purpose of provide to board, analogical input and output ports for their processing. Table 4.1 summarizes the main features of the DSP. Figure 4.6 shows an image of DSP board, and Figure 4.7 shows a block diagram of its intern configuration. Finally, in Figure 4.8 can be appreciated the result of the pitch estimation for the recording of a sustained vowel on DSP platform. The real time processing strategy consists on three buffers, first for the acquisition of speech signal, second for the signal processing, and third for
4.2. DSP TMS320C6713 Prototype
29
Table 4.1: TMS320C6713 DSP features
Feature Processor Memory Audio codec Ports Communication Additional Software Compatibility
Detail floating point Texas instruments 225MHz TMS320C6713 512KB flash - 16MB SDRAM stereo 24 bits 4 jacks audio: microphone, earphone, line in, and line out Possibility of comunication with external software as Matlab and Labview 4 leds and 4 dip-switch general purpose Texas Instruments code composer studio v. 3.1 windows 2000/XP
Figure 4.6: Digital signal processor TMS320C6713
the deployment and representation of the results [44]. Figure 4.9 shows a flow diagram of the proceeding realized for the feature estimation on the DSP.
30
Chapter 4. Platforms development and implementation
Figure 4.7: DSP block diagram
Figure 4.8: A). Vowel /a/ speech signal. B) Fundamental frequency
4.3
Device based on Odroid-U2
The device implemented estimate all features described in previous chapter, equal as Matlab GUI; the main utility of this device resides in its portability,
4.3. Device based on Odroid-U2
31
Figure 4.9: Real time processing strategy on DSP
which allows to the patients carry the device to their home, in order to realize the therapy on that place; without the need to go to the medical center; because in a lot of times PPD present difficult on move and displacement due to the disease. The next subsections describe, on first hand, the features of the device that are implemented on board, and the methodology followed for guarantee the correct processing. Later on, the working of device for realize the phonoaudiologic therapy, is described.
4.3.1
Features of the device
The device is based on the minicomputer Odroid-U2 [42], this is a small but quite powerful and versatile board. The card has a four cores processor, and a 3D graphical accelerator; also 2GB RAM memory. By means of the microSD lector, space for the Operative System (OS) and storing can be used. The board contains also a NAND memory reader, which improves the speed in 200% respect to SD cards. Table 4.2 shows with more detail the specifications of the board, and Figure 4.10 details an image of the card. The embedded system implemented also includes, a hdmi LCD 7” monitor, in order to display the results, numerically, and graphically, a mini keyboard for the interaction with the user, and a storing unit. Software for device is developed in Python language because is an efficient language used to numerical and scientific computation, also, there exist a
32
Chapter 4. Platforms development and implementation
Table 4.2: Odroid U2 features
Feature Processor Memory Graphical accelerator 3D Audio codec Audio port USB ports Ethernet port hdmi port OS Storing unit Additional
Specification Samsung Exynos 4412 Prime Cortex-A9 Quad Core 1.7GHz with 1MB cache L2 2GB Mali-400 Quad Core 440MHz MAX98090 24 bits Jack 3.5mm output hdmi port, mic integrated on board 2 usb 2.0 ports LAN RJ45 Connector Micro hdmi 1080p resolution android 4.x and linaro ubuntu 12.10 distributions Micro SD and high speed eMMC nand . to port the OS and store information Aluminum heat-sink
Figure 4.10: Odroid U2 board for the embedded system implementation
great deal of libraries used to acquisition, processing, and deployment of all kind of data [45]. Software is ported over a linux Ubuntu linaro 12.10 distribution. Also Python software, some functions and routines are developed
4.3. Device based on Odroid-U2
33
in C++ language using the scipy.weave library [46], in order to optimize the performance and speed in the characterization process; also, multi-threading and multi-processing tasks are implemented [47]. Figure 4.11 summarizes the methodology used on device for the feature estimation in real time. After that 50ms frame is acquired, a process for characterization is executed; while it is executed that process, the values of features of the previous frame are displayed. At the end of the characterization process for the frame, the results are put in a queue which is accessed by the main application after the visualization process is finished. Figure 4.12 shows an image of the implemented device, including the at-
Figure 4.11: Real time processing strategy on Odroid
tached peripherals that complete the system.
4.3.2
Operation of the system
The embedded device has a Graphical User Interface, equal as matlab, in order to the patient can realize the therapeutic exercise and visualize the results while the utterance is realized. This GUI is implemented according to TKinter [48] and matplotlib [49] libraries, first for the development of graphics and buttons, second for the incorporation of 2D and 3D plot lines. The main window of this interface can be appreciated in Figure 4.13; can be noted that, visually, it is very similar to the Matlab GUI, and has the respective buttons to realize the same functions that are realized on that: Register the patient information, generate a report with the evaluation results, record audio through a microphone, load a previous recording, play audio, and display the results of the different features of phonation, articulation and NLD. Figure 4.14 shows the window that appears for the register of
34
Chapter 4. Platforms development and implementation
Figure 4.12: Embedded system based on Odroid-U2
Figure 4.13: Main window of GUI implemented on portable device.
4.4. Praat analysis
35
personal information of the patient before they perform the therapy. Figure 4.15 shows the window to visualize with more details the acoustical features (pitch, jitter, shimmer). In Figure 4.16 is appreciated the window to visualize the articulation results as the vocalic triangle including plots for the patient and the reference; VSA, FCR, and the LPC spectrum for every one of the vowels that are analyzed are shown too. Finally, in Figure 4.17 is shown the window with the NLD features as the Takens attractor for the speech signal, the correlation dimension and the largest lyapunov exponent.
Figure 4.14: Window to entry the information of the patients
4.4
Praat analysis
Praat is a software designed to realize phonetic analysis, it was developed at Amsterdam University by Paul Boersma and David Weenik [43]. Praat allows realize acoustical analysis, articulatory synthesis, data statistical processing, edition and manipulation of audio signals, phonetic segmentation and a great deal of additional functions. Main advantages include that is a free distribution software, open code, multiplatform, and free pay. Also, updates are made in automatic and permanently way. In order to estimate every one of the acoustic features described in the previous chapter; Praat disposes several tools of manual and automatic analysis; in this way, spectral or intensity analysis of the speech signal can be realized.
36
Chapter 4. Platforms development and implementation
Figure 4.15: Visualization of the acoustical features
Figure 4.16: Visualization of the articulation features.
In other side, the software has scripting tools, which combine own and operative system commands in order to realize the analysis over multiple speech signal in automatic way; the scripts generate text reports about the evaluation results, which are later analyzed. The evaluation realized in this work, contains scripts for estimate every one of the acoustical features that includes pitch, jitter, shimmer, and vocalic
4.4. Praat analysis
Figure 4.17: Visualization of the NLD features
formants, in order to estimate VSA and FCR.
37
38
Chapter 4. Platforms development and implementation
Chapter 5 Results and discussion Contents 5.1
Database . . . . . . . . . . . . . . . . . . . . . . . .
40
5.2
Tests and discusion . . . . . . . . . . . . . . . . .
40
5.2.1
Differences between PD and HC speech . . . . . . 41
5.2.2
Differences between devices and Praat analysis . . 43
39
40
Chapter 5. Results and discussion
With the aim of validate the obtained results in the implementation of every one of the platforms, several tests over each platform are realized. A database compound by recordings of the five Spanish vowels are used to the evaluation of features. In every one of the platforms are calculated all the features that was described and implemented in Chapter 3. In Matlab GUI and embedded system, the results of the estimation of pitch, jitter, shimmer, VSA, FCR, CD, and LLE are analyzed. In the DSP implementation are analyzed all measures excepting the NLD features. Finally, the results obtained in the evaluation of features on each platform are compared with Praat software, in order to guarantee the correct feature estimation. The next subsections describe, on first instance. the database that is used for the analysis; later on, the analysis of the results are shown.
5.1
Database
The database that is used to test the reliability of the designed platforms is an extended version of the one that is used in [17] [22], and [18]. This version includes speech recordings of 50 people with PD and 50 healthy controls, 25 men and 25 women on each group and all of the recordings are balanced by age and gender. The recordings are sampled at 44100Hz with 16 resolution bits. The age of the men with PD range from 33 to 77 years old (mean 62.2 ± 11.2), the age of the women with PD range from 44 to 75 years old (mean 60.1 ± 7.8). For the case of the healthy controls, the age of the men range from 31 to 86 (mean 61.2 ± 11.3) and the age of the women range from 43 to 76 years old (mean 60.73 ± 7.7). All of the patients were diagnosed by neurology experts and none of the healthy control had symptoms associated to PD or any other movement disorder. All of the developed algorithms are tested on this database with the aim of assure the good performance of the platforms and to validate the obtained results.
5.2
Tests and discusion
Every one of the three implemented platforms is tested using the database. Initially, the differences in features between pathological and healthy voices are analyzed; after, the results obtained in each platform are compared be-
5.2. Tests and discusion
41
tween them and with the results extracted from Praat.
5.2.1
Differences between PD and HC speech
As it is well documented in the state of the art, people with dysarthric speech show instability in their pitch envelope, this phenomenon is validated on the prototype (Odroid U2) and can be observed in Figure 5.1. Part A of Figure 5.1 illustrates the pitch envelope for five different patients with PD and part B shows the same feature for five healthy speech. Note that the pitch values are more stable in the case of healthy persons, while in the case of the patients, the pitch presents a jump that reflects the stability problem that is mentioned above. Other important result that is validated on the database is the behavior of
Figure 5.1: Pitch envelope from voice recording (PD: left, HC: right)
the vocal triangle of PD patients and healthy controls. Figure 5.2 shows the difference between the obtained vocal triangle for three different PD patients (dashed lines) respect to the triangle obtained from the mean values of all healthy controls. The compression of the VSA in the case of the PD patient is due to the loss of articulatory capability in these people. Respect to the NLD analysis, it is already demonstrated that the more pathological is the speech signal, the more complex is the associated attractor [50]. It means that one can expect more chaotic attractors in the case of speech signals of people with PD than of healthy ones. Part A of Figure 5.3 depicts the obtained attractor for PD patient and part B of the same figure
42
Chapter 5. Results and discussion
Figure 5.2: VSA calculated on the Odroid U2
shows the result for healthy person, both are 63 years old. According to the tests realized on the system based on Odroid-u2, using
Figure 5.3: Phase space obtained from voice recordings (PD: left, HC: right)
the database described above, PPD exhibit an increase in the perturbation measures as jitter and shimmer; this result can be observed in Figure 5.4. these results are consistent with those expressed in the state of art, where for recordings of sustained vowels, jitter presents a higher value due to the
5.2. Tests and discusion
43
inability of the patients of maintain the laryngeal muscles in a stable position for a longer period of time; and the changes in shimmer value are presented due to the speakers do not breathe efficiently [12]. Respect to the features responsible to measure the articulation capabilities
Figure 5.4: A) Jitter increase in PPD. B) Shimmer increase in PPD
in the patients, Figure 5.5 shows: In left side, the decrease in VSA value for PPD; and, in right side, the increase in FCR value for PPD respect to HC speech. These differences is presented due to the loss of the articulation capabilities of people with dysarthric speech. The NLD features show a positive result in the evaluation of speech of PPD, in Figure 5.6, a higher value in the median of CD and LLE is appreciated. This increase that is presented in both features entails in an increase in the complexity and aperiodicity of the speech signal in patients with Parkinson’s disease.
5.2.2
Differences between devices and Praat analysis
The result of the evaluation of jitter and shimmer on each platform is presented in Table 5.1, besides the results obtained with Praat are also included. Note that higher values of jitter and shimmer are observed for PD patients. This analysis allows confirm the graphical results shown in Figure 5.4.
44
Chapter 5. Results and discussion
Figure 5.5: A) VSA decrease in PPD. B) FCR increase in PPD
Figure 5.6: A) CD increase in PPD. B) LLE increase in PPD
Table 5.2 shows the values of the articulation features, confirming that VSA value is lower in PD patients than in healthy people. This behavior can be observed on the four tested platforms: Matlab, DSP, Odroid and Praat. Respect to the FCR, as it is also observed in Figure 5.5, people with PD exhibit values slightly higher than those obtained for HC.
5.2. Tests and discusion
45
Table 5.1: Mean and standard deviation of jitter and shimmer measured on each platform
Jitter HC mean Jitter HC Std. Dev Jitter PD mean Jitter PD Std. Dev Shimmer HC mean Shimmer HC Std. Dev Shimmer PD mean Shimmer PD Std. Dev
Matlab
DSP
Odroid
Praat
8.38%
7.65%
6.98%
5.31%
12.24%
6.49%
7.19%
3.04%
12.92%
12.16%
9.82%
8.94%
13.95%
12.05%
9.90%
7.27%
30.04%
28.63%
30.77%
40.95%
15.03%
13.88%
14.81%
20.52%
35.47%
30.11%
36.58%
59.34%
13.52%
11.15%
13.19%
33.46%
Table 5.2: Mean and standard deviation of VSA and FCR measured on each platform
VSA HC mean VSA HC Std. Dev VSA PD mean VSA PD Std. Dev FCR HC mean FCR HC Std. Dev FCR PD mean FCR PD Std. Dev
Matlab
DSP
Odroid
Praat
158,530
176,960
178,920
151,780
101,600
94,660
84,197
85,106
123,210
91,502
102,88
100,040
107,630
80,596
80,516
96,802
0.9841
0.9913
1.0149
1.0146
0.1023
0.1176
0.1133
0.0823
1.0744
1.0539
1.0671
1.0612
0.1478
0.1138
0.1176
0.1137
46
Chapter 5. Results and discussion
The values obtained for the NLD features are presented in Table 5.3. The difference between pathological and healthy voices can be easily observed through CD behavior, which is higher in PPD, while LLE is not able to discriminate between PD and HC recordings. Table 5.3: Mean and standard deviation of CD and LLE measured on each platform
CD HC mean CD HC Std. Dev CD PD mean CD PD Std. Dev LLE HC mean LLE HC Std. Dev LLE PD mean LLE PD Std. Dev
Matlab
Odroid
1.7951
1.9107
0.3619
0.1731
2.1474
2.0100
0.2869
0.2083
0.0016
0.0021
0.0011
0.0019
0.0019
0.0021
0.0013
0.0018
In addition to the difference between pathological and healthy voices of each feature, the differences of the values obtained when features are calculated on different platforms are also analyzed. Table 5.4 shows the mean squared error obtained when the values of each feature are compared respect to the values obtained on Odroid platform. The comparison is made considering each class of recordings (HC and PD) separately. Note that in general, there are not important differences between the results on each platform. Comparisons among the results obtained on Odroid and Praat or DSP are not included for CD and LLE because these measures were not calculated on such platforms. It is important to note that the differences in the values of features when are measured using different platforms are mainly related to the precision that is used to represent such values on each system. In Matlab the values are computed in float format, while the system developed on the Odroid platform uses integer with 32 bits of precision [51].
5.2. Tests and discusion
47
Table 5.4: Mean squared error between the values obtained with each platform and Odroid
Measure pitch HC pitch PD jitter HC jitter PD shimmer HC shimmer PD VSA HC VSA PD FCR HC FCR PD DC HC DC PD LLE HC LLE PD
Odrdoid-Matlab 0.3556 0.7068 0.8620 0.8734 0.013 0.0205 1.6185 0.5671 0.7617 1.6362 0.7907 0.3095 18.4632 7.2020
Odroid-DSP 0.3678 2.5774 0.5846 0.2435 1.2171 0.4576 4.7003 2.1809 4.9223 4.8168 -
Odroid-Praat 0.6983 1.8376 4.0236 0.3430 6.9484 7.4644 5.4545 4.4031 1.3933 1.9757 -
48
Chapter 5. Results and discussion
Chapter 6 Conclusion Contents 6.1
Conclusion
. . . . . . . . . . . . . . . . . . . . . .
49
50
50
Chapter 6. Conclusion
6.1
Conclusion
1. A new system for the automatic evaluation of speech signals of people with Parkinson’s disease is presented. The process for the design and testing of such system is completed in three steps: first, a Matlab graphic user interface is designed; second, the digital signal processor TMS320C6713 is used; and third, the prototype which is based on the Odroid-U2 is presented. 2. Different acoustic and perturbation features that are well known for the analysis of speech of people with PD are implemented on the designed system. Differences between the values obtained from speech recordings of PD patients and HC are observed in several features. The problems on articulation, phonation and breathing of people with PD are validated in the results. 3. Considering that the portable device is running in real time and that it is also equipped with a LCD monitor, the patient will receive a biofeedback about his/her speech therapy. This functionality will improve the effectiveness of the therapy and will motivate the patient to perform the exercises in the best way every day. 4. Real time visualization of pitch are very important because gives to the patients a visual feedback about their phonation; and allow the execution of Kaiser effect exercises. 5. VSA visualization are important because gives to the patients a visual feedback about their articulation capability, the patients will search the expansion of their vocalic triangle near to normalcy. 6. From the point of view of the speech therapists, this device will provide them with a new tool for the continuous monitoring of their patients. Since the device allow to record the speech signals and the obtained results after doing the exercises, the therapist will be able to monitor (in an objective way) the evolution of the speech therapy in their patients. 7. The future work will be focused on the robustness of the system, in order to improve its accuracy and usability. Likewise, the inclusion of other information sources such as gait and writing analysis will be
6.1. Conclusion
51
considered in the future in order to provide a complete multimodal platform for the analysis of patients with movement disorders.
52
Chapter 6. Conclusion
Bibliography [1] Lansford, K.L., Liss, J.M., Caviness, J.N., Utianski, R.L.: A cognitiveperceptual approach to conceptualizing speech intelligibility deficits and remediation practice in hypokinetic dysarthria. In: Parkinson Disease. Volume 2011. (2011) [2] de Rijk, M., Launer, L., Berger, K., Breteler, M., Dartigues, J., Baldereschi, M., Fratiglioni, L., Lobo, A., Martinez-Lage, J., Trenkwalder, C., Hofman, A.: Prevalence of parkinson’s disease in europe: A collaborative study of population-based cohorts. neurologic diseases in the elderly research group. In: Neurology. Volume 54. (2000) S21–S23 [3] S´anchez, J., Buritic´a, O., Pineda, D., Uribe, C., Palacio, L.: Prevalence of parkinson’s disease and parkinsonism in a colombian population using the capture-recapture method. International Journal of Neuroscience 114(2) (2004) 175–182 [4] Ramig, L., Fox, C., Shimon, S.: Speech treatment for parkinson’s disease. Expert Review Neurotherapeutics 8(2) (2008) 297–309 [5] Canter, J.: Speech characteristics of patients with parkinson’s disease: I. intensity, pitch and duration. Journal of Speech and Hearing Disorders 28(3) (163) 221–228 [6] Sapir, S., Spielman, J., Ramig, L., Story, B., Fox, C.: Effects of intensive voice treatment (the lee silverman voice treatment [lsvt]) on vowel articulation in dysarthric individuals with idiopathic parkinson disease: Acoustic and perceptual findings. Journal of Speech Language and Hearing Research 50(4) (2007) 899–912 53
54
Bibliography
[7] Dorze, G.L., Ryalls, J., Brassard, C., Boulanger, N., Ratte, D.: A comparison of the prosodic characteristics of the speech of people with parkinson’s disease and friedreich’s ataxia with neurologically normal speakers. Folia Phoniatrica et Logopaedica 50 (1963) 1–9 [8] Wong, P., Randy, L.D.: The effect of reduced tonal space in parkinsonian speech on the perception of cantonese tones. Journal of the Acoustical Society of America 105(2) (1999) 1246–1246 [9] Sapir, S., Ramig, L., Spielman, J., Fox, C.: Formant centralization ratio (fcr): A proposal for a new acoustic measure of dysarthric speech. Journal of Speech, Language and Hearing Research 53(1) (2010) 114– 133 [10] Tsanas, A., Little, M., McSharry, P., Ramig, L.: Accurate telemonitoring of parkinson’s disease progression by noninvasive speech tests. IEEE transactions on Biomedical Engineering 57(4) (2010) 884–893 [11] Skodda, S., Visser, W., Schlegel, U.: Vowel articulation in parkinson’s diease. Journal of Voice 25(4) (2011) 467–472 [12] Mekyska, J., Rektorova, I., Smekal, Z.: Selection of optimal parameters for automatic analysis of speech disorders in parkinson’s disease. 34th International Conference on Telecommunications and Signal Processing (TSP) (2011) [13] Oana, G.: Data processing for parkinson’s disease: Tremor, speech and gait signal analysis. Proceedings of the 3rd International Conference on E-Health and Bioengineering - EHB 2011 (2011) [14] Sprott, J.C.: Chaos http://sprott.physics.wisc.edu/cda.htm (1998)
data
analyzer.
[15] Nlyzer: Nonlinear analysis in real time, nlyzer. http://www.iap.tudarmstadt.de/nlyzer/?p=18 (2010) [16] Hegger, R., Kantz, H., Schreiber, T.: Tisean nonlinear time series analysis. http://www.mpipks-dresden.mpg.de/ tisean/ (2007) [17] E.Belalc´azar-Bola˜ nos, Orozco-Arroyave, J., Vargas-Bonilla, J., AriasLondo˜ nno, J., Castellanos-Dom´ınguez, C., N¨oth, E.: Low-frequency of
Bibliography
55
speech for automatic detection of parkinson’s disease. In: Lecture Notes in Computer Science. Volume 7930. (2011) 283–292 [18] Orozco-Arroyave, J., Arias-Londo˜ no, J., Vargas-Bonilla, J., N¨oth, E.: Perceptual analysis of speech signals from people with parkinson’s disease. In: Lecture Notes in Computer Science. Volume 6687. (2011) 201–211 [19] Henr´ıquez, P., Alonso, J.B., Ferrer, M.A., Travieso, C.M., GodinoLlorente, J.I., de Mar´ıa, F.D.: Characterization of healthy and pathological voice through measures based on nonlinear dynamics. IEEE Transactions on audio, speech, and language processing 17(6) (2009) 1186–1195 [20] Little, M., McSharry, P., Hunter, E., Spielman, J., Ramig, L.: Suitability of dysphonia measurements for telemonitoring of parkinson’s disease. IEEE transactions on Biomedical Engineering 56(4) (2009) 1015–1022 [21] Arias-Londo˜ no, J.D., Godino-Llorente, J.I., S´aenz-Lech´on, N., OsmaRuiz, V., Castellanos-Dom´ınguez, G.: Automatic detection of pathological voices using complexity measures, noise parameters, and mel-cepstral coefficients. IEEE Transactions on biomedical engineering 58(2) (2011) 370–379 [22] Orozco-Arroyave, J., Arias-Londo˜ nno, J., Vargas-Bonilla, J., N¨oth, E.: Analysis of speech from people with parkinson’s disease through nonlinear dynamics. In: Lecture Notes in Computer Science. Volume 7911. (2013) 112–119 [23] Zicker, J., Tompkins, W., Rubow, R., Abbs, J.: A portable microprocessor-based biofeedback training device. IEEE transactions on Biomedical Engineering 27(9) (1980) 509–515 [24] Rubow, R., Swift, E.: A microcomputer-based wearable biofeedback device to improve transfer of treatment in parkinsonian dysarthria. Journal of Speech and Hearing Disorders 50 (1985) 178–185 [25] Ochs, L.A.: Self adjusting bio-feedback method and apparatus (1984)
56
Bibliography
[26] Dembowski, J., Watson, B.C.: An instrumented method for assessment and remediation of stuttering: A single-subject case study. Journal in fluency disorder, 16 (1991) 124–273 [27] AlMejrad, A.S.: Design of an intelligent system for speech monitoring and treatment of low and excessive vocal intensity. Artificial Life and Robotics 15(3) (October 2010) 320–324 [28] AB, S.: Voxlog - sonvox ab. http://www.sonvox.com/voxlog/ (2011) [29] Wirebrand, M.: Real-time monitoring of voice characteristics using accelerometer and microphone measurements. PhD thesis, Linkopings universitet (2011) [30] Carullo, A., Vallan, A., Astolfi, A.: Design Issues for a Portable Vocal Analyzer. IEEE Transactions on Instrumentation and Measurement 62(5) (May 2013) 1084–1093 [31] Grassberger, P., Procaccia, I.: Characterization of strange attractors. Phys. Rev. Lett. 50 (Jan 1983) 346–349 [32] Giovanni, A., Ouaknine, M., Triglia, J.M.: Determination of largest lyapunov exponents of vocal signal: Application to unilateral laryngeal paralysis. Journal of Voice 13(3) (1999) 341–354 [33] Resch, B., Nilsson, M., Ekman, A., Kleijn, W.B.: Estimation of the instantaneous pitch of speech. IEEE TRANSACTIONS ON AUDIO, SPEECH, AND LANGUAGE PROCESSING 15(3) (2007) 813–822 [34] Shahnaz, C., Zhu, W.P., Ahmad, M.: A new technique for the estimation of jitter and shimmer of voiced speech signal. In: Electrical and Computer Engineering, 2006. CCECE ’06. Canadian Conference on. (2006) 2112–2115 [35] Herzel, H., Berry, D., Titze, I.R.: Analysis of vocal disorders with methods from nonlinear dynamics. Journal of Speech and Hearing Research 37(2) (1994) 1008–1019 [36] Kantz, H., Schreiber, T.: Cambridge Press (2006)
Nonlinear Time Series Analysis. 2nd edn.
Bibliography
57
[37] Takens, F.: On the numerical determination of the dimension of an attractor. In: Lecture Notes in Mathematics. Volume 1125. (1985) 99– 106 [38] Kennel, M.B., Brown, R.: Determing embedded dimension for phasespace reconstruction using a geometrical construction. Physical review A 45(6) (1992) 3404–3411 [39] Jingqiu, K., Yibing, L., Zhiyong, M., Keguo, Y.: Improved algorithm of correlation dimension estimation and its application in fault diagnosis for industrial fan. In: Proceedings of the 25th Chinese Control Conference. (2006) 1291–1296 [40] Rosenstein, M.T., Collins, J.J., Luca, C.J.D.: A practical method for calculating largest lyapunov exponents from small data sets. Physica D 65(617) (1992) 117–134 [41] Oseledec, V.I.: A multiplicative ergodic theorem. lyapunov characteristic numbers for dynamical systems. Trans. Moscow Math. Soc 19(197) (1968) [42] Hardkernel: Odroid - hardkernel. http://www.hardkernel.com (2013) [43] Boersma, P., Weenik, D.: Praat: a system for doing phonetics by computer. report of the institute of phonetic sciences of the university of amsterdam. http://www.fon.hum.uva.nl/praat/ download_win.html (1996) [44] Chassaing, R., Reay, D.: Digital Signal Processing and Applications with the T M S320C6713 and T M S320C6416 DSK. 2nd edn. Wiley Interscience. United States of America (2008) [45] Langtangen, H.P.: Python Scripting for Computational Science. 3rd edn. Springer Publishing Company, Incorporated (2009) [46] Jones, E.: Introduction to scientific computing with python (2007) [47] docs, P.: multiprocessing process-based threading interface. http://docs.python.org/2/library/multiprocessing.html (2013) [48] docs, P.: Tkinter python interface http://docs.python.org/2/library/tkinter.html (2013)
to
tcl/tk
58
Bibliography
[49] Hunter, J., Dale, D., Firing, E., Droettboom, M.: Matplotlib release 1.2.1 user guide (2013) [50] Jiang, J., Yu, Z., Clancy, M.: Chaos in voice, from modeling to measurement. Journal of Voice (2006) 2–17 [51] J. Glover, V.L., Timoney, J.: Python for audio signal processing. Linux Audio Conference. National University of Ireland, Maynooth (2011)