International Journal of Chemical Engineering and Applications, Vol. 1, No. 4, December 2010 ISSN: 2010-0221
Design and Implementation of a Simulator for the Hydro Treating Reactor in RTO Development B. Baloochy1, S.Shokri2, M.Ahmadi Marvast3
Abstract—A computer aided tool is an important part of a real time optimizer. In this paper, a three phase reactor model for describing the hydro desulfurization reactions in a trickle bed reactor was developed. A steady state plug-flow heterogeneous one-dimensional model was employed to implement the HDS simulator. The reactor model considers the main reactions present in the hydro desulfurization process. Simulations were performed for a pilot trickle bed reactor, and the results are discussed in terms of variations with axial position of partial pressure and concentrations in liquid phase. The simulation results show a good agreement with the experimental data. Index Terms—Simulator, Trickle-bed, Reactor, RTO
I. INTRODUCTION Computer aided tools are nowadays a significant part of the engineering practice. The overall architecture of these tools depends on the type of the problem and, more importantly, on the phase where the tool assists the decision of the experts. In this work a computer-aided tool for the simulation and analysis of the HDS process is presented. Depending on whether the main mass-transfer resistance is located, three-phase catalytic fixed-bed reactors are operated either with a continuous gas and a distributed liquid phase (trickle operation), or with a distributed gas and a continuous liquid phase (bubble operation). Commercial HDS processes usually operate in a trickle-bed regime, with concurrent downward flow of gas and liquid over a randomly fixed bed of catalyst particles while reactions take place [1]–[4]. It is well known that sulfur removal is strongly inhibited by the competitive adsorption effect of H2S at the sulfided active sites of the catalyst. According to different authors [5]–[7], even low increases of H2S at the entrance of the reactor can substantially reduce hydro desulfurization (HDS) reaction rate. It is therefore mandatory to maintain the reaction under H2S concentration as low as possible by efficient removal of the H2S produced during the reaction. Most of the research for HDS process is about the conventional concurrent trickle-bed reactor (TBR) [8]–[17]. The main objective of this work is to design and implement a software for analysis and simulation of HDS reactions in a
concurrent trickle-bed reactor. The software was implemented by the using Borland C++ Builder compiler. II. MODELING OF TRICKLE-BED REACTOR OPERATIONS A. Mass balance To develop mass balance the following assumptions were considered: (1) The reactor operates in steady state condition. (2) Gas and liquid flows concurrently. (3) Gas and liquid velocities are constants through the reactor. (4) Constant density of gas and liquid phases. (5) There are not radial concentration and temperature gradients. (6) Catalyst activity does not change with time. (7) Vaporization and condensation of oil do not take place. (8) Constant pressure and temperature. (9) Chemical reactions take place only at the solid catalyst. (10) Mass resistance in the gas side of the gas–liquid interface is assumed to be negligible. Mass-balance equations in the TBR for concurrent operations are described with the following set of differential algebraic equations (DAEs): 0
(1) 0
(2) 0 (3) 0 (4)
0
(5) 0
(6) (7) 0 (8) Where aj is specific surface area at the interface j (cm-1), Cji is molar concentration of compound i in the j phase (mol.cm-3), uj is superficial velocity of j phase (cm.s-1), pji is partial pressure of compound i in the j phase (MPa), R is universal gas constant (J.mol-1.K-1), T is temperature (K), z is axial coordinate (cm), kji is mass-transfer coefficient of compound i at the interface j (cm.s-1), Hi is Henry’s law constant for compound i (MPa.cm3.mol-1), r is reaction rate 1 Behnam.Baloochi is with Research Institute of Petroleum Industries, (mol.g-3.s-1), η is catalyst effectiveness factor for HDS Tehran, Iran; (Corresponding author to provide phone: +98 21- 48253285; reaction and ρB is catalyst bulk density (g.cm-3). Superscript fax: +98 21- 44 73 97 13; e-mail:
[email protected]). 2 Saeid.Shokri is with Research Institute of Petroleum Industries, Tehran, G is gas phase; L is liquid phase or gas–liquid interface and S Iran; (e-mail:
[email protected]). is solid phase or liquid–solid interface. Subscript H2 is 3 Mahdi.Ahmadi Marvast is with Research Institute of Petroleum hydrogen; H2S is hydrogen sulfide and S is organic sulfur Industries, Tehran, Iran; (e-mail:
[email protected]). 287 0
International Journal of Chemical Engineering and Applications, Vol. 1, No. 4, December 2010 ISSN: 2010-0221
compound, solid phase or liquid–solid interface. All physical, thermodynamical and fluid properties are calculated using empirical correlations in the literatures [10].
TABLE 2. OPERATION AND REACTOR CONDITIONS
B. Reaction kinetics The oil fraction feedstock contains a great amount of organic sulfur compounds, and the overall HDS reaction is usually represented by the practical and widely accepted generalized stoichiometric equation, that lumps the HDS reaction of all of the sulfur compounds into one expression. HDS reaction rate was represented by a kinetic model of Langmuir–Hinshelwood type. The reaction rate equation is described with the following equation:
Value
Liquid superficial velocity (cm/s)
0.0175
Gas superficial velocity (cm/s)
0.28 3
.
.
Condition
H2 concentration in liquid feed (mol/cm )
0
Mole fraction of H2 in gas feed
1
Mole fraction of H2S in gas feed
0
Reactor pressure (psia)
768.712
Reactor Temperature (K)
653.15
Reactor length (cm)
32
(9)
Where p is reactor total pressure (MPa), yi is mole fraction of compound i, ρL is density at process conditions of liquid phase (g.cm-3), ML is average molecular weight of liquid feed (g.mol-1) and wS is weight percent of organic sulfur compounds in liquid feed. The DAEs with boundary conditions were then solved using a special compound method. This method contains both analytical and numerical part. We use Newton- Raphson method for numerical part. The final algorithm was implemented using Borland C++ Builder compiler. III. RESULTS AND DISCUSSION Simulations using the reactor model described in Section 2 were carried out. The feedstock and catalyst used for simulation were a VGO and a CoMo/Al2O3 commercial sample, which main properties are given in Table 1. Isothermal pilot reactor was simulated under the conditions reported in Table 2. TABLE 1 FEEDSTOCK, BED AND CATALYST PROPERTIES
Property
Value
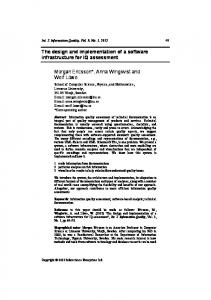
In the following, the experimental data and the simulation results are compared. Fig. 1 presents the steady state liquid molar concentration profiles of sulfur along the catalytic bed reactor. We can see from this figure that sulfur content in the liquid phase decreases through the reactor. 0.00004 0.000035 0.00003 Sulfur, mol/cm3
C. Model boundary conditions and solution Since the mathematical model is a system of DAEs with spatial coordinate as independent variable, it is necessary to define the following boundary conditions for the liquid and gas phases @ z = 0: . (10) . (11) 0 (12) (13) (14)
1348.47
API Gravity
22
Average molecular weight
441.9
Total sulfur weight percent
2.009
0.23
Equivalent particle diameter (cm)
0.254
Catalyst effectiveness factor
0.8
Catalyst bulk density (g/cm3)
0.8163
0.000015
0.000005 0 1 4 7 10 13 16 19 22 25 28 31
Exprimental Reactor Length Z, cm Data Simulation Results Fig. 1 Sulfur concentration profiles at steady state down through catalytic bed
Partial pressure and concentration profiles of H2 and H2S along the reactor when the steady state is reached are shown in Figs. 2 through 5, respectively. In all cases the overall shape of molar concentration profiles of H2 and H2S are determined by the balance between the reaction rate and mass transfer.
Catalyst and Reactor Bed Bed void fraction
0.00002
0.00001
Feedstock Mean average boiling point (Degree R)
0.000025
288
5.35
0.000004
5.3
0.000004
5.25
0.000003
Hydrogen Sulfide, mol/cm3
Partial Pressure of H2, MPa
International Journal of Chemical Engineering and Applications, Vol. 1, No. 4, December 2010 ISSN: 2010-0221
5.2 5.15 5.1 5.05 5
0.000003 0.000002 0.000002 0.000001 0.000001 0.000000
4.95
0 1 4 7 10 13 16 19 22 25 28 31
Exprimental Reactor Length Z, cm Data Simulation Results Fig. 2 H2 partial pressure profiles at steady state down through catalytic bed
1 4 7 10 13 16 19 22 25 28 31
Exprimental Data Reactor Length Z, cm Simulation Results Fig. 5 H2S concentration profiles at steady state down through catalytic bed
Partial Pressure of H2S, MPa
IV. CONCLUSION 0.01 0.009 0.008 0.007 0.006 0.005 0.004 0.003 0.002 0.001 0 1 4 7 10 13 16 19 22 25 28 31 Exprimental Data
Reactor Length Z, cm
Simulation Results
A trickle-bed reactor model was employed in this work to predict the behavior of pilot hydrotreating reactors in cocurrent modes of operation. The TBR model is one-dimensional plug-flow heterogeneous and includes the most important HDS reactions. Since hydrodesulfurization is strongly limited by hydrogen sulfide, the chemical reaction rate is expressed by a Langmuir-Hinshelwood formulation in terms of catalyst surface concentrations. A comparison of the tool results with experimental measurements verified its prediction accuracy. It has also been demonstrated that the user can exploit such a tool to easily create the kind of scenarios that are more applicable regarding all the simulation aspects. The tool implementation provided a variety of options. The trends revealed are consistent with the existing theory and experience, which also speaks for the overall behavior and accuracy of the tool.
Hydrogen, mol/cm3
Fig. 3 H2S partial pressure profiles at steady state down through catalytic bed
REFERENCES
0.00035
[1] [2] [3]
0.0003
[4]
0.00025
[5] [6]
0.0002
[7]
0.00015
[8]
0.0001
[9]
0.00005 0 1 3 5 7 9 111315171921232527293133 Exprimental Data Simulation Results
Reacter Length Z, cm
Fig. 4 H2 concentration profiles at steady state down through catalytic bed
[10] [11] [12] [13] [14] [15] [16] [17]
289
A. Montagna, Y.T. Shah, Chem. Eng. J. 1975, 10, 99-105. C.N. Satterfield, AIChE J. 1975, 21, 209. M.H. Al-Dahhan, F. Larachi, M.P. Dudukovic, A. Laurent, Ind. Eng. Chem. Res. 1997, 36, 3292. A. Kundu, K.D.P. Nigam, A.M. Duquenne, H. Delmas, Rev. Chem. Eng. 2003, 19 531. D.C. McCulloch, Appl. Ind. Catal. 1983, 1, 69. B.C. Gates, J.R. Katzer, G.C.A. Schuit, Chemistry of Catalytic Processes, third ed., McGraw-Hill, New York, 1979. T. Kabe, Y. Aoyama, D. Wang, A. Ishihara, W.H. Qian, M. Hosoya, Q. Zhang, App. Catal. A Gen. 2001, 209, 237. E. Pedernera, R. Reimert, N.L. Nguyen, V. van Buren, Catal. Today 2003, 79-80, 371. G.F. Froment, G.A. Depauw, V. Vanrysselberghe, Ind. Eng. Chem. Res. 1994, 33, 2975. H. Korsten, U. Hoffmann, AIChE J. 1996, 42, 1350. R. Lopez, C.G. Dassori, SPE 69499, 2001. M. Bhaskar, G. Valavarasu, A. Meenakshisundaram, K.S. Balaraman, Pet. Sci. Technol. 2002, 20, 251. R. Chowdhury, E. Pedernera, R. Reimert, AIChE J. 2002, 48, 126. D.G. Avraam, I.A. Vasalos, Catal. Today 2003,79-80, 275. M.A. Rodrı´guez, J. Ancheyta, Energy Fuels 2004, 18, 789. F.S. Mederos, M.A. Rodrı´guez, J. Ancheyta, E. Arce, Energy Fuels 2006, 20, 936. C. Murali, K.V. Ravi, N. Ravichander, D.T. Gokak, N.V. Choudary, Fuel 2007, 86, 1176.