energies Article
Design and Implementation of Novel Multi-Converter-Based Unified Power Quality Conditioner for Low-Voltage High-Current Distribution System Bin Yang, Kangli Liu , Sen Zhang and Jianfeng Zhao * School of Electrical Engineering, Southeast University, Nanjing 210096, China;
[email protected] (B.Y.);
[email protected] (K.L.);
[email protected] (S.Z.) * Correspondence:
[email protected]; Tel.: +86-13951943657 Received: 30 September 2018; Accepted: 11 November 2018; Published: 14 November 2018
Abstract: This paper introduces a novel multi-converter-based unified power quality conditioner (MCB-UPQC). Three optimization methods are proposed based on the traditional UPQC: (1) The shunt converter is substituted with multi-modular parallel converters. Hence, the reactive power and harmonic currents can be increased greatly, which are suitable for low-voltage high-current distribution systems. (2) The series converters consist of three H-bridge inverters, and each of the H-bridge inverters is controlled separately. The control strategy is easier to achieve and can improve the control performance of voltage regulation under unbalanced voltage sag or swell. (3) A three-phase four-leg (3P4L) converter is connected to the common DC bus of the proposed UPQC to connect the renewable energy and energy storage system. The detailed mathematical models of shunt and series converters are analyzed, respectively. A multi-proportional resonant (PR) controller is presented in the voltage regulation and reactive power compensation control algorithms. The simulation results verify the feasibility of the control algorithms. Finally, the experimental platform is established, and the experimental results are presented to verify the validity and superiority of the proposed topology and algorithms. Keywords: unified power quality conditioner; harmonic current compensation; power quality; renewable energy; voltage regulation
1. Introduction 1.1. Motivation The power system has greatly evolved and has been popularized since the 21st Century [1]. The characteristics of the power system have also changed. With the development of science and technology, the electronic loads have increased largely [2]. A great amount of harmonic loads has been employed in the manufacturing industry, entertainment centers and financial enterprises, which can inject plenty of harmonic currents into the grid [3–5]. Furthermore, large numbers of single-phase loads are connected to the distribution system [6]. Therefore, the unbalanced voltage is generated by an unreasonable connection [7–9]. Under this circumstance, the power quality is greatly affected and deteriorated. Reasonable governance measures should be taken to improve the power quality. With the growing severity of the energy crisis, renewable energy sources (RES) have attracted much attention in recent years [10]. The proportion of RES to the overall electricity power in the world has increased from 5–20% from 2012–2016 in China [11]. However, the utilization of renewable energy depends on the proportion that is interconnected with the power system. As a result, improving the power
Energies 2018, 11, 3150; doi:10.3390/en11113150
www.mdpi.com/journal/energies
Energies 2018, 11, 3150
2 of 21
quality and improving the absorptive capacity of renewable energy have become quite significant issues nowadays. Due to the technological advancements in power electronics, the power quality has the opportunity to be greatly improved by power electronic devices [12,13]. The static var compensator (SVC), static var generator (SVG), active power filters (APF) and static synchronous compensator (STATCOM) can be used to filter out harmonics in the power system and compensate the reactive power [14–16]. The dynamic voltage regulator (DVR) can compensate the voltage sag or swell [17,18]. However, these power electronic devices can only improve the power quality partially. The unified power quality conditioner (UPQC) composed of shunt and series back to back converters is the combination of all the devices mentioned above [19]. 1.2. Literature Review Many scholars have conducted extensive research on UPQC. In [20], a two-stage algorithm was proposed to select the minimum ratings of the shunt converter and series converter of the UPQC in order to obtain the maximum utilization rates of the power converters in the UPQC. The work in [21] introduced a UPQC without series transformers, controlled by algorithms based on the active and non-active currents together with PLL circuits. In [22], a single-phase unified power quality conditioner based on the modular multilevel matrix converter (M3C) was presented. The M3C-UPQC is comprised of four identical multilevel converter arms and associated filtering inductors. In [23], the phenomena of the variation in the rating of the UPQC system with the variation in displacement angle between source and load voltages had been studied by formulating the generalized VA loading equations of UPQC systems. The research on UPQC has mainly focused on the control algorithms and topologies for the moment. However, most of the literature only analyzed and optimized the algorithms unilaterally and has not presented an overall control method for UPQC. Moreover, although the topologies of UPQC are optimized and proposed in great quantity, researchers have seldom performed the analysis of the specific applications and detailed experimental verifications of the proposed topologies. In [24], a new reduced switch UPQC system topology that comprises ten switches was proposed. Although a carrier-based double-zero sequence injection scheme was developed to maintain the linear modulation range and uniform switching frequency, the control algorithm had not been presented clearly. The work in [25] presented a current source unified power quality conditioner (CS-UPQC). A fault current limiting scheme was also presented, which limited the fault current effectively by utilizing the large DC link inductor of the CS-UPQC. However, there was no experimental verification in the paper to verify the topology and control method. 1.3. Contribution and Paper Structure On account of the situation mentioned above, a multi-converter-based (MCB)-UPQC is proposed in this paper. To increase the compensating current of UPQC, the structure of the traditional UPQC is optimized in this paper. The shunt converter is replaced by three converters connected in parallel both on the AC and DC side. Therefore, the compensation current and power are triple that previously achieved. The series converter of each phase is constituted by an H-bridge. The parallel converters and H-bridge are back to back connected to a common DC bus. Furthermore, a three-phase four-leg (3P4L) converter is connected to the common DC bus. As a result, the renewable energy interface is provided by the output of the 3P4L converter. With the help of the DC bus and the renewable energy interface, the renewable DC and AC sources can be connected to the grid through the proposed UPQC. Compared with the UPQC mentioned before, the MCB-UPQC has the following features: (1) A multi-converter connected in parallel is introduced in the shunt converter. (2) The series converters are connected to the load without the series transformer independently in each phase. (3) The renewable energy interface of the MCB-UPQC can connect the microgrid and energy storage system. Benefiting from these characteristics, the control algorithms of the proposed MCB-UPQC are simpler than before,
Energies 2018, 11, 3150
3 of 21
and the difficulty of the hardware implementation is reduced. The MCB-UPQC has a wider application in distribution systems and microgrids. This paper gives a comprehensive analysis of the proposed MCB-UPQC, which is designed for a low-voltage high-current distribution system. The topology, control strategy, parameters and hardware design of the proposed UPQC are presented. Additionally, a prototype is built for verification. Finally, simulation and experimental results prove the correctness of the topology and the control strategy of the proposed UPQC. 2. System Description The topology of the UPQC is shown in Figure 1. It consists of the following parts: three shunt converters, three series H-bridge converters and a renewable energy interface. As shown in Figure 1, three identical converters (Converters 1, 2 and 3) are shunt connected to the distribution system by a three-winding transformer. The structure of the converters is parallel both on the AC and DC side. Besides, if the power rate or current level is still insufficient, the number of converters can be increased to benefit from the parallel structure without changing the hardware structure. However, the following steps are required when introducing more converters: (1) The parameters of the control algorithms in shunt converters should be altered with the number of converters. (2) A greater communication line is needed between the controller and converters. The series converters consist of three H-bridge inverters (H-bridges A, B and C). The output of each H-bridge is connected to the grid in series using inductor and capacitor (LC) filters. The renewable energy interface is comprised of a 3P4L inverter. This provides a DC interface (Udc ) for the DC sources or DC loads and an AC interface (u a , ub , uc , Nu ) for the AC sources. Furthermore, the 3P4L inverter can connect AC or DC loads directly. ea , eb , ec are the main power transmission interfaces for the LV AC distributed network. Usa
uea
ea
Usb Usc
ueb
eb ec
Input
uec uga
H-bridge A H-bridge B H-bridge C
ugb ugc
Output
Cf
Lf
Shunt converters Converter 3 Converter 2 Converter 1
Lg
Lf1
Lf2
Lf1 Cfe 800 V DC bus
+
-
ua ub uc N
Renewable energy interface
Figure 1. Topology of the proposed multi-converter parallel-based UPQC.
In conclusion, compared with the traditional UPQC, the following advantages can be observed in the proposed novel UPQC as: • • •
Due to the parallel structure, the control algorithms of each converter are easier than for the cascade converter or multilevel module converter (MMC). The power rate and compensation current are promoted. Renewable energy and microgrid absorptive capabilities are achieved by the common DC bus and renewable energy interface.
Energies 2018, 11, 3150
4 of 21
3. Control Algorithms of UPQC The control strategy is the key to the UPQC, and the performance of the controller will affect the equipment stability. Therefore, the most important procedure for debugging the prototype is accurately designing the control strategy. The control algorithms of the converter in the UPQC are discussed in this section. The control algorithms of the shunt converter, the series converter and the renewable energy interface are analyzed in detail in the following subsection. 3.1. Control Algorithm of Series Converters The function of the series converters is to regulate the load voltage. By controlling the output voltage, the series converters can dynamically compensate the output voltage of the UPQC dynamically. Since the structure of the series converter in each phase is the same, the control algorithm of each converter is identical. Figure 2 shows the equivalent diagram of the series converter in Phase A. +
Rf
Lf iLa
H-bridge Vsa inverter
Cf
uea
ia
+ -
uca
R
ea
ica
Figure 2. Equivalent diagram of H-bridge A in series converters.
In Figure 2, Vsa is the switch side voltage of the converter, uea is the grid voltage, i a is the current in Phase A, C f and uca are the capacitance and voltage of the filter capacitor, respectively, and L f and i La are the inductance and current of the filter inductor, respectively. The mathematical model of the structure can be derived as Equation (1):
"
d i La dt uca
#
1 C = f
" # V −u −R i sa ca f La 1 i La − i a Lf
(1)
The open loop transfer function diagram of the control object of the series converters is shown in Figure 3.
ia Vsa +
iLa 1 + Lf s + Rf
1 Cf
uca
Figure 3. Control object structure diagram of H-bridge A.
Thus, the open loop transfer function can be written as: G0 (s) =
Cf Lf
s2
1 + Rf Cf s + 1
(2)
Based on the analysis above, the proposed control algorithm of series converters is shown in Figure 4.
Energies 2018, 11, 3150
uea
5 of 21
PLL
F1
G1(s)
Detection section
Varef +
ia -
-
Vcaref +
+-
Vrms
K
+
GL(s)
GC(s)
+
uca
ica
Control section
Figure 4. The proposed control algorithm of series converters.
The control algorithm is divided into two sections, the reference voltage of the capacitor is calculated in the detection section. A simplified calculation method is proposed in the detection section. Firstly, a αβ coordinate is constructed using an all-pass filter. After the phase locking loop, the reference voltage can be calculated with F1 and Vrms . Equation (3) is the transfer function of the all-pass filter. G1 (s) =
ωf − s ωf + s
(3)
where ω f = 2π f = 100π, and F1 is calculated in Equation (4): √ Vare f = 2 cos θVrms √ √ 2 6 Vbre f = (− cos θ + sin θ )Vrms F1 : 2 2 √ √ 2 6 Vcre f = (− cos θ − sin θ )Vrms 2 2
(4)
Vrms = 220 is the root mean square of the output voltage. The simulation result of the detection section is shown in Figure 5. Before 0.05 s, the grid voltage sag is 25%, and between 0.05 s and 0.1 s, the grid voltage sag is zero. However, between 0.1 s and 0.15 s, the grid voltage increases by 25%. As shown in the waveform, the detection section can precisely track the phase of the grid voltage and rapidly calculate the value of the compensation voltage. 400 300
voltage/V
200 100
0 -100 -200
uea Varef Vcaref
-300 -400
0
0.05
0.1
Time/ (s)
0.15
Figure 5. Simulation result of the detection section in the series converter.
Typically, a proportional resonant (PR) controller is used to control AC signals instead of a PI controller, since a PR controller has zero state error for AC signals. The transfer function of a normal PR controller is shown in Equation (5). G pr (s) = K p +
s2
Kr s + ω0 s
(5)
It has an infinite gain at resonant frequency. However, the bandwidth of the controller is too small for digital realization. In the control section, a quasi-PR controller (q-PRc) is adopted. The bandwidth of the controller is increased, which means the stability of system is improved. Furthermore, it is necessary to suppress the selected order harmonic voltage to improve the power quality. A multi
Energies 2018, 11, 3150
6 of 21
q-PRc is adopted at the selected order resonant frequency. The transfer function can be written as Equation (6): q
G pr (s) = K p +
∑
s2
n=1,3,5...
2Kr ωc s + 2ωc s + (nω0 )2
(6)
Figure 6 shows the Bode diagram of the PR controller. Compared with a PR controller, the bandwidth at resonant frequency of the q-PRc is much wider. Parameters of controller are given as follows: K p = 0.25, Kr = 1000, ωc = 5, ω0 = 100π. Bode Diagram
160
Magnitude (dB)
140 120 100
80 60 40 20
Fund (50Hz)
3th (150Hz)
5th (250Hz)
7th (350Hz)
0 -20
-40
Phase (deg)
90
45
0
-45
-90 101
102
103
Frequency (Hz)
Figure 6. Bode diagram of the controller of series converters.
The eigenvalue and time-delay analysis should be considered in designing the controller [26]. However, the time-delay analysis and discretization are neglected due to the content and length of this paper. 3.2. Control Algorithm of Shunt Converters Parallel converters have good characteristics with a higher power level and a higher conversion efficiency, which is far more flexible than a single converter. However, the L g , R g variations may result in interactions between converters, in which the circulating current is one of their major concerns. The circulating current will lead to current distortion and output harmonics in parallel converters. To overcome this problem, the circulating current-suppressing method should be considered in the control algorithms [27]. In this paper, we assume that the filters of each converter are identical; therefore, the circulating current is ignored. The equivalent diagram of a shunt converter is shown in Figure 7. The functions of the shunt converter include controlling the DC side voltage, reactive power compensation and harmonic current suppression. To achieve these functions, the controller should be designed appropriately. When designing the traditional double closed loop of a shunt converter, a complex calculation process, multi-coordinate transformation and decoupling control are involved. These steps increase the difficulty of converter control. In this paper, a two degrees of freedom (TDF) quasi-PR controller is proposed to control the shunt converter.
Energies 2018, 11, 3150
7 of 21
ueb
ia ib
uec
ic
uea
usa isa usb isb usc isc
ea eb ec
uga iga Lg ugb igb
iL
Rg Cg
udc
ugc igc Converter 1 Converter 2 Converter 3
Figure 7. Equivalent diagram of shunt converters.
Converter 1 is analyzed as an example. i ga , i gb and i gc are the phase currents of the converter; u ga , u gb and u gc are the phase voltages of the converter; i a , ib and ic are the load currents of the main winding. Equation (7) is the mathematical model in the synchronous rotating frame (SRF). dudc C dt = ∑ i gk sk − i L k = a,b,c di 1 gk + Ri gk = u gk − udc (sk − ∑ s) L dt 3 j= a,b,c j
(7)
To establish the TDF control strategy, Equation (7) can be derived into the αβ coordinate as: dudc C = ∑ i gk sk − i L dt k =α,β di gα (8) + Ri gα = u gα − udc sα L dt di gβ + Ri gβ = u gβ − udc s β L dt Let vα = udc sα , v β = udc s β , and as Section 3.1 shows, the current control loop can use the q-PR controller. The control equations of the shunt converters under the proposed TDF are shown in Equation (9): ( q vα = − G pr (s)(iα∗ − i g α) + u gα (9) q v β = − G pr (s)(i∗β − i g β) + u gβ Furthermore, a current component should be added into the current loop for the purpose of reactive power compensation and harmonic current suppression. The detection section and control section are shown in Figure 8.
Energies 2018, 11, 3150
ia ib ic
Harmonic detection
8 of 21
iah ibh ich
iga igb igc
uga ugb ugc
iq
Detection section
+
PI
id
iq/3
++
+-
+ +
+
PR
PR -
-
va vb vc
+
PWM
+ Control section
Figure 8. Control algorithm of the shunt converter. PR, proportional resonant controller.
In Figure 8, iq is the reactive current of the load current, while iαh and i βh are the harmonic currents of the load current. The current common harmonic current detection method is the instantaneous reactive power algorithm. The harmonic current detection algorithms presented in this paper are optimized based on it, as shown in Figure 9.
uea
PLL
ia ib ic
sinωt cosωt
id Tabc-dq0 iq
id -1 Tabc-dq0
Low pass filter
iq
iaf+ ibf+ + icf+
iahibhich-
+ +
Figure 9. Harmonic detection algorithm.
A PI controller is adapted to control the DC side voltage. Since there are three shunt converters, the current added into the current loop should be divided by three in each converter. Compared with the double closed loop of the PI controller, the proposed algorithm is simpler, and fewer calculations are required. To verify the stability of the controller and appropriateness of the design parameters, the open loop transfer function of the current control loop is shown in Equation (10): G (s) =
K p (s2 + ωe2 ) + Ki s (s2 + ωe2 )(sL + R L )
(10)
Figure 10 shows the root locus diagram of Equation (10). The q-PR controller has similar system stability as the PI controller. According to Figure 10, the values of k p and k i are easy to set. In this paper, the parameters of the q-PR controller are :K p = 4, Ki = 800.
Energies 2018, 11, 3150
9 of 21
Pole-Zero Map 400
Imaginary Axis (seconds -1)
300
Open-loop pole Open-loop zero Closed-loop pole
200
Ki / 2Kp
we = 100π
100 0
R/L
-100
we = 100π
-200
Ki / 2Kp
-300
-400 -800
-700
-600
-500
-400
-300
Real Axis (seconds-1 )
-200
-100
0
Figure 10. Root locus diagram of the current loop in the shunt converter.
In the actual operation process of the three-phase converter, the parameters of the filters will change with the environment. These changes will bring greater perturbation to the control system. Therefore, it is necessary to consider the influence of robustness under the fluctuation of the parameters. The bode diagram of the control system transfer function under parameter fluctuation is shown in Figure 11. Bode Diagram
Magnitude(dB)
80
Lf = 1mH Lf = 2mH Lf = 3mH Lf = 4mH Lf = 5mH
60 40 20 0
Phase(deg)
-20 45 0
-45 -90
-135
-180 10-1
100
101
102
103
Frequency (Hz)
Figure 11. Frequency response considering parameter variation of the filter.
With the variation of the filter inductance in the shunt converter, the controller has a great gain at the resonant frequency point, which is 50 Hz. The designed control algorithms can adapt to parameter perturbation in a wide range; therefore, the effect of parameters fluctuation on system stability is effectively suppressed. The proposed control algorithms have a strong robustness. 3.3. Control Algorithm of the Renewable Energy Interface As mentioned above, the renewable energy interface is comprised of a three-phase four-leg inverter, which is connected to the common DC bus. In this subsection, a control algorithm based
Energies 2018, 11, 3150
10 of 21
on the virtual synchronous generator (renewable energy interface) of the 3P4L inverter is presented. By simulating frequency regulation, voltage control, interference and excitation in the renewable energy interface, the control strategy can solve the difficulty of regulating the voltage and current when connecting to the renewable energy. Furthermore, we improve the control strategy of the renewable energy interface by introducing the voltage and current loop to increase the dynamic performance. Figure 12 shows the control algorithm of the proposed strategy.
S1
S3
S5
S7
Uca,b,c
Lf1
Lf2
Ea Udc
ua,b,c,n
Eb
Ce
Ec S2
S4
S6
En S8
Cfe iLa,b,c
Za,b,c
Figure 12. Schematic of the 3P4L inverter.
The renewable energy interface can correspond to a synchronous generator [28,29]. According to the features of synchronous generators [30], the control algorithm can be easily designed. Equation (11) shows the relationship between the active power, frequency, reactive power and voltage. dω P + D p (ωre f − ω ) − P = Jωre f re f dt dE (11) Qre f + Dq (Ure f − U ) − Q = K dt θ = R ωdt where Pre f , Qre f , P and Q are the reference active power, reference reactive power, actual active power and actual reactive power, respectively. D p and Dq are the droop coefficients of power. ωre f is rated angular frequency, while ω is actual angular frequency. E is the RMS voltage of the bridge arm. θ is the phase of the grid voltage. From Equation (11), the three main control algorithms of VSG are presented in Figure 11. Figure 13a shows the active power control algorithm; Figure 13b shows the reactive power control algorithm; and Figure 13c shows the frequency and phase synchronous control algorithm of the renewable energy interface.
-+
-+ ++
-
++
-
(a) active power control algorithm ua 0 ub abc ++ uc PI -+ dq
(b) reactive power control algorithm 0 dq vcq -+ abc
PI
vca vcb vcc (c) frequency and phase synchronous control algorithm Figure 13. Control algorithm of the renewable energy interface: (a) active power control algorithm; (b) reactive power control algorithm; (c) frequency and phase synchronous control algorithm.
Energies 2018, 11, 3150
11 of 21
To increase the output dynamic stability of the renewable energy interface, a double closed voltage and current loop is used in the control strategy. Furthermore, a 3D-SVPWM strategy is used for the 3P4L converter. There are 16 switch states of eight switches in the converter, in which 16 effective switch vectors are constituted. Let pmean that the top IGBTs of each bridge arm are open and the bottom IGBTs are closed; nmeans that the top IGBTs are closed and the bottom IGBTs are open. In the αβγ coordinate system, a hexagon column can be constructed as shown in Figure 14.
pppn ppnn nppn pnpn
npnn
pnnn nnpn
γ
β
pppp nnnn
γ=0 nppp
ppnp npnp
α
pnpp pnnp
nnpp nnnp Figure 14. Vector diagram of 3D-SVPWM switch state.
Based on the research mentioned above, the whole control diagram of the 3P4L converter in the renewable energy interface is shown in Figure 15. E
Reative power controller
vca vcb vcc Ative power controller
abc
PI
+
+
-
-
dq0
Frequency and phase synchronous controller
vd
3D
iLq
-
+
PI
vc0 0
-
+
wL
vcq 0
PI
iLd wC
θ
wcomp
-
+
vcd
-
+
-
++
+
PI
++
vq
PI
-+
v0
SVPWM
iL0 PI
-
+
Figure 15. Control structure of the renewable energy interface.
The reactive power controller, active power controller and frequency and phase synchronous controller are presented in Figure 11. With the proposed control algorithms in the renewable energy interface, the following functions can be implemented: (1) The renewable energy interface can connect AC loads directly; (2) The renewable energy can be connected to the grid by the proposed UPQC.
Energies 2018, 11, 3150
12 of 21
Compared with the traditional PI control methods of UPQC, the proposed control algorithms of MCB-UPQC based on the PR controller are divided into three parts, and each of the controllers is independent. The proposed q-PRc is easier to implement and more stable. Plenty of calculations of the coordinate transformation are removed for digital processing. Renewable energy connection is achieved by the control algorithms of the renewable energy interface. 4. Simulation and Experimental Verification 4.1. Simulation Results In this section, a series of simulations is performed to verify the performance of the proposed UPQC. The simulations are carried out using MATLAB/Simulink. The parameters of the simulation model are shown in Table 1. Table 1. Parameters of the filter. Parameters
Label
Value
Unit
Filter inductance of the shunt converter DC capacitor in each shunt converter Filter inductance of the H-bridge Filter capacitor of the H-bridge Filter inductance of the switch side in the 3P4L converter Filter inductance of the grid side in the 3P4L converter Filter capacitor of the 3P4L converter Voltage of the common DC bus Proportional integral parameter Proportional integral parameter
Lg Cg Lf Cf Lf1 Lf2 Cfe Udc Kp Ki
2 4400 0.2 400 3.2 0.8 10 800 4 800
mH µF mH µF mH mH µF V / /
The factors affecting the design parameters of the filter include the power level, rated voltage, rated current, switch frequency and volume and heat dispersion of the prototype. Considering these factors and the design equation in [31], the filter parameters in the proposed UPQC are as shown in Table 1. Figure 16 shows the simulation results of the shunt converter. At 0.1 s, the proposed control algorithm is used, and with the help of q-PRc, the voltage of DC side can be regulated to the reference value rapidly. Furthermore, the output current, which is aiming to compensate the reactive power, is switch on at 0.2 s.
udc
800 600 400 200 0 200
Current/ (A)
Voltage/ (V)
1000
iga, igb, igc
100 0
-100
-200
0
0.05
0.1
0.15
0.2
0.25
0.3
Time/ (s) Figure 16. Simulation results of DC side voltage and reactive power compensation in the shunt converters.
Energies 2018, 11, 3150
13 of 21
To verify the prompt response to the reactive power, Figure 17 shows the difference between the reference current and actual values, and the results show that the shunt converter has a good performance in compensating the reactive power.
Current/ (A)
100
iqref
50
iq
0
-50
-100 0
0.01
0.02
0.04
0.03
0.05
0.06
0.07
0.08
Time/ (s) Figure 17. Simulation results of the difference between the reference current and actual values.
Figure 18 presents the simulation results of reactive power compensation and power factor correction. Before 0.1 s, the phase of the input voltage is ahead of the current. After 0.1 s, the shunt converters start to compensate the reactive power of the gird. The results show that the converters can compensate the reactive power within 0.02 s. The power factor of the grid is corrected to around 0.99. The performance of the controller is reasonable.
isa 0
0.02
Usa
Output current(50A/div) Input voltage(300V/div)
Input current(50A/div) Input voltage(300V/div)
Usa
iga
0
0.04
0.06
0.08
0.1 0.12 Time/ (s)
0.14
0.16
0.18
0.2
0.02
0.04
0.08
0.1
0.12
0.14
0.16
0.18
0.2
Time/ (s)
100
1.2 1.1
isa ,isb ,isc 50
Power factor
Input current(50A/div)
0.06
(b)input voltage and output current in phase A
(a)input voltage and input current in phase A
0
1 0.9
0.8 0.7
-50
0.6
-100 0.02
0.04
0.06
0.08
0.1
0.12
Time/ (s)
0.14
(c)input current of the grid
0.16
0.18
0.2
0.5 0.02
0.04
0.06
0.08
0.1
0.12
0.14
0.16
0.18
Time/ (s)
(d)power factor of the grid
Figure 18. Simulation results of reactive power compensation and power factor correction. (a) Input voltage and input current in Phase A; (b) input voltage and output current in Phase A; (c) input current of the grid; (d) power factor of the grid.
Figure 19 shows the voltage regulation ability of the series converter. The input voltage has a sag of 20% between 0.15 s and 0.18 s and of 100% between 0.12 s and 0.16 s. The results verify that the control algorithms proposed have a good performance in the voltage regulation.
0.2
Energies 2018, 11, 3150
Voltage/ (V)
14 of 21
500
uea, ueb, uec
0
Voltage/ (V)
-500 0
0.04
0.06
0.08
0.1
0.12
0.14
0.16
0.18
0.14
0.16
0.18
uca, ucb, ucc
0
-500 0
Voltage/ (V)
0.02
500
0.02
0.04
0.06
0.08
0.1
0.12
ea, eb, ec
500 0
-500 0
0.02
0.04
0.06
0.08
0.1
0.12
0.14
0.16
0.18
Time/ (s)
Figure 19. Dynamic voltage compensation simulation results of the series converter.
Figure 20 is the dynamic synchronizing process of the microgrid interface. After 0.3 s, the output voltage of the renewable energy interface is the same as the grid voltage in the amplitude and phase. The results show that the renewable energy interface can connect to the grid within 0.3 s.
Δu/ (V)
Δw/ (rad/s) voltage/ (V)
400 200 0 -200 -400 40 20 0 -20 -40 5
uinverter ugrid
0 -5 0.1
0.15
0.2
0.25
Time/ (s)
0.3
0.35
0.4
Figure 20. The dynamic synchronizing process of the renewable energy interface.
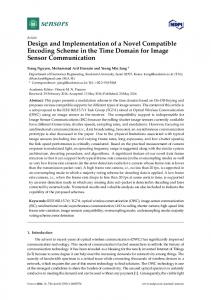
4.2. Experimental Results In order to verify the correction of the proposed topology and control algorithms of UPQC, a 200-kVA platform of the proposed UPQC was designed and built. The structure of UPQC and the hardware in each module was exactly identical to Figure 1. The experimental platform of the proposed UPQC is shown in Figure 21. The control system adopted a master-slave structure. A TI 28346 DSP and FPGA were used in the master controller to achieve the communication between the converters and protection control. The IGBT and switches in each converter were controlled by the slave controller with a 28335 DSP. The switch frequency was 10k Hz in shunt converters and 15k Hz in series converters.
Energies 2018, 11, 3150
15 of 21
3.voltage regulator
2.converters
1.computers
4.filters
5.oscilloscope
Figure 21. Experimental platform of the proposed UPQC.
The filters consisted of the filter inductance of the shunt converters and the inductor, capacitor and inductor (LCL)filters of the series converters. Each back to back module consisted of a shunt converter and an H-bridge converter. The control circuits were assembled in the modules. The voltage regulator could adjust the input voltage to create the voltage sag or swell. 4.2.1. Experimental Results of Shunt Converters Figure 22a shows the DC side voltage waveforms in each shunt converter. t1 is the time bypassing the current-limiting resistance. t2 is the time initiating the PWM rectification based on the multi q-PR controller. The results show that within 50 ms, the DC voltage could be regulated to the reference value of 800 V. ugab, ugbc
Voltage (100V/div)
udc usab, usbc t2
t1
iga, igb, igc
t1
Time (3s/div)
t2
Time (3s/div)
Time (10ms/div)
(a)Experimental waveforms of common DC bus
(b)Reactive power compensation of shunt converter
Figure 22. Experimental results of the shunt converters: (a) Experimental waveforms of the common DC bus; (b) Reactive power compensation of the shunt converter.
Figure 22b shows the steady state and transient state of the reactive power compensation of the shunt converter. As shown in Figure 7, u gab and u gbc are the line voltages of the shunt converter; udc is the DC side voltage of the shunt converter; usab , usbc are the line voltages of the input voltage; i ga , i gb and i gc are the phase currents of the shunt converter. t1 is the time at which the PWM rectification is initiated, and t2 is the time at which the compensation is initiated. The experimental results verify that: •
Udc was stable during the compensation.
Energies 2018, 11, 3150
• •
16 of 21
The converter had a perfect var control ability according to the compensation current detected. Benefiting from the three shunt converters, the compensation power increased to three-times that of one converter.
Figure 23 shows the harmonic compensation of the shunt converter. The experimental results in (a) and (b) verify that the control algorithm based on q-PRc had a decent performance in terms of compensating the harmonic current. Compared with (c) and (d), the total harmonic distortion of the input current (THDi)after compensation was 3.8%, which is compliant with the standards.
Current (50A/div)
Compensation current: iga
Grid current: isa
Load current: ia Time (4ms/div)
Time (10ms/div)
(a) compensation and grid current waveform
(b) compensation and load current waveform
THDi: 3.8%
THDi: 26.2%
(c) THD before compensation
(d) THD after compensation
Figure 23. Harmonic compensation waveforms: (a) compensation and grid current waveform; (b) compensation and road current waveform; (c) THDbefore compensation; (d) THD after compensation.
4.2.2. Experimental Results of Series Converters To regulate the output voltage of the proposed UPQC, a control algorithm based on q-PRc was proposed in Figure 24. t1
t2
t3
t4
Time (2s/div)
uea (200V/div) uca (100V/div) ea (500V/div) ia (20A/div) Time (20ms/div)
Figure 24. Voltage regulation waveform of the series converters.
Energies 2018, 11, 3150
17 of 21
The experimental results are shown in Figure 24. The grid voltage decreased 10% at t1 and t2 , respectively, and increased 10% at t3 and t4 . Furthermore, the output voltage of the proposed UPQC ea , eb and ec remained stable. Although the shunt and series converters are controlled separately, the compensation ability when the current and voltage compensation are operating at the same time should be verified. Figure 25 shows the experimental results under the condition that the current and voltage compensation are both activated.
Grid voltage Load voltage Compensation current
Compensation voltage
t1
Time (2s/div)
t2
Time (50ms/div) Figure 25. Experimental result of the compensation module.
The grid voltage had a 10% sag both at t1 and t2 . The compensation current was stable the whole time. Additionally, the load voltage was stable due to the compensation of the H-bridge converters. 4.2.3. Experimental Results of the Renewable Energy Interface Figure 26 is the experimental results of the dynamic synchronization process of the renewable energy interface.
Vgrid
Vinverter
Figure 26. Dynamic synchronization process of renewable energy interface.
Vg rid is the voltage of renewable energy; Vi nverter is the output voltage of the renewable energy interface. After the action of the synchronous controller, the inverter voltage tracks the grid voltage gradually. After eight cycles, the frequency, phase and amplitude accuracy reached the requirements. The inverter voltage and the grid voltage coincided, and the interface was connected to the renewable energy sources.
Energies 2018, 11, 3150
18 of 21
Figure 27 shows the experimental waveforms of renewable energy interface in off-grid mode. The results verify that the transient state and steady state of inverter were quite stable.
Output voltage of inverter
Output voltage of inverter
Load current
Load current
Time (1s/div)
Time (1s/div)
Time (10ms/div)
Time (10ms/div)
(a) initiate inverter program
(a) load switch on
Figure 27. Off-grid mode waveforms: (a) initiate inverter program; (b) load switching on.
Figure 28 shows the whole process of switching the operation mode from grid-connection to off-grid.
Grid voltage
Inverter current Grid current t1
t2
t3
Figure 28. Grid-connection and off-grid switchover waveforms.
The load was switched on at t1 , and the power of load was supplied by the grid, which was 6 kW. At t2 , the output power of the renewable energy interface was set to 3 kW. The power of the load was supplied by both the grid and the renewable energy interface. At t3 , the output power of the renewable energy interface was set to 6 kW, and the waveforms showed that the power was supplied by the inverter since the grid current was 0 A. 5. Discussion The objective of this paper is to introduce a novel MCB-UPQC for a low-voltage high-current distribution system and a microgrid. To evaluate the topology and control algorithms of the MCB-UPQC, both the simulation and experimental results are presented. The software and hardware design of the proposed MCB-UPQC are analyzed and implemented. Although there are many switches and filters in the MCB-UPQC, structuralization and modularization are adopted in the proposed design of MCB-UPQC. It is suitable for application in the power grid.
Energies 2018, 11, 3150
19 of 21
6. Conclusions Increasingly, equipment based on power electronics has been developed for application in the network, among which UPQC plays a significant role. However, UPQC can only compensate the power quality. To optimize the traditional UPQC, a novel UPQC based on a multi-converter parallel with a common DC bus is proposed in this paper. With the help of parallel converters, voltage regulation and current harmonic compensation can both be achieved to improve the power quality for a low-voltage high-current distribution system, and the renewable energy interface also benefits from the DC/AC converter. The control algorithms based on a multi-quasi-PR controller are proposed in both the shunt converters and the series converters. Considering the large numbers of modules in the UPQC, the proposed control algorithms have a reduced calculation time and are easier to achieve. Finally, the simulation results verify the feasibility of the control algorithms. Finally, the experimental platform is established, and the experimental results are presented to verify the validity and superiority of the proposed topology and algorithms. Author Contributions: Conceptualization, B.Y.; Data curation, K.L.; Funding Acquisition, J.Z.; Methodology, B.Y.; Project Administration, J.Z.; Software, S.Z.; Validation, S.Z.; Writing-Original Draft , B.Y.; Writing-review and Editing, K.L. Funding: This work was supported in part by grants from National Natural Science Foundation of China (Grant Number 51877042) and the Jiangsu Planned Projects for Postdoctoral Research Funds (Grant Number 2018K002B). Conflicts of Interest: The authors declare no conflict of interest.
Nomenclature: Usa , Usb , Usc uea , ueb , uec u ga , u gb , u gc udc i a , ib , ic i ga , i gb , i gc e a , eb , ec u a , ub , uc , un L g , Cg Lf , Cf L f 1, L f 2, C f e Pre f , Qre f P, Q ωre f , ω D p , Dq Ure f , U uinter u grid UPQC SVC SVG APF STATCOM DVR 3P4L SRF TDF q-PRc SVPWM VSG
Input voltage of the distribution system Output voltage of the three-winding transformer Input voltage of the shunt converter Voltage of the common DC bus Output current of the transformer Output current of the shunt converter Load voltage Output voltage of the 3P4L converter Filter inductance and DC capacitor of the shunt converter Filters of the H-bridge inverters LCL filters of the switch side in the 3P4L converter Reference active and reactive power Actual active and reactive power Rated and actual angular frequency Droop coefficient of power Reference and actual voltage of the filter capacitor in the 3P4L converter Output voltage of the 3P4L converter Output voltage of renewable energy Unified power quality controller Static synchronous compensator Static var generator Active power filters Static synchronous compensator Dynamic voltage regulator Three-phase four-leg Synchronous rotating frame Two degrees of freedom Quasi-PR controller Space vector pulse width modulation Virtual synchronous generator
Energies 2018, 11, 3150
20 of 21
References 1. 2. 3. 4. 5. 6. 7. 8. 9. 10.
11.
12. 13. 14. 15. 16. 17. 18. 19. 20. 21.
22.
23.
Primadianto, A.; Lu, C.N. A Review on Distribution System State Estimation. IEEE Trans. Power Syst. 2017, 32, 3875–3883. [CrossRef] Garces, A.A. Linear Three-Phase Load Flow for Power Distribution Systems. IEEE Trans. Power Syst. 2016, 31, 827–828. [CrossRef] Pejovic, P.; Janda, Z. An improved current injection network for three-phase high-power-factor rectifiers that apply the third harmonic current injection. IEEE Trans. Ind. Electron. 2000, 47, 497–499. [CrossRef] Xiao, X.; Zheng, X.; Wang, Y.; Xu, S.; Zheng, Z. A Method for Utility Harmonic Impedance Estimation Based on Constrained Complex Independent Component Analysis. Energies 2018, 11, 2247. [CrossRef] Zhang, Y.; Roes, M.G.L.; Hendrix, M.A.M.; Duarte, J.L. Voltage Harmonic Suppression by Means of Grid-Connected Converters Using only Local Measurements. Energies 2018, 11, 2515. [CrossRef] Jayatunga, U.; Perera, S.; Ciufo, P.; Agalgaonkar, A.P. Voltage Unbalance Emission Assessment in Interconnected Power Systems. IEEE Trans. Power Deliv. 2013, 28, 2383–2393. [CrossRef] Ghijselen, J.A.L.; Bossche, A.P.M. Exact voltage unbalance assessment without phase measurements. IEEE Trans. Power Syst. 2005, 20, 519–520. [CrossRef] Paranavithana, P.; Perera, S.; Koch, R.; Emin, Z. Global Voltage Unbalance in MV Networks Due to Line Asymmetries. IEEE Trans. Power Deliv. 2009, 24, 2353–2360. [CrossRef] Kim, Y.J. Development and Analysis of a Sensitivity Matrix of a Three-Phase Voltage Unbalance Factor. IEEE Trans. Power Syst. 2018, 33, 3192–3195. [CrossRef] Tolba, M.; Rezk, H.; Diab, A.A.Z.; Al-Dhaifallah, M. A Novel Robust Methodology Based Salp Swarm Algorithm for Allocation and Capacity of Renewable Distributed Generators on Distribution Grids. Energies 2018, 11, 2556. [CrossRef] Lu, G.; Zhang, N. The effects of electric heating load on renewable energy generation utilization: Case study in North China. In Proceedings of the IEEE Conference on Energy Internet and Energy System Integration (EI2). Beijing, China, 26–28 November 2017. Liu, Y.; Steurer, M.; Ribeiro, P. A novel approach to power quality assessment: real time hardware-in-the-loop test bed. IEEE Trans. Power Deliv. 2005, 20, 1200–1201. [CrossRef] Rahmani, S.; Hamadi, A.; Al-Haddad, K.; Dessaint, L.A. A Combination of Shunt Hybrid Power Filter and Thyristor-Controlled Reactor for Power Quality. IEEE Trans. Ind. Electron. 2014, 61, 2152–2164. [CrossRef] Wu, J.C.; Jou,H.L.; Feng, Y.T.; Hsu, W.P.; Huang, M.S.; Hou, W.J. Novel Circuit Topology for Three-Phase Active Power Filter. IEEE Trans. Power Deliv. 2007, 22, 444–449. [CrossRef] Peng, F.Z.; Lai, J.S. Dynamic performance and control of a static VAr generator using cascade multilevel inverters. IEEE Trans. Ind. Appl. 1997, 33, 748–755. [CrossRef] Rao, P.; Crow, M.L.; Yang, Z. STATCOM control for power system voltage control applications. IEEE Trans. Power Deliv. 2000, 15, 1311–1317. [CrossRef] Xiao, S.; Qiu, W.; Miller, G.; Wu, T.X.; Batarseh, I. An Active Compensator Scheme for Dynamic Voltage Scaling of Voltage Regulators. IET Power Electron. 2009, 24, 307–311. [CrossRef] Jothibasu, S.; Mishra, M.K. A Control Scheme for Storageless DVR Based on Characterization of Voltage Sags. IEEE Trans. Power Deliv. 2014, 29, 2261–2269. [CrossRef] Khadkikar, V.; Chandra, A. UPQC-S: A Novel Concept of Simultaneous Voltage Sag/Swell and Load Reactive Power Compensations Utilizing Series Inverter of UPQC. IET Power Electron. 2011, 26, 2414–2425. [CrossRef] Ye, J.; Gooi, H.B.; Wu, F. Optimal Design and Control Implementation of UPQC Based on Variable Phase Angle Control Method. IEEE Trans. Ind. Inform. 2018, 14, 3109–3123. [CrossRef] Monteiro, L.F.; Aredes, M.; Pinto, J.G.; Exposto, B.F.; Afonso, J.L. Control algorithms based on the active and non-active currents for a UPQC without series transformers. IET Power Electron. 2016, 9, 1985–1994. [CrossRef] Xu, Q.; Ma, F.; Luo, A.; He, Z.; Xiao, H. Analysis and Control of M3C-Based UPQC for Power Quality Improvement in Medium/High-Voltage Power Grid. IEEE Trans. Power Electron. 2016, 31, 8182–8194. [CrossRef] Ambati, B.B.; Khadkikar, V. Optimal Sizing of UPQC Considering VA Loading and Maximum Utilization of Power-Electronic Converters. IEEE Trans. Power Deliv. 2014, 29, 1490–1498. [CrossRef]
Energies 2018, 11, 3150
24. 25. 26.
27.
28. 29. 30. 31.
21 of 21
Abdul, M.R.; Amit, V.S.; Vinod, K.; Zeineldin, H.H. A Novel Ten-Switch Topology for Unified Power Quality Conditioner. IET Power Electron. 2016, 31, 6937–6946. Guo, W.Y.; Xiao, L.Y.; Dai, S.T. Control and design of a current source united power quality conditioner with fault current limiting ability. IET Power Electron. 2013, 6, 1755–4535. [CrossRef] Baghaee, H.R.; Mirsalim, M.; Gharehpetian, G.B.; Talebi, H.A. A generalized descriptor-system robust H∞ control of autonomous microgrids to improve small and large signal stability considering communication delays and load nonlinearities. INT J. Elec. Power. 2017, 92, 63–82. [CrossRef] Yang, B.; Zhao, Z.H.; Liu, M.X.; Zhao, J.F. Research on zero-sequence circulating current of PCS in MW energy storage system. In Proceedings of the IEEE International Conference on Power System Technology (POWERCON), Wollongong, Australia, 28 September–1 October 2016; pp. 1–5. Pochetjamroen, G.; Ise, T. Power Control of Low Frequency AC Transmission Systems Using Cycloconverters with Virtual Synchronous Generator Control. Energies 2017, 10, 34. [CrossRef] Cao, Y.J.; Wang, W.Y.; Li, Y.; Tan, Y.; Chen, C.; He, L.; Hager, U.; Rehtanz, C. A Virtual Synchronous Generator Control Strategy for VSC-MTDC Systems. IEEE Trans. Energy Convers. 2018, 33, 750–761. [CrossRef] Ma, Y.; Lin, Z.; Yu, R.; Zhao, S. Research on Improved VSG Control Algorithm Based on Capacity-Limited Energy Storage System. Energies 2018, 11, 677. [CrossRef] Liu, Y.T.; Lai, C.M. LCL Filter Design with EMI Noise Consideration for Grid-Connected Inverter. Energies 2018, 11, 1646. [CrossRef] c 2018 by the authors. Licensee MDPI, Basel, Switzerland. This article is an open access
article distributed under the terms and conditions of the Creative Commons Attribution (CC BY) license (http://creativecommons.org/licenses/by/4.0/).