DESIGN AND PERFORMANCE OF BNR ACTIVATED SLUDGE SYSTEMS WITH FLAT SHEET MEMBRANES FOR SOLIDLIQUID SEPARATION GJG du Toita, V Parcoa,b, M Ramphaoa, MC Wentzela,* and GA Ekamaa Water Research Group, Department of Civil Engineering, University of Cape Town, Rondebosch, 7701, South Africa. b Department of Hydraulic and Environmental Engineering, University of Palermo, 90100, Italy *Corresponding author:
[email protected]; Tel.: (021)650-2583; Fax (021) 689-7471 a
ABSTRACT The use of membranes for solid-liquid separation in BNRAS systems is investigated on a lab scale. The initial phase of investigation suggested that they are i) entirely feasible technically, ii) influence the design of the BNR system and WWTP design greatly, and iii) offer several advantages over BNR systems using secondary settling tanks such as improved effluent quality, which is independent of sludge flocculation or settling characteristics, reduced WWTP footprint and adjustable sludge mass fractions with recycle flows. However, years of application on full scale internationally have been limited to aerobic systems and little is known of the influence of membranes on BNR systems. This research project has been divided into two components, Phase 1 and Phase 2. Phase 1 focused on establishing initial design procedures for MBR BNR systems and a steady state analysis of MBR systems. Phase two continued the steady state analysis and provided parent systems for kinetic studies into the impact of membranes on BNR. This paper briefly outlines the work done to date and compares the results from both phases and the conclusions we can draw from them. INTRODUCTION Effective solid-liquid separation is an integral component of activated sludge systems as it has a direct influence on effluent quality. Traditionally in activated sludge (AS) systems this has been achieved through the use of secondary settling tanks which are susceptible to failure particularly due to poorly settling sludges. More recently membrane filters have been used for this purpose instead. They offer a number of potential advantages including: 1) Insensitivity to sludge settleability and filamentous bulking; this is a significant advantage as biological nutrient removal (BNR) systems notoriously produce poor settling sludges (DSVI~150mλ/g) when aerobic mass fractions are low (20days) so achieving complete nitrification is usually not a problem. As the volume of the aerobic reactor in the MBR system is fixed by the PWWF or the OTR, the aerobic mass fraction (fmaer) has the greatest influence on the total system volume. The lower the fmaer, the greater the total system volume will be. However increasing the fmaer is at the expense of biological N (anoxic mass fraction) and P (anaerobic mass fraction) removal. Reducing the PWWF/ADWF (fq) through flow balancing significantly increases the treatment capacity per unit membrane surface area, the increase depending on the extent to which fq is reduced. For high fq (>1.5) the indicated design for the WWTP is extended aeration (no primary settling and long sludge age, >30d) with direct discharge of waste activated sludge to dewatering so the high cost of membranes can be offset by the savings in sludge treatment costs. Treating flow balanced (fq 7 in both systems. The sewage was collected in 2m3 batches from Mitchells Plain Wastewater Treatment Plant (Cape), stored at 4˚C and served as feed for about two weeks. Both systems were monitored daily via the parameters in Table 2. Additionally recycle flow rates and trans-membrane pressure (TMP, constant flux 0.24m3/m2/d) were monitored daily. Mixed liquor samples were analysed microscopically for filaments and floc structure monthly. Sewage readily biodegradable COD (RBCOD) was measured daily according to Ekama et al., (1986) and as a check by flocculation-filtration (Mbewe et al., 1995). Daily sludge was wasted from the systems in accordance with the required sludge age of 20 days. OUR was measured in a side stream reactor to the aerobic reactor. This was necessitated by the requirement for constant aeration in the aerobic reactor in order to achieve effective scour across the membranes. Table 2. Sampling position and parameter measurement. Test COD TKN FSA NO3 NO2 T-P TSS VSS OUR DSVI pH Influent F; UF UF F UF Anaerobic F F F UF UF Anoxic F F F UF UF Aerobic UF UF F F F UF UF D D D Final effluent F; UF F; UF F F F F; UF F = 0.45 µm filtered; UF = Unfiltered samples; D = Direct measurement taken (filtering not applicable); COD = Chemical Oxygen Demand; TKN = Total Kjeldahl Nitrogen; FSA = Free and Saline Ammonia; T-P = Total Phosphorus; TSS = Total Suspended Solids; VSS = Volatile Suspended Solids (Standard Methods, 1985); DSVI = Dilute Sludge Volume Index; (Ekama and Marais, 1984); OUR = Oxygen Utilization Rate (Randall et al., 1991).
System responses Initial membrane and bioreactor tests were conducted on the membrane system to establish the membrane potential fluxes, the oxygen transfer potential and residence time distribution (RTD) in the membrane bioreactor. These indicated that , 1) the membranes could readily accommodate the required operational fluxes (~ 0.24 m³/m²/d) and TMP (< 100mm); ii) with activated sludge over a short duration, only a small increase in TMP was
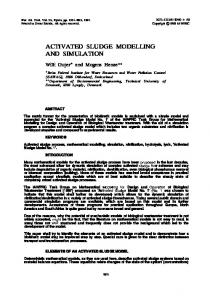
required to achieve the same flux as water; iii) the expected OUR (135mgO/λ/h) could easily be sustained at a residual DO > 5.0 mgO/l; and iv) RTD tests indicated that the aerobic membrane bioreactor was completely mixed. Trans-membrane pressure was constantly monitored and a constant increase in time of 0.115mm/d was observed. DSVI over the period was also observed but showed no relation to TMP, see Figure 2. The TMP is discussed later in conjunction with the results from phase 2. 180
200
Oil Spill, and first chemical clean
TMP (mm)
180
160
140
140
120 120
100 80
DSVI (mL/gSS)
TRANS-MEMBRANE PRESSURE (mm)
DSVI (mL/g)
160
100
60 40
80
20 0 0
20
40
60
80
100
120
140
160
180
200
220
240
260
280
300
320
340
360
380
60 400
TIME (days)
Figure 2 : Trans membrane pressure (TMP) and diluted sludge volume index (DSVI) with time in the lab-scale MBR UCT activated sludge system, Phase 1. From the experimental investigation the MBR system showed removals that were equal or better than those in the conventional UCT system, see Table 3 below. Table 3: System removals in Phase 1 Parameter
Influent (common)
COD (mg/l) TKN (mg/l) FSA (mg/l) NO3 (mg/l) TN (mg/l) TP (mg/l) TSS (mg/l) CFU/100ml
987 103 84 0 103 41 N/A N/A
UCT System Type MBR Conventional Effluent Efficiency (%) Effluent Efficiency (%) 35 96 57* (73)** 94 3.2 97 3.2 97 1.9 98 2.6 97 23 22 26 74 25 75 14 66 19 54 0 100 15 0 3000 -
*Filtered sample (0.45 µm) ; **unfiltered sample N/A = not available; FSA = free and saline ammonia ; TN = total nitrogen ; TP = total phosphorus ; CFU = colony forming unit
Mixed liquor characteristics showed a marked difference in the VSS/TSS and TKN/VSS ratios for both systems. The COD/VSS ratio however was similar for both. Of particular interest was the consistent observation of greater sludge production in the MBR UCT system to the conventional system, 0.32mgVSS/mgCOD vs 0.22mgVSS/mgCOD. These differences are discussed later.
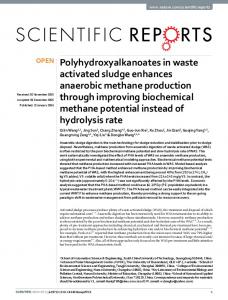
Initial conclusions Phase 1 established that MBR BNR systems could produce an effluent of equal or superior quality to that of a conventional system. However questions it raised included why the MBR had a substantially greater sludge production than the conventional system; quantifying the phosphorus uptake in the system; and how to optimize BEPR in the systems and the impact of high TSS on the BNR kinetics. These were investigated further in Phase 2 as steady state analysis continued. During Phase 2 the two systems acted as parent systems from which sludge was harvested for anaerobic, anoxic and aerobic batch tests in which kinetic studies could be conducted (Parco et al, 2006). PHASE 2 In the intervening period between Phases 1 and 2 the systems were operated at the same design parameters with only basic maintenance tests. Microbiological tests showed that the organism composition in the reactors had evolved and changed character in the interim. System description Phase 2 maintained identical system configurations and design parameters from phase 1 (Fig. 1; Tables 1 and 2). The testing regime also remained unchanged apart from the addition of a second RBCOD test (Mbewe et al., 1995). The only modification to the system was in the testing of the OUR, which was performed in a separate aeration reactor which drew sludge from the anoxic reactor, returning it via the a-recycle. The difference in solids concentration and aerobic mass fractions between the OUR reactor and the aerobic reactor was taken into account in calculating the OUR. Results In May (2005) new Kuboto ® membranes were installed in the MBR system. Initial flux tests were performed on the new membranes to establish their flux rates and specific trans-membrane pressures. The five membranes in the system, amounting to 0.586 m², would easily achieve the required flow rate of 140λ/d corresponding to a membrane flux of ~0.24m³/m²/d. OTR rates and RTD in the membrane bioreactor had already been established in phase 1. The TMP of the new membranes was monitored closely, but was found to vary considerably, (Figure 3). This was attributed to variations in the recycles and inter reactor flows resulting from blockages in the inter reactor connecting pipes. Over time the TMP increased, quickly in the first few months (0.451mm/d), and thereafter more gradually (0.235mm/d). After 9 months, and no chemical clean, the TMP was still lower than the initial TMP of Phase 1. 140
MBR Phase 2 120 100
TM P 80 (m m) 60 40 20 0 08-Apr-05
28-May-05
17-Jul-05
05-Sep-05
25-Oct-05
14-Dec-05
02-Feb-06
Time (days)
Figure 3: TMP with time in the lab scale MBR UCT reactor
The system removals for Phase 2 are summarised in Table 4. As in Phase 1 an equal or superior effluent was achieved. Similarly in Phase 1 substantially higher sludge production was noted in the MBR system. This is discussed further below. Table 4: System removals in Phase 2 Parameter
Influent (common)
COD (mg/l) TKN (mg/l) FSA (mg/l) NO3 (mg/l) TN (mg/l) TP (mg/l) CFU/100ml
953 108 83 0 108 29.3 N/A
UCT System Type MBR Conventional Effluent Efficiency (%) Effluent Efficiency (%) 39 96 52* (77)** 95* (92)** 2.3 98 8 93 1 99 6 93 17 13 19.3 82 21 81 8.8 70 14 53 10 6400 -
*Filtered sample (0.45 µm) ; **unfiltered sample N/A = not available; FSA = free and saline ammonia ; TN = total nitrogen ; TP = total phosphorus ; CFU = colony forming unit
Substantial foaming (~100mm) is commonly observed in the anoxic reactor of the MBR UCT system (not in the aerobic and anaerobic reactors). This is attributed to a high denitrification rate in the system caused by the high sludge concentration in the system. This foam could be destabilized by mechanical mixing and was not caused by filamentous organisms. The high N2 production rate produces gas bubbles which cause foaming which remains entrapped on the reactor surface due to the sub-surface draw off of the reactor output. This however is easily catered for in wastewater treatment plants by ensuring surface flow between reactors preventing the entrapment and subsequent foam build up. COMPARISON OF RESULTS AND DISCUSSION Although Phase 2 of the investigation is still ongoing it is possible to compare the results to date with Phase 1 and preliminary conclusions can be drawn. System Loading In Phase 1 the MBR UCT system aerobic and anoxic mixed liquor concentrations were 19400 (±2000) and 13600 (±1800) mgTSS/λ respectively, in Phase 2 for the same sludge age and wastewater source and loading lower mixed liquor concentrations 16960 (±2200) and 13200 (±1900) mgTSS/l were recorded. When the a-recycle got blocked the aerobic concentration would increase and the anoxic concentration decrease changing the zone mass fractions in the system. In the CAS system in both Phase 1 and 2 the aerobic and anoxic MLSS concentrations were very similar 3700 (±400) and 3600 (±650) Phase 1, and 3110 (±360) and 3070 (±330) mgTSS/λ in Phase 2. Clearly the distribution of mixed liquor in the MBR BNR system is different to that of a conventional BNR system and is directly influenced by the a-recycle ratio. This is in agreement with the design framework developed by Ramphao et al. (2005) for MBR BNR systems. This zone-mass fraction flexibility is a significant advantage as it allows easy manipulation of the zone mass fractions (without changing zone volumes) to optimize N and P removal in accordance with the characteristics of the influent sewage and effluent N and P concentrations required. In order to obtain effective scouring across the membranes the MBR system was operated at a higher reactor TSS concentration than the SST system. COD mass loading per unit reactor volume was 3.2 times higher than for the SST system at 1867mgCOD/(l.d) versus
592mgCOD/(l.d). This confirms the substantial reactor volume savings that can be achieved in MBR systems, but as indicated above these volume reductions are strongly influenced by selected unaerated mass fractions, the higher these mass fractions, the smaller the volume saving. Trans-membrane pressure (TMP) It is hypothesized that the initial higher increase in TMP in Phase 2 is due to the establishment of a dynamic gel layer on the membrane surface. This increase in TMP could not be reversed with water or chemical cleaning. However these increases need to be seen in perspective. At the Phase 1 rate the resultant increase in TMP would be roughly 700mm in 20 years! The TMP appeared independent of sludge settleability and aeration intensity (floc shear) and confirms advantages 1 and 2 above. N and COD mass balances N and COD mass balances were performed on the system results for every waste water batch used in order to validate the experimental data. Good N mass balances were obtained in the two systems throughout Phase 1 (MBR 103.5% and SST 95.5%) and in the latter half of Phase 2 (MBR 87.1% and SST 99.7%). Poor N balances in the early stages of phase 2 are attributed to difficulty with nitrate testing. Relatively low COD mass balances were obtained consistently through Phase 1 (MBR 90.5% and SST 87.1%) and phase 2 (latter half, MBR 93.1% and SST 84.2%). However these results are similar to those obtained in earlier UCT and MUCT NDBEPR systems (84-90%) and indicate that the presence of an anaerobic reactor/zone may lead to a loss of COD that is not taken into account in the calculated COD mass balance. The underlying mechanisms for the COD “loss” have not been established in the past decade of BNR research (Ekama and Wentzel, 1999a). System removals and effluent quality In both Phases 1 and 2 the MBR system exhibited removals that were equivalent or superior to those produced by the SST system, these are summarized in Tables 3 and 4. The largest difference, common to both phases, was in the P removal which was substantially better in the MBR UCT system. A difference in the anoxic P uptake probably accounts for the higher P removal, (still to be evaluated from the kinetic sludge batch tests (Parco et al., 2006)). The MBR system produced a solids free effluent, whereas in the conventional UCT systems there was a continual loss of solids to the effluent (15mgCOD/λ), quantified in phase 1 as the difference between 0.45µm filtered and unfiltered effluent COD concentrations and via VSS/TSS and VSS/COD ratios, see below. This confirms that the MBR UCT system effluent quality is independent of the flocculation characteristics of the mixed liquor. The MBR UCT system also produced an effluent filtered COD concentration that was consistently lower by 22 and 13mg/λ (in Phases 1 and 2 respectively) than the filtered (0.45µm) effluent COD concentration in the CAS system. This implies that membranes retain organics that would be considered “soluble” in a conventional system with SST’s. The microbiological quality of the MBR system effluent was also superior to that of the SST system 10 versus 6400 CFU/100ml. Thus far only two tests have been conducted and this parameter will be routinely tested in future to substantiate these results. Nutrient removal behaviour Nitrification was virtually complete in both systems, as can be seen in Tables 3 and 4 due to the very low free and saline ammonia (FSA) values. Total nitrogen removals were also
very similar and almost complete in both systems. The P-removal behaviour of the two systems is summarized in the following table as P-uptake and release in the respective reactors: Table 5. A comparison of P-mass changes across the reactors in both phase1 and 2
Phase 2 Phase 1
UCT System Type MBR (mgPPO4/λ influent) Conv (mgPPO4/l influent) MBR (mgPPO4/l influent) Conv (mgPPO4/l influent)
Inf. Conc
P-mass changes (- = P release; + = P uptake)
Eff. conc
Prem
Anoxic Nitrate (mgN/l)
∆ Anaerobic
∆ Anoxic
∆ Aerobic
∆ MBR/SST
-136
15
148
1
14
27
0.3
-47
26
40
2
19
22
2.3
-99
5
114
0
9
18
0.8
-33
8
37
-2
14
14
3.4
41
27.7
Clearly the BEPR behaviours of the two systems differ greatly, with the P-release, uptake and removal in the MBR system significantly higher. One possible explanation is the phenomenon of anoxic P uptake. In both phases, both systems experienced significant anoxic P uptake BEPR. This observation was more dominant in the conventional system than the MBR system with 39 and 9% respectively of P-uptake respectively. With Anoxic P uptake by denitrifying PAO’s significantly reduced BEPR has been reported (Ekama and Wentzel, 1999b; Hu et al., 2002) and was also evident here. Conditions identified as possibly inducing anoxic P uptake include (i) nitrate load to the anoxic reactor exceeding the denitrification potential of the reactor, (ii) low aerobic mass fractions, (iii) nitrification upstream of the anoxic reactors and (iv) reduced frequency of alternation between anoxic and aerobic states (Hu et al., 2002). Of these, (i) was identified to be the main factor in stimulating anoxic P uptake here. This can be observed via the anoxic reactor nitrate concentration (expressed in the last column in mgN-NO3/λ reactor). If nitrate is present then the reactor has not denitrified all nitrate entering it, and accordingly the higher the nitrate concentration, the larger the load exceeds the potential. This not only stimulates anoxic P uptake BEPR, but also results in high nitrate discharge to the anaerobic reactor where it is denitrified utilizing influent RBCOD. This reduces the RBCOD available for PAO’s and so further decreases the Premoval. The observations above would suggest that the nitrate load to the anoxic reactors in both systems should be reduced, via reducing the a-recycle ratios, to maximize BEPR. In the conventional UCT system reducing the a-recycle ratio does not impact on the anoxic mass fraction and hence, provided the nitrate load remains just less than the denitrification potential, the N removal performance will not be adversely affected. However, in the MBR UCT system, from the design procedures of Ramphao et al. (2005) reducing the a-recycle ratio causes a corresponding reduction in the anoxic mass fraction and hence impacts adversely on N removal performance. The conflicting requirement between N and P removal in BNRAS systems is by no means unique to the MBR configuration. A number of factors influence the optimization of N and P removal including influent TKN/COD ratio, N and P removal requirements and influent RBCOD. At present anoxic P uptake BEPR is not explicitly incorporated in the steady-state design procedures for BEPR systems (Wentzel et al., 1990), as quantitative relationships linking the extent of anoxic P uptake to the system design or operational parameters have not been established. In the interim, the lower BEPR with anoxic P uptake can be accommodated by reducing the P content of the PAOs (fXBGP), 0.259 and 0.232 mgP/mgVSS for the observed P removal in the MBR and conventional UCT systems respectively in Phase 1, (Phase 2 is not complete and hence these results are not yet
available). However, predicting a priori exactly what value of fXBGP to use for a certain % anoxic uptake remains uncertain. Clearly this requires further investigation. Mixed liquor characteristics and sludge production The mixed liquor characteristics are summarized below in Table 6. The VSS/TSS ratios in both phases were significantly different at the 95% confidence interval (CI, t-test), and reflect the differences in P removal in the two systems. In contrast the COD/VSS values are reasonably close and both fall within the theoretical ratio of 1.42 and the practically accepted value of 1.48. The TKN/VSS ratios were significantly different at the 95% CI. The conventional system values are close to the commonly accepted theoretical ratio of 0.12 and the practical ratio of 0.10, however the MBR system is significantly lower. Together with the higher sludge production in the MBR system (below), this suggests accumulation of organics in this system that do not contain N, but this is largely speculative. Table 6. Mixed liquor characteristics Phase 1 2
System MBR Conv MBR Conv
VSS/TSS 0.79 (±0.008) 0.82 (±0.029) 0.82 (±0.035) 0.80 (±0.023)
COD/VSS 1.35 (±0.053) 1.37 (±0.049) 1.36 (±0.117) 1.43 (±0.144)
TKN/VSS 0.08 (±0.014) 0.11 (±0.019) 0.09 (±0.008) 0.10 (±0.016)
The MBR UCT system had a greater sludge production per COD load than the conventional system with 0.32 and 0.33 kgVSS/kgCOD load in Phase 1 and Phase 2 respectively compared with 0.22 and 0.25 kgVSS/kgCOD for the SST system. This increased solids production can be attributable in part only to the retention of solids in the MBR that would otherwise escape in the effluent stream, and the MBR characteristic of retaining unbiodegradeable organics that would be considered soluble in a system with SST’s and hence also lost in the effluent. However, these explanations do not account for the magnitude of increase in sludge production. Sludge settleability Microscopic examination determined anoxic - aerobic (AA, Casey et al., 1994) filaments as dominant in both systems (M. parvicella and 0092). DSVIs varied over the investigation period, from 80 to 135 mλ/g in the MBR and from 80 to 240 mλ/g in the conventional system. However, these variations in DSVI in the two systems were not concurrent – each system appeared to adopt its own DSVI value. CONCLUSION This study so far has clearly demonstrated that BNRAS with membrane solid liquid separation is entirely feasible, and offers considerable advantages over SST BNR activated sludge systems, such as improved effluent quality, which is independent of sludge flocculation or settling characteristics and adjustable sludge mass fractions with recycle flows. If the water is to be re-used in water reclamation, the improvement in effluent quality from the MBR UCT system is of considerable benefit, either if used directly for non-potable water applications or treated for potable water. The observed higher sludge production in the MBR UCT system in both phases does not substantiate whether this is consistently true for MBR systems. Further study at longer sludge ages are planned to accentuate sludge production. It should however be realized that higher sludge production is not that as significant a disadvantage for design of a MBR
system as it would seem. MBR BNR systems are sized by the PWWF or the OTR, not on sludge production as is the case with conventional SST systems. These criteria force long sludge ages onto the MBR BNR systems, significantly longer than equivalent SST BNR systems, which means nitrification is not a factor in selection of sludge age. Therefore, reducing the sludge age by 10 to 20% to accommodate the higher sludge production will not impact nitrification performance (but may be beneficial to BEPR, Wentzel et al., 1990). However, the higher sludge production does affect plant economies. Higher sludge production results in higher treatment and disposal costs, but this is compensated for by the lower oxygen demand to conform to the COD mass balance over the system. Anoxic P uptake has been consistently observed in this and other investigations. Anoxic P uptake is detrimental to the BEPR performance in a BNR system. However, quantitative links between design and operational parameters and the extent of anoxic P uptake have not been established. This has hindered incorporation of anoxic P uptake in the design and simulation models for BNR systems, with or without membranes, and requires resolution. To aid the implementation and operation of membrane BNR systems design guides and procedures have been developed (Ramphao et al., 2005). However the OTR and alpha values used are illustrative only and are not for direct application to design. Further rigorous testing of the membranes will be undertaken once the steady state analysis is complete. These studies will look at the interrelationships between airflow rate, TMP, membrane flux (fouling), OTR (aerator alpha values) and solids concentration. The alpha value directly influences the aeration required and hence impacts on the long term operating costs of the plant which must be taken into consideration in design. Further experimental work is currently being undertaken to determine the kinetic rates of the various biological processes to see if these are similar to the rates in the SST BNR systems (Parco et al., 2006). The objective of these studies is to establish the applicability of the kinetic models developed for the SST BNR systems to MBR BNR systems so that once the MBR system has been designed (reactor volumes, sludge ages, recycle ratios) the dynamic performance of the system can be evaluated with the standard activated sludge simulation models (e.g. UCTPHO, (Wentzel et al., 1992) with possibly modified kinetic rates). REFERENCES 1) Casey TG. Wentzel MC, Ekama GA, Loewenthal RE, Marais GvR “An hypothesis for the causes and control of anoxic-aerobic (AA) filament bulking in Nutrient removal activated sludge systems”, Water Science Technology 29(7), p.203-212. (1994). 2) Churchouse S and Brindle K (2003), “Long term experience with membrane biological reactors”, 4th International meeting on membrane bioreactors for wastewater treatment, School of Water Sciences/ Water Biotreatment Club, Cranfield University, Cranfield, UK, 9th Apr 2003. 3) Ekama GA, Wentzel MC, “Difficulties and developments in biological nutrient removal and modelling” Water Science Technology. 39(6) p. 1-11 (1999a) 4) Ekama GA, Wentzel MC, “Denitrification kinetics in biological nitrogen and phosphorus removal activated sludge systems treating municipal wastewater”, Water Science Technology, 39(6) p. 69-77 (1999b). 5) Ekama GA, Dold PL, Marais GvR, “Procedures for determining influent COD fractions and the maximum specific growth rate of the heterotrophs in activated sludge systems”, Water Science and Technology 18(6), p.91-114, (1986).
6) Mbewe A, Wentzel MC, Ekama GA, “Characterization of Carbonaceous materials in municipal wastewaters”, Res. Rept. W84, Dept. Civil Engineering, University of Cape Town, (1995). 7) Parco V, Wentzel MC, Ekama GA “Evaluation of kinetics in a membrane bioreactor biological nutrient removal activated sludge system”. WISA Biennial conference, Durban , (2006). 8) Ramphao M, Wentzel MC, Merritt R, Ekama GA, Young T and Buckley CA “Performance and kinetics of biological nitrogen and phosphorus removal with ultrafiltration membranes for solid-liquid separation”, UCT Research Report W120, Dept of Civil Eng., Univ of Cape Town, Rondebosch 7701, South Africa, (2004). 9) Standard Methods, “Standard Methods for the examination of water and wastewater” (16th ed.) American Health Assoc., Washington DC, (1985). 10) Stephenson T, Ekama GA, Dold PL, Marais GvR, “Biological excess phosphorus removal – steady state process design” Water SA, 16(1), p29-49, (1990). 11) Wentzel MC, Ekama GA, Dold PL, Marais GvR, “Biological excess phosphorus removal – steady state process design”, Water SA 16(1), 29-49, (1990). 12) Wentzel MC, Ekama GA and Marais GvR, “Processes and modeling of nitrification denitrification biological excess phosphorus removal systems – a review”, Water Science Technology, 25(6) p.59-82, (1992).