Mar 26, 2013 - Sri Lanka is a developing economy of about 20.3 ..... develop models to predict expected malaria incidence in selected regions of India and .... http://www.epid.gov.lk/web/index.php?option=com_casesanddeaths&Itemid= ...
Journal of Health Informatics in Developing Countries
www.jhidc.org Vol. 7 No. 1, 2013 Submitted: March 26, 2013
Accepted: April 4, 2013
Notifiable Diseases: A Time and Geographic Analysis of Cases in Sri Lanka between 2005 and 2011: The Development of a High Fidelity Modeling Approach Irosha PERERA, Estie KRUGER 1 , Pubudu LIYANA GE and Marc TENNANT Centre for Rural and Remote Oral Health, The University of Western Australia, Nedlands, Western Australia Abstract. Notifiable diseases are a significant burden to health systems across the globe, particularly in developing countries. Sri Lanka is a developing economy of about 20.3 million people spread across a fundamentally industry-driven economy island state, of approximately 65610 square kilometers. This study examines the data for notifiable diseases for Sri Lanka through 2005-2011 inclusive to identify geographic trends in disease outbreaks and to document any indicators that may assist in predicting future outbreaks. The aim of the research was to develop tools to assist in the prediction (or early warning) of future outbreaks. Over the study period there were a total of 280,000 cases of the 18 notifiable conditions. The three most common conditions were Dysentery, Leptospirosis and Dengue Fever which made up 207,000 (74%) of all cases. The incidence of these common notifiable conditions showed significant variability over time. In particular, a significant outbreak of Dengue fever was seen through 2009 and 2010 (with a diminishing tail in 2011). Chronologic and geographic shifts in notifiable disease patterns can be identified though the application of modern Geographic Information Systems. T he analysis presented describes in high-fidelity the outbreaks of three common diseases for Sri Lanka over the study period. The addition of further data inputs (eg weather data) would allow the models to be more predictive of outbreaks and would assist in resource allocation and planning. Keywords: Dental Public Health, notifiable conditions, Sri Lanka.
I.
Introduction
Notifiable diseases comprise of a group of communicable diseases that are a significant burden to health systems across the globe [1]. Many of the conditions cause significant morb idity and an identifiab le mortality, and commun ities place a strong emphasis on monitoring and addressing the causes [2]. Many of these conditions affect developing countries at a greater rate [3]. Poverty and overcrowding is core to the public health causes of many of the conditions. Early detection of impending outbreaks, followed by a rapid response is the cornerstone of controlling a communicable d isease, and is underpinning the importance of collect ing real-t ime, co mplete and accurate data with analysis and timely dissemination [4]. Epidemio logic surveillance is a major public health strategy to prevent and control a disease, but also provides accurate data on the epidemiology and burden of a disease. Geographic information systems (GIS) consists of 1
Corresponding author: Dr Estie Kruger, CRROH, The University of Western Australia, 35 Stirling Highway, Nedlands, Western Australia 6009, Australia.
88
a computer based system for the input, storage, maintenance, management, retrieval analysis and output of geographic/location and timely data [5]. It facilitates the assessment of geographic and chronologic shifts in outputs of interest, thereby gaining recognition as the basis of data linkage and analysis in the 21st century [6]. People are not spread evenly across the surface of the earth, and populations are different along many dimensions, in regards to age, gender, culture, and economic status. These variables affect their need for health care, their ab ility to travel to health care centres, and the types of services they are willing and able to utilize. GIS can be used extensively in developing countries to map and exp lore the geographical variations for health services and developing innovative indicators of health care needs. GIS can also be used to plan healthcare delivery, accessibility and utilization of healthcare facilities and aid resource allocation to provide better health for all. The technology has been used in studies to estimate the most favourable location for new clinics or hospitals that minimize the distance that patients need to travel, considering the existing facilities, transport provision and population density. GIS is an accessible and useful global health tool, according to a wide variety of GIS applicat ions for health access and planning reports from both the developed and developing countries. These applications have been used to increase admin istrative effectiveness and efficiency in health services-benefits that may have contributed to diffusion and increased use of the application in public health practice and research. GIS plays a role that is very important in strategic health planning contexts, where the information presented in maps can assist in cross-sectional decision making. Sri Lan ka is a tropical developing island nation with 20.3 million people spread across approximately 62 705 square kilo meters (km2 ) land area, and are fundamentally an industry-driven economy [7]. The average household income is Rs.36451x12 per month ($US3468 per annum) and appro ximately 8.9% of the population live below the poverty line [7]. There are clearly evident demographic transitions with rapidly expanding elderly and middle aged age groups, and epidemio logic transition with non-commun icable diseases the predominant cause for morb idity and mortality, rather than communicable disease. [8]. Nevertheless, communicab le diseases such as Dengue has become endemic in the almost all districts of the country with waves of infection occurring in ep idemics, affecting thousands of people, and thereby creating a huge burden on the country’s health care system [9]. Furthermore, Leptospirosis, endemic to rural localit ies reached epidemic proportions in latter part of 2007, extending to the early part of 2008 with high mortality [10]. The economic activ ities, environment, sanitary conditions, ecological and contemporary climatic changes combined to create supportive environments for outbreaks of these diseases [11]. Against this backdrop, notifiable disease surveillance has become an integral co mponent of routine disease surveillance systems in the country [12]. This study examines the data for notifiable diseases for Sri Lanka through the last 7 reported years (from 2005-2011) to identify geographic trends in disease outbreaks and to document any indicators that may assist in predicting future outbreaks. The aim of the research was to develop a spatio-temporal model to assist in the prediction (or early warning) o f future outbreaks by application of GIS.
89
II. Materials and Methods The primary data for this study came fro m the Ep idemio logy Unit, Min istry of Health and Depart ment of Census and Statistics in Sri Lanka. All quarterly reports for 2005 to 2011 were collected from the Ep idemio logy Unit website and data were collated into a complete database [13]. 2.1 Original Data Collection There is a well-developed grass root level public health infrastructure in the country dominated by Medical Officer of Health (M OH) areas. The d isease notification system in the country has a long history an originating fro m the quarantine and prevention of disease ordinance of 1897 and subsequent amendments with legal provisions for the implementation of the system in the country [14]. The Ep idemio logy Unit of the Min istry of Health releases epidemiological data quarterly, as a bulletin for appro ximately 20 notifiable conditions. These reports are presented district-by-district, which allows for a chronographic and geographic analysis of the conditions. It is noted that the report are for cases in the preceding quarter. For simplicity this research will use the report date throughout. 2.2 Population data Population data from the 2001 census was collected from the Census website [15] and population growth figures (by district) were applied to produce population estimates for each year of the study frameset. The country has recently ended a long-standing internal conflict centered in the North and East which had a substantial economic burden to the developing nation and impaired data collection in affected areas. Hence, 7 of the 24 districts did not have a population growth figures so the national average figure of 0.71% per annum was applied [15]. 2.3 Incidence estimates Incidence of cases quarter by quarter was calculated based on the documented number of cases for each condition against the district level population estimate. All calculations were comp leted using Excel (version 2003, Microsoft, Redmont WA USA) and reported as cases per 100,000 of population. Geographic boundary files for districts in Sri Lanka were downloaded from the Census website [16]. Data was fully integrated using ArcGIS (version 10, ESRI, Redlands CA USA).
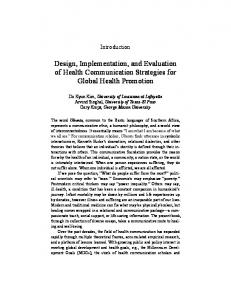
III. Results Over the 6 years there were a total of 280,000 cases of the 18 conditions. The three most common conditions were Dysentery, Leptospirosis and Dengue Fever which made up 207,000 (74%) of all cases (Table 1-3). The rest of the analysis focuses on these three conditions. A spike in Dengue Fever cases in 2010 continuing into 2011 was evident from the Island-wide data (Figure 1). The rates of Leptospirosis appeared to rise between a
90
stable low fro m 2005-2007 (9.1 cases per 100,000) to a relatively new stable high fro m 2008-2010 (30.4 cases per 100,000). Dysentery was trending downward over the period of the study from a h igh of 41.2 cases per 100,000 in 2005 to 28.5 cases per 100,000 in 2011. Dysentery: Over the study period there were 49 300 cases with an incidence ranging fro m a high of 41.2 in 2005 to 28.4 in 2011 at the national level. The incidence of dysentery remained relatively stable at the district level, although the range between districts was significant (0 to about 200). At the district level the highest incidence was 766 in Vavuniya reported in 2009-Q2 (Tab le 1) this clearly appeared to be a short lived outbreak in a simp le district. It was not a data aberration because in the quarter follo wing (Q3) the rate remained very high at 211 cases per 100,000 within the state. A sequence of smaller outbreaks can be seen in Trincomalee and Batticaloa in 2001 and a smaller outbreak in Vavuniya and Matale in 2005. Figure 1. Total cases (top) and Incidence of cases per 100,000 people (bottom) of the three most common notifiable conditions for Sri Lanka wide for the 6 years 2005-2011 inclusive.
91
Table 1. The incidence of Dysentery for each district (rounded to whole number) for each report quarter (20052011). Green cells are below 10, pink cells are incidences between 30 and 50, and red cells are incidence above 50.
Leptospirosis rates (by district) have seen some significant variation particularly in a couple of districts (Table 2). Rates remain relatively low but Matale had an outbreak in late 2007 running for more than 12 months with a peak incidence of 83 cases per 100,000. Matara has since 2007 had an elevated incidence (about 10 cases per 100,000) and this has remained consistently higher than the majority of other districts. Table 2. The incidence of Leptospirosis for each district (rounded to whole number) for each report quarter (2005-2011). Green cells are below 3, pink cells are incidences between 10 and 30, and red cells are incidence above 30
92
Dengue fever rates show a distinct upsurge in early 2009 lasting for so me 1218months (Table 3). Rates peaked in some areas at over 200 cases per 100,000 people in late 2009. A significant trailing tail remained through 2011 for a handful of districts particularly Co lo mbo and Batiticaloa. A clear association between population density and the incidence of dengue fever (but not with poverty) was evident (Figure 2). It was clearly evident fro m the GIS mapping that early growth in incidence was seen from the mapping approach prior to the peak of the outbreak. Table 3. The incidence of Dengue Fever for each district (rounded to whole number) for each report quarter (2005-2011). Green cells are below 10, pink cells are incidences between 30 and 100, and red cells are incidence above 100.
Figure 2. The incidence (cases per 100,000 people) of dengue fever (red dots) overlaid on population density (graded blue) for the years 2007-2011. The top left figure is the proportion of people living below the poverty line for each district (red being the highest).
93
IV. Discussion Notifiable diseases are infectious/communicab le diseases imposing high burden to health care delivery systems as leading causes of morb idity and mortality and economic prosperity of countries across the globe [17]. Newly emerging and re-emerging infectious diseases such as Severe Acute Respiratory Syndrome (SARS), HIN1, nCo V Coronovirus and Leptospirosis have alerted epidemiologists and health authorities in many countries [18]. Strengthened disease notification systems coupled with effective response mechanis ms are pivotal to prevent and control disease outbreaks by rational, cost-effective measures which are the constituents of Ep idemio logical Surveillance [19]. The speed of reporting, coverage, comp leteness, accuracy, flexib ility, acceptability and predictive value are some of the key appraisal indicators of disease notification systems [20]. Underreporting (inco mplete reporting) and slow speed of reporting considered as key limitat ion of these systems [21,22]. The notification system in Sri Lanka is well established with 20 notifiab le diseases with periodic updates [14]. However, it is predominantly paper-based and often requires 15-30 days to for data commun ication and the central Epidemiology unit to process it [23]. Application of Informat ion and Commun ication Technology has been introduced to overcome this limitation resulting in delays in timely detection of disease outbreaks. A real time bio-surveillance pilot project has been introduced in this regard [24]. Geographical Information Systems (GIS) supports special and chronological illustrations of notifiable diseases to alert the health authorities to study the patterns and trend and to mit igate negative consequences of future outbreaks by well advanced targeted approaches [24,25,26]. Against this backdrop, our analysis demonstrates application of GIS to develop a saptio-temporal model for three most common notifiable diseases in Sri Lan ka namely dengue, leptospirosis and dysentery. The incidence of the three most common notifiable conditions in Sri Lan ka has shown variability over the last 8 years. In particu lar a significant outbreak of Dengue fever was seen through 2009-10 (with a dimin ishing tail evident in 2011). Dengue is an endemic
94
vector-borne disease predominantly seen in the tropics. Cases have been reported across the continents of Asia, Africa, The Americas, Europe, and Australia [27]. Whilst most of dengue cases recover from a simp le febrile illness, a small but significant proportion go on to develop the dengue shock state with associated fatalities. In many affected areas, this adds up to a significant case fatality rate, predominantly among young children and individuals of working age. The difficulty in controlling dengue infection stems from three root causes, ie, the presence of four different serotypes of virus, each with the independent ability to cause fatal disease, a lack of understanding of pathophysiology, non-availability of specific treat ment, non-availability of a vaccine for prevention, and difficu lties in controlling the vector population [28]. The incidence of Dysentery has shown two peaks that rapidly arose and then disappeared in the districts of Trinco malee (2009) and Vavuniya (2011) otherwise smaller apparently random spikes in incidence were seen across Sri Lanka. These spikes could be plausibly attributed to dysentery outbreaks occurring among transient camps and relief v illages of internally displaced people due to prevailed 30-yearcivil war centered in the north and the east of the country. Outbreaks of dysentery are not uncommon in other parts of the country from time-to-time, primary attributed to food poisoning outbreaks [29]. Letospirosis shows a change in incidence fro m late 2007 forward with higher incidence seen predominately in Matara and Moneragala. However, there is an apparent ongoing change over the last 4 years of the study. Most notably was Dengue fever which clearly had a significantly different incidence in 2009-2010. The increase was linked to population density with higher density districts suffering greater incidence of infection. Although not available at a resolution necessary for analysis it appears the period of high Dengue fever incidence was co-incident with a period of high rainfall. This is consistent with the causative agent (and host propagation) as well as the historical incidence patterns of Dengue Fever. It is noted (consistent with the disease history) that poverty was not a driver of increased incidence. Leptospirosis is identified as the most widespread zoonotic disease in the world [30]. The first confirmed case of th is condition was reported in Sri Lanka in 1959 [31]. And it became a notifiable disease in Sri Lan ka in 1991 and it is predominantly associated with paddy farming [11]. Rodents and small mammals that could harbour Leptospira is conspicuous in an around rice fields and farming households [11]. Rapid unplanned urbanization has resulted in not only wild and domesticated animals to come into close contact and proliferation of rodent and human populations. Against this backdrop, disease notification data demonstrates a steady increase in reporting over the last two decades which have been attributed to increased incidence, reporting or both [11]. Leptospirosis outbreak emerged in latter part of 2007 and early part of 2008 wh ich resulted in substantial morb idity and mortality [10,11]. In 2007, clustering of unidentified fever cases and few deaths were reported fro m Matara, Gampaha and Kandy districts and some of these cases were subsequently confirmed as leptospirosis. Unfortunately during the year 2008, Sri Lanka experienced the largest ever outbreak of leptospirosis in the history [10] with reported cases of 35.7 per 100000 and the case fatality rate of 2.8%. It is considered to be one of the largest global leptospirosis outbreaks reported in recent years [32]. Moreover, large areas of west, south and central Sri Lan ka were affected by this outbreak. Despite the correct prediction of the 2008 outbreak by the Epidemiology Un it , there was inevitable delays in imp lementation of optimal strategies which could possibly have minimized the early deaths and even prevented the progression of the outbreak attributed to inherent
95
limitat ions of existed paper-based notification system as mentioned previously[11]. Further compounding the issue laboratory confirmat ion of leptospirosis is not routinely available in Sri Lanka, and the diagnosis of reported cases was on the basis of clinical features such as fever with chills, headache, severe muscle tenderness especially calf muscle, men ingitis, alteration of consciousness, conjunctival suffusion, dry cough or haemoptysis [10]. Nevertheless, the clinical d iagnosis of leptospirosis could be inaccurate as there are common clinical features of other tropical diseases [10]. Hence, less than 10% of cases due to lack of diagnostic capacity [10]. The mapping of incidence fro m month to month (only quarter data reported in this study) clearly highlights the opportunity to get early warn ing of outbreaks and the ability to target preventive amelioration to hot-spots. The application of GIS technology to the near real-t ime national reporting of data provides an opportunity for the health system of Sri Lanka to be prepared for outbreaks. Such applications have been successfully used to develop models to predict expected malaria incidence in selected regions of India and China based on historical malaria epidemics and coupled with weather factors at one month lag [24,25,26]. The examp le maps developed for this research show clear density indicators as well as chronologic changes in incidence. The key is the application of technology to display the data in a form that immediately h ighlights the areas of growing risk. There are many strengths and limitations of the notifiable disease surveillance system in Sri Lan ka as reported by a joint assessment report of the Regional Office South East Asia, World Health Organizat ion in 2004 [12]. Accordingly Sri Lan ka has a good surveillance system in p lace [12]. Th is, coupled with the existence of a competent and well-staffed Ep idemiology Unit, is a major strength and a sound base from which one can expect to progress to a strong, effective and integrated surveillance system. Also, an extremely positive aspect is the availability of a legal framework, namely the Quarantine and Prevention of Diseases Ordinance. Obvious limitations are identified as by design the current surveillance plan in Sri Lanka does not routinely capture morbid ity data fro m outpatient departments (OPD) and clin ics. Moreover, there is also no planned routine case-detection in the field. Ho wever, the Public Health Inspectors (PHIs) do cover field cases as well when investigating all reported cases. The current system will therefore only pick up cases that are severe enough to be admitted into a hospital, and a few cases from the field when PHIs detect them during field investigation. Fro m the inpatients too, a considerable proportion of the cases diagnosed as having any one of the notifiable diseases do not find their way into the notification system. This may vary from disease to disease and from one level of health facility to another. Another important shortcoming is the non-availability of most of the surveillance-related information fro m the private sector and other systems of practice of med icine such as Ayurweda. Another limitat ion is the possibility of,, mu ltip licities of reporting channels [12]. Th is has a potential for duplication if care is not taken to link reports with their respective sources. While for practical purposes duplication may not be important, or may even act as a safeguard against missing any case, it does involve an unnecessary effort. However, such duplicate data are cleaned and corrected at the central Ep idemio logy Unit.
96
V. Conclusion In conclusion, our findings demonstrated spatio-temporal trends in the most common notifiable diseases in Sri Lanka: Dengue, leptospirosis and dysentery. There are clear trends with regards to these conditions. Increasing incidence of dengue, two peaks in dysentery that rapidly arose and then disappeared in the districts of Trinco malee (2009) and Vavuniya (2011) otherwise smaller apparently random spikes in incidence were seen across the country and Letospirosis demonstrating a change in incidence fro m late 2007 forward with higher incidence seen predominately in Matara and Moneragaia. Evidencebased, timely decision making is pivotal to prevent and control the burden of notifiable diseases thus necessitating a functional surveillance system. Moreover, early recognition of impending out breaks followed by rapid response is at the cornerstone for controlling communicab le diseases. Chronologic and Geographic shifts in notifiable disease patterns can be identified though the application of modern Geographic Informat ion Systems. The analysis presented describes in high-fidelity the outbreaks for three common diseases for Sri Lanka over an 8 year period. The addition of further data inputs (eg weather data) would allow the models to be more predictive of outbreaks and would assist in resource allocation and planning aimed at mit igating their detrimental effects to country’s health care system and growing economy.
References [1] World Health Organization, Global Alert and Response http://www. who.int/csr/en/ accessed March 2013. [2] World Health Organization, The Weekly Epidemiological Record (WER) http://www.who.int/wer/en/ accessed March 2013. [3] Zaidi AKM, Awasthi S, de Silva HJ. Burden of infectious diseases in South Asia. BMJ 2004;328,811-815. [4] Calain P. Exploring the international arena of global public health surveillance. Health Policy Plann 2007; 22:2-12. [5] Environmental System Research Institute Inc. Introduction to arc view GI S: two-day course notebook with exercises and training data.Redlands.Calif.1998, p 1-3.. [6] Boulders R. Research protocol:EB-GIS4HEALTHUK foundation. Evidence-based and ontology-based framework of modular reusable models for UK/NIHS health and healthcare GIS applications. Int J Health Geographics 4:2 (2005) soi 10.1186/1476-072x4-2.Online.Available from http://awkward.electromyographic/content/4/12 Accessed 10 /March 2013. [7] Population census and central bank Sri Lanka complete the reference. http://www.statistics.gov.lk/PopHouSat/CPH2011/Pages/sm/CPH%202011_R1.pdf accessed March 2013. [8] Dye C, Mertens T, Hirnschall G, Mpanju-Shumbusho W, Newman RD, Raviglione MC, Savioli L, Nakatani H. WHO and the future of disease control programmes. Lancet. 2013;381:413-8. [9] Gupta E, Dar L, Kapoor G, Broor S. The changing epidemiology of dengue in Delhi, India. Virol J. 2006; 3:92. [10] Agampodi S, Peacock SJ, T hevanesam V. The potential emergence of leptospirosis in Sri Lanka. Lancet Infect Dis 2009;9:524-526. [11] Agampodi SB, Peacock SJ, Thevanesam V, Nugegoda DB et al. Leptospirosis outbreak in Sri Lanka in 2008: Lessons for assessing the global burden of disease. Am J Trop Med 2011; 85:471-478. [12] Comprehensive Assessment of National Surveillance System in Sri Lanka. Joint Assessment Report 4-13 March. World Health Organization, Regional Office for South East Asia, New Delhi February 2004. [13] Epidemiology unit http://www.epid.gov.lk/web/index.php?option=com_casesanddeaths&Itemid=448&lang=en accessed January-March 2013.
97
[14] Surveillance Case Definition for Notifiable Diseases in Sri Lanka. Epidemiology Unit, Ministry of Health Sri Lanka, 2000 accessed March 2013. [15] Department of Census and Statistics - Sri Lanka. http://www.statistics.gov.lk/PopHouSat/Pop_Chra.asp accessed March 2013. [16] DIVA-GIS Geographic boundary files. http://www.diva-gis.org/datadown accessed January-March 2013. [17] Centre for Disease Control. http://www.cdc.gov.tw/uploads/files/e50affde-4ace-4b34-b934-9422b928db97.pdf accessed March 2013. [18] World Health Organization. Resolutions and decisions of the 48 th World Health Assembly: Revision and updating of the International Health Regulations. WHA 48.7; Communicable disease prevention and control: new emerging and re-emerging infectious diseases, WHA 48.13.Geneva: World Health Organization;1995. [19] World Health Organization. An integrated approach to communicable disease Surveillance. WER 2000; 75:1-7. [20] Chandrasekar K, Use of Communication Technology in communicable disease surveillance. Sri Lanka J of Bio-medical Informatics 2 (2) (2010), 41-52. DOI:http://dx.doi.org/10.4038/sljbmi.v2i2.3541. [21] Peate I. Infectious diseases: statutory notification and surveillance. Br J Nurs. 1999;8:943-7. [22] Seneviratne SL, Gunatillaka SB, de silva HJ. Reporting notifiable diseases: methods for improvement, attitudes and community outcome. Trans R Soc Trop Med Hyg. 1997;91:135-7. [23] Sampath WGC, Waidyanatha N, Ariyaratne V, Rthnayake RMSK, Hemachandra PS, Edirisinghe EALCK. Real-time bio-surveillance pilot programme in Sri Lanka: Lessons learned. Sri Lanka J of Bio-medical Informatics 2010;2:139-154. [24] Chalga MS, Dixit AK, Shah B, Bhati AS. Real time health informatics system for early detection and monitoring of malaria in desert district, Jaisalmers, India. J of Health Informatics in Developing Countries 2011:XX 286-298. [25] Adebayo PI, Nneoma O, Rotimi EA. Spatial Predictive Model for Malaria in Nigeria. J of Health Informatics in Developing Countries 2009; 3(2):31-36. [26] Zhang Y, Liu QY, Luan RS, Liu XB, Zhou GC et al. Spatial-temporal analysis of malaria and the effect of environmental factors on its incidence in Youngcheng, China, 2006-2010. BMC Public Health 2012:12; 544. [27] World Health Organization. Dengue: Guidelines for diagnosis, treatment, prevention and control. Available at: http://whqlibdoc.who.int/publications/2009/9789241547871_eng.pdf. Accessed June 13, 2012. [28] Rajapakse S, Rodrigo C, Rajapakse S. T reatment of dengue fever: review. Infection and drug resistance 2012;5:103-112. [29] Communicable disease epidemiological profile Sri Lanka. dysenteryhttp://whqlibdoc.who.int/hq/2010/WHO_HSE_GAR_DCE_2010.7_eng.pdf accessed March 2013. [30] WER: Leptospirosis worldwide, 1999. Wkly Epidemiol Rec 1999, 74:237-242. [31] Rajasuriya K, Somasunderam M, Nagaratnam N. Leptospirosis in Ceylon. J T rop Med Hyg 1959,62:205210. [32] Epidemiological Unit. Selected notifiable diseases reported by Medical Officers of Health. Weekly Epidemiological Report 36, 2009.
98