Jan 20, 2012 - 5 Optical fiber gratings for physical and biochemical sensing 139 ..... electromagnetic interference (EMI) and radio frequency interference (RFI) as ...... TRONO C, RIFRATTOMETRO IN FIBRA OTTICA BASATO SU RETI-.
UNIVERSITÀ DEGLI STUDI DI SIENA
Facoltà di Ingegneria
Dipartimento di Ingegneria dell'Informazione
Design, Development and Test of a Refractometer Based on Optical Fiber Gratings: Physical and Biochemical Applications Francesco Chiavaioli Ph.D Thesis in Information Engineering
Supervisors Prof. Valerio Vignoli Prof. Massimo Brenci
Examination Commitee Prof. Elena Biagi Prof. Sabina Merlo Prof. Marco Mugnaini
Thesis reviewer Dr. Cosimo Trono
Siena January 20, 2012
To my mother Nadia and my father Elvio
iii
Epigraph A life without research is not worthy of being lived for man Platone
Apologia di Socrate (cap. 28)
The beauty does not spring up from wealth, but by virtue. Research leads to truth Socrate
Who are we and what are we looking for? The answer will be revealed through research
v
Contents
Acknowledgements
xxiii
Glossary
xxv
Abstract
xxvii
1 Introduction
1
1.1
Motivation and approaches
. . . . . . . . . . . . . . . . . . . .
1
1.2
Application to sensor based on optical �ber grating . . . . . . .
3
1.3
Contributions and outline
. . . . . . . . . . . . . . . . . . . . .
5
1.4
Istruzioni per la stampa
. . . . . . . . . . . . . . . . . . . . . .
7
I Theory, manufacturing and applications of optical �ber gratings 2 General concepts about optical �ber gratings
9 11
2.1
Fundamentals . . . . . . . . . . . . . . . . . . . . . . . . . . . .
11
2.2
Di�raction gratings . . . . . . . . . . . . . . . . . . . . . . . . .
16
2.3
Towards optical �ber gratings . . . . . . . . . . . . . . . . . . .
20
2.3.1
21
Graphical method
. . . . . . . . . . . . . . . . . . . . .
3 Theory of optical �ber gratings 3.1
Basics about theoretical perspectives of OFGs . . . . . . . . . . vii
27 27
Contents
3.2
Study of OFGs by means of the coupled mode theory (CMT)
.
29
3.2.1
Optical characteristics of FBGs . . . . . . . . . . . . . .
58
3.2.2
Optical characteristics of LPGs . . . . . . . . . . . . . .
63
3.2.3
Hybrid coupled mode theory
65
. . . . . . . . . . . . . . .
3.3
Study of OFGs by means of the transfer matrix method (TMM)
68
3.4
Study of OFGs by means of the �nite element method (FEM) .
79
4 Manufacturing of optical �ber gratings
83
4.1
Basics about gratings manufacturing . . . . . . . . . . . . . . .
83
4.2
Fiber Bragg gratings . . . . . . . . . . . . . . . . . . . . . . . .
86
4.3
4.2.1
Internal writing technique . . . . . . . . . . . . . . . . .
88
4.2.2
Two-beam interferometer techniques
. . . . . . . . . . .
91
4.2.3
Phase mask techniques . . . . . . . . . . . . . . . . . . .
96
Long period gratings . . . . . . . . . . . . . . . . . . . . . . . . 100 4.3.1
Photochemical or UV methods
4.3.2
Non-photochemical or non-UV methods
. . . . . . . . . . . . . . 103 . . . . . . . . . 113
5 Optical �ber gratings for physical and biochemical sensing 139 5.1
5.2
5.3
5.4
Theory of optical �ber gratings for physical sensing . . . . . . . 139 5.1.1
Fiber Bragg gratings . . . . . . . . . . . . . . . . . . . . 140
5.1.2
Long period gratings . . . . . . . . . . . . . . . . . . . . 146
Applications of optical �ber gratings for physical sensing . . . . 165 5.2.1
Fiber Bragg gratings . . . . . . . . . . . . . . . . . . . . 166
5.2.2
Long period gratings . . . . . . . . . . . . . . . . . . . . 170
Theory of optical �ber gratings for biochemical sensing . . . . . 175 5.3.1
Fiber Bragg gratings . . . . . . . . . . . . . . . . . . . . 176
5.3.2
Long period gratings . . . . . . . . . . . . . . . . . . . . 178
Applications of optical �ber gratings for biochemical sensing . . 191 5.4.1
Fiber Bragg gratings . . . . . . . . . . . . . . . . . . . . 194
5.4.2
Long period gratings . . . . . . . . . . . . . . . . . . . . 196
II Flow cell for refractive index measurements: design, development and test
199
6 Experimental setup for refractive index measurements
201
viii
Contents
6.1
Basic concepts about the refractive index measurements
. . . . 201
6.2
Methodology of the proposed refractive index sensor
6.3
Thermo-stabilized �ow cell . . . . . . . . . . . . . . . . . . . . . 205
6.4
Manufacturing of the gratings . . . . . . . . . . . . . . . . . . . 209
6.5
Interrogation system and data processing
6.6
Fluidics system and chemicals . . . . . . . . . . . . . . . . . . . 233
. . . . . . 203
. . . . . . . . . . . . 230
7 Compensated refractive index measurement for mixtures 7.1
7.2
235
Characterization of the sensor's cross-sensitivities . . . . . . . . 235 7.1.1
Strain characterization . . . . . . . . . . . . . . . . . . . 235
7.1.2
Temperature characterization . . . . . . . . . . . . . . . 235
7.1.3
Long-term stability of the sensor
. . . . . . . . . . . . . 235
Refractive index measurement . . . . . . . . . . . . . . . . . . . 235
8 Preliminary biochemical measurement on antibody-antigen bioassay 237 8.1
An overview about antibody-antigen bioassay
8.2
Materials and methods . . . . . . . . . . . . . . . . . . . . . . . 237
8.3
. . . . . . . . . . 237
8.2.1
Reagents
. . . . . . . . . . . . . . . . . . . . . . . . . . 237
8.2.2
Chemical treatment of the sensor and immunoassay . . . 237
Biochemical measurement on an antibody-antigen bioassay . . . 238
III Conclusions
239
9 Conclusions
241
9.1
Summary and contributions . . . . . . . . . . . . . . . . . . . . 241
9.2
Tracks for future works . . . . . . . . . . . . . . . . . . . . . . . 241
Bibliography
243
Index
267
Publications List
273
ix
List of Figures
2.1
Optical �ber sensors classi�cation:
extrinsic OFS on the left
and intrinsic OFS on the right . . . . . . . . . . . . . . . . . . . 2.2
Optical �ber gratings: physical depiction (a) and refractive index pro�le of the �ber core (b)
2.3
. . . . . . . . . . . . . . . . . .
. . . . . . . .
14
Long period grating: depiction of light coupling and propagation with the distinctive spectra (Λ not in scale)
2.5
13
Fiber Bragg grating: depiction of light coupling and propagation with the distinctive spectra (Λ not in scale)
2.4
12
Di�raction grating:
. . . . . . . .
15
an example of re�ection grating (a) and
transmission grating (b)
. . . . . . . . . . . . . . . . . . . . . .
17
2.6
Di�raction e�ect of a grating using wavefronts . . . . . . . . . .
18
2.7
Di�raction of a light wave by a grating . . . . . . . . . . . . . .
20
2.8
Fiber Bragg grating: illustration of coupling between the fundamental core mode and its respective counter-propagating core mode by means of the ray-optic depiction (a) and its
2.9
β -plot
(b)
22
Long period grating: illustration of coupling between the fundamental core mode and the �rst forward-propagating cladding mode by means of the ray-optic depiction (a) and its
3.1
β -plot
(b)
Step-index single mode �ber: geometry (a) and refractive index distribution (b) . . . . . . . . . . . . . . . . . . . . . . . . . . .
3.2
24
28
Local intensity of light as a function of radial position for the �rst four
l=1
cladding modes (p xi
= 1, 2, 3, 4)
. . . . . . . . . .
37
3.3
Normalized coupling constant for
l = 1
cladding modes in a
step-index single-mode �ber. The black circles are odd cladding modes, whereas the white circles are even cladding modes 3.4
. . .
42
Phase-matching conditions in a �ber Bragg grating (FBG) with a period
Λ.
The counter-propagating coupling can occur be-
tween (top to bottom, longest to shortest wavelength) oppositely traveling core modes, the core mode and a cladding mode and the core mode and radiation modes 3.5
. . . . . . . . . . . . .
45
Phase-matching conditions in a long period grating (LPG) with a period
Λ.
The forward-propagating coupling can occur be-
tween (top to bottom, longest to shortest wavelength) the core mode and a cladding mode and the core mode and radiation modes 3.6
. . . . . . . . . . . . . . . . . . . . . . . . . . . . . . . .
47
Experimentally measured transmission spectrum of a typical �ber Bragg grating in a step-index SMF. The deepest peak on the right represents the core-mode core-mode counter-propagating coupling, whereas the other peaks represent the core-mode claddingmode counter-propagating couplings
3.7
. . . . . . . . . . . . . . .
49
Experimentally measured transmission spectrum of a LPG in a step-index SMF with
Λ = 410µm.
The six peaks represent the
coupling between the fundamental core mode and the �rst six odd cladding modes 3.8
. . . . . . . . . . . . . . . . . . . . . . . .
50
LPG phase-matching conditions of cladding modes for a stepindex SMF. Low-order cladding modes are on the right, whereas high-order cladding modes are on the left
3.9
. . . . . . . . . . . .
LPG phase-matching conditions of low-order (p
= 1, 3, ...19)
cladding modes for a Boron-Germanium co-doped �ber . . . . . 3.10 LPG phase-matching conditions of high-order (p
54
55
= 21, 23, ...39)
cladding modes for a Boron-Germanium co-doped �ber . . . . . 3.11 LPG phase-matching conditions of very-high-order (p
56
= 41, 43, ...59)
cladding modes for a Boron-Germanium co-doped �ber . . . . .
57
3.12 FBG re�ection spectrum as a function of normalized resonance wavelength in uniform gratings with
κ bL=8
κ bL=2
(dashed line) and
(solid line) . . . . . . . . . . . . . . . . . . . . . . . . .
59
3.13 FBG re�ection spectra: 10 mm-long gratings with di�erent values of induced-index change stant induced-index change
∆ ncore (a) and gratings of a con−3 RIU with of ∆ ncore = 5 × 10
di�erent lengths and resonance wavelengths (b) . . . . . . . . .
61
3.14 Measured (dots) and theoretically calculated (solid line) re�ection spectrum for a 1 mm-long uniform FBG with
κ b L = 1.64
.
62
κ b L = 0.39 . . . S (z) due to an exposure
66
. . . . . . . . . . . . . . . . . . . . . . . .
74
3.15 Measured (dots) and theoretically calculated (solid line) transmission spectrum for a 50 mm-long LPG with 3.16 Longitudinal refractive index variation function of width
W
3.17 Azimuthal refractive index variation
P (r, φ)
divided into ring
sectors . . . . . . . . . . . . . . . . . . . . . . . . . . . . . . . . 3.18 Sketch of periodic grating structure of total length and period 4.1
Λ
75
L = NΛ
with input and output unperturbed regions
. . .
81
Common types of �ber gratings classi�ed by the variation of the induced-index change along the �ber axis: (a) uniform, (b) Gaussian-apodized, (c) raised-cosine-apodized, (d) chirped, (e) discrete phase-shift and (f ) superstructure . . . . . . . . . . . .
85
4.2
Blazed �ber Bragg grating: physical depiction . . . . . . . . . .
87
4.3
Chirped �ber Bragg grating: physical depiction . . . . . . . . .
87
4.4
Schematic of the original experimental setup used for writing �ber Bragg gratings within the optical �bers [1] . . . . . . . . .
4.5
Time evolution of re�ectivity of a 1 m-long Ge-doped-core optical �ber (NA = 0.1 and core diameter = 2.5
µm).
Insets (a) and
(b) show typical FBG re�ection and transmission, respectively . 4.6
89
90
Schematic of the original experimental setup used for writing �ber Bragg gratings in optical �bers by means of transverse holographic method [2] . . . . . . . . . . . . . . . . . . . . . . .
4.7
Sketch of the experimental setup used for writing �ber Bragg gratings by means of transverse holographic method [3] . . . . .
4.8
93
Sketch of the experimental setup used for writing �ber Bragg gratings by means of source-tunable interferometer method [3] .
4.9
92
95
Sketch of the phase mask used for writing �ber Bragg gratings by means of phase mask technique
. . . . . . . . . . . . . . . .
97
4.10 Schematic of modi�ed phase mask technique used for writing �ber Bragg gratings
. . . . . . . . . . . . . . . . . . . . . . . .
99
4.11 Absorption spectrum of 3.5 mol% Ge-doped fused silica [4] compared with that of pure fused silica . . . . . . . . . . . . . . . . 101 4.12 Schematic of photoexcitation pathways for di�erent LPG writing techniques in standard optical �ber: the conventional singlephoton (5 eV) and three multi-photon approaches [4] . . . . . . 102 4.13 Experimental setup for writing LPGs by means of an amplitude mask . . . . . . . . . . . . . . . . . . . . . . . . . . . . . . . . . 104 4.14 Time evolution of a LPG with period of intervals [5]
Λ=
474
µm
at 1-min
. . . . . . . . . . . . . . . . . . . . . . . . . . . . . 106
4.15 Transmission spectrum of a 4cm-long LPG with a period of 200
µm
written in 10 mol% Ge-doped �ber [6] . . . . . . . . . . . . 108
4.16 Dependence of induced refractive index on near-UV power density [6] . . . . . . . . . . . . . . . . . . . . . . . . . . . . . . . . 109 4.17 Schematic of experimental setup for point-to-point LPGs manufacturing with high-intensity femtosecond UV and near-UV laser pulses [4]
. . . . . . . . . . . . . . . . . . . . . . . . . . . 110
4.18 Photograph of the LPG section written by means of pointto-point technique based on high-intensity femtosecond laser pulses at a wavelength of 352 nm [4]
. . . . . . . . . . . . . . . 113
4.19 Experimental setup for LPGs manufacturing by means of a point-to-point non-UV technique based on a IR laser source [7]. ND, neutral density. CCD, charge-coupled device . . . . . . . . 115 4.20 Transmission spectrum of a 29.9 mm-long LPG with a period
Λ=
460
µm
[7] . . . . . . . . . . . . . . . . . . . . . . . . . . . 117
4.21 Transmission spectrum of LPG written in non-H2 -loaded and H2 -loaded dispersion-shifted �bers [8] . . . . . . . . . . . . . . . 119 4.22 Fabrication apparatus for writing LPGs by point-to-point CO2 laser exposure [9] . . . . . . . . . . . . . . . . . . . . . . . . . . 120 4.23 Fabrication apparatus for writing LPGs by electrical discharges produced by a commercial splicer . . . . . . . . . . . . . . . . . 122 4.24 Transmission spectra of three di�erent LPGs with the same period of 540
µm
[10] . . . . . . . . . . . . . . . . . . . . . . . . 124
4.25 The in�uence of di�erent axial tension (GB , GS and GSS ) on grating inscription [10] . . . . . . . . . . . . . . . . . . . . . . . 125 4.26 Photograph of the arc discharge showing its asymmetry [11] . . 126 4.27 Photograph of the asymmetric deformation of a silica capillary (56
µm
/ 125
µm)
submitted to an arc discharge [11] . . . . . . 127
4.28 Photograph made by the transmission optical microscope Nikon Optiphot of an electric arc-induced LPG written in a standard step-index SMF-28 optical �ber . . . . . . . . . . . . . . . . . . 129 4.29 Schematic of ion implantation technique with a metal amplitude mask [12]
. . . . . . . . . . . . . . . . . . . . . . . . . . . . . . 131
4.30 Photograph (a) and sketch (b) of the cross-section of the He-ion implanted optical �ber. Sketch (c) of the cross-section of the optical �ber etched with hydro�uoric acid [12] . . . . . . . . . . 132 4.31 Transmission spectrum of the He-ion implanted etched optical �ber [12] . . . . . . . . . . . . . . . . . . . . . . . . . . . . . . . 133 4.32 Side view of a mechanically induced long period grating with period
Λ
[13]
. . . . . . . . . . . . . . . . . . . . . . . . . . . . 134
4.33 An example of periodically grooved plate used to induce LPGs mechanically
. . . . . . . . . . . . . . . . . . . . . . . . . . . . 135
4.34 Transmission spectra of a grating with period
Λ =
712
µm
measured for an applied pressure increasing from p1 to p5 [13] . 136
5.1
Typical FBG characterization in axial strain of a standard Corning SMF-28 optical �ber . . . . . . . . . . . . . . . . . . . . . . 143
5.2
Typical FBG characterization in temperature of a standard Corning SMF-28 optical �ber
5.3
. . . . . . . . . . . . . . . . . . . 146
Di�erence in group RI between the fundamental core mode and each of the �rst 30 cladding modes (from
p = 1 to p = 59, only a
few are numbered) as a function of LPG resonance wavelength, calculated for BGe co-doped optical �ber. points of the curves with the
∆ ng = 0
The intersection
axis correspond to the
turn around points. In the shaded region,
|e γ| > 5
. . . . . . . . 151
5.4
Shift in the resonance wavelengths of four attenuation bands, A−D, as a function of applied strain for a LPG. The dashed line is the strain-induced wavelength shift for a FBG fabricated at 1550 nm for comparison [14]
5.5
. . . . . . . . . . . . . . . . . . 155
Shift in the resonance wavelengths of four attenuation bands, A−D, as a function of temperature for a LPG. The dashed line is the temperature-induced wavelength shift for a FBG fabricated at 1550 nm for comparison [14] . . . . . . . . . . . . . . . 158
5.6
Experimental shift of the resonance wavelength in four attenuation bands (from curve A to curve D) of a long period grating as a function of the surrounding refractive index [14]
5.7
. . . . . . 161
Plot of the shift of the resonance wavelength (a) and the minimum transmission value of the related attenuation band (b) as a function of the refractive index of the medium surrounding a long period grating with a period 400 borongermanium co-doped optical �ber [15]
5.8
µm
written in a
. . . . . . . . . . 163
Schematic of an optical add/drop multiplexer based on a �ber Bragg grating . . . . . . . . . . . . . . . . . . . . . . . . . . . . 166
5.9
Schematic of an optical wavelength division multiplexing system based on a �ber Bragg grating . . . . . . . . . . . . . . . . 167
5.10 Schematic of an optical dispersion compensation system based on a chirped �ber Bragg grating . . . . . . . . . . . . . . . . . . 168 5.11 E�ect of gain-�attening (�lled circles) using LPGs on the gain of erbium doped �ber ampli�ers (solid curve) [5]
. . . . . . . . 170
5.12 Principle of operation of the liquid level sensor based on an LPG: (a) schematic of the LPG and (b) transmission spectrum of the expected split in the LPG attenuation band [16] . . . . . 171 5.13 Basic con�gurations of modi�ed �ber Bragg grating to be used as surrounding refractive index sensor: tilted �ber Bragg grating (a) and etched �ber Bragg grating (b) [17] . . . . . . . . . . 177 5.14 Schematic of a thin-�lm coated LPG structure (a) and the corresponding refractive index pro�le (b) [18] . . . . . . . . . . . . 180
5.15 Experimental shift of the resonance wavelengths of the 9 (�lled circles) and
p =
p =
11 (�lled squares) cladding modes,
plotted as a function of the overlay thickness [19]
. . . . . . . . 183
5.16 E�ective refractive index of cladding modes as a function of the overlay thickness [20] . . . . . . . . . . . . . . . . . . . . . . . . 185 5.17 Shift of the resonance wavelength as a function of the overlay thickness for di�erent value of the refractive index of overlay material: �lled triangles 2 RIU, �lled rhombuses 1.7 RIU and �lled squares 1.57 RIU [21]
. . . . . . . . . . . . . . . . . . . . 186
5.18 Optimum overlay thickness for the
p=
15 cladding mode as a
function of the overlay refractive index [22] 5.19 Shift of the resonance wavelength in the
. . . . . . . . . . . 188
p = 5 cladding mode as
a function of the overlay thickness for di�erent overlay refractive index when the coated LPG is placed in air (nsur 5.20 LPG transmission spectra of the
= 1)
[20] . . . 189
p = 9 cladding mode for three
di�erent surrounding refractive indices without the overlay (a) and with an overlay characterized by a thickness of 159 nm and a refractive index of 1.67 RIU [20] . . . . . . . . . . . . . . . . . 190 5.21 Schematic representation of a biosensor.
The di�erent bio-
recognition elements and transducers are depicted in the �gure [23]
. . . . . . . . . . . . . . . . . . . . . . . . . . . . . . . 192
5.22 Schematic representation of (A) hybrid sensor and (B) implanted hybrid sensor [24] . . . . . . . . . . . . . . . . . . . . . . . . . . 193 5.23 (A) Fiber optic SPR probe; (B) schematic representation of the system setup; (C) overview of the immunoassay strategies on the �ber optic SPR biosensor; (D) the spectrum dips in PBS bu�er after 10 min incubation of the SPR �ber in: a negative control sample (blue dip), a sample containing the antigen (red dip), a sample containing the antigen subsequently labeled with antibody linked nanobeads (black dip) [25] . . . . . . . . . . . . 195 6.1
Sketch of the manufactured �ow cell: longitudinal cross−section (a) and top view (b) [26] . . . . . . . . . . . . . . . . . . . . . . 205
6.2
A picture of the developed �ow cell [26]
6.3
A side-view picture of the �ow cell
. . . . . . . . . . . . . 206
. . . . . . . . . . . . . . . . 208
6.4
Stabilization e�ect on the LPG resonance wavelength by means of the Peltier cells . . . . . . . . . . . . . . . . . . . . . . . . . . 209
6.5
Refractive index pro�le of B-Ge co-doped step-index singlemode Fibercore PS1250/1500 �ber
6.6
. . . . . . . . . . . . . . . . 211
Schematic of the manufacturing setup for FBGs. SLD, superluminescent light diode . . . . . . . . . . . . . . . . . . . . . . . 212
6.7
Photograph of our manufacturing setup for FBGs . . . . . . . . 214
6.8
Detail of the �ber clamping points and the �ber positioning mechanism of our manufacturing setup for FBGs
6.9
. . . . . . . . 216
Schematic of a typical monochromator placed inside an optical spectrum analyzer for the spectral analysis of an optical signal . 217
6.10 Detail of the �ber clamping points and the �ber positioning mechanism of our manufacturing setup for LPGs
. . . . . . . . 219
6.11 Detail of the schematic of the manufacturing setup for LPGs . . 220 6.12 Photograph taken with transmission optic microscope Nikon Optiphot of a LPG written by means of the point-to-point technique with KrF excimer laser
. . . . . . . . . . . . . . . . . . . 221
6.13 Transmission spectra of the manufactured LPG at di�erent scans.
Each curve is labeled with a di�erent color (see the
label in the graph)
. . . . . . . . . . . . . . . . . . . . . . . . . 222
6.14 Transmission spectra of the manufactured LPG at di�erent steps. Each curve is labeled with a di�erent color (see the label in the graph)
. . . . . . . . . . . . . . . . . . . . . . . . . . . . 224
6.15 Comparison between the two distinct manufacturing approaches. The red curve refers to the �rst approach (many scans-few shots), whereas the blue curve refers to the second approach (one scan-many shots)
. . . . . . . . . . . . . . . . . . . . . . . 226
6.16 Transmission spectrum of the �ber with the FBG loss peak on the left and the LPG loss peak on the right.
The green-
highlighted distance between the two resonance bands is about 33 nm
. . . . . . . . . . . . . . . . . . . . . . . . . . . . . . . . 228
6.17 Theoretical prediction of the LPG optical parameters . . . . . . 229 6.18 Front panel of the developed NI CVI program for the real time monitoring of the attenuation bands of the two gratings
. . . . 232
6.19 Comprehensive block diagram of the refractive index measurements
. . . . . . . . . . . . . . . . . . . . . . . . . . . . . . . . 234
List of Tables
4.1
Comparison between the experimental data on LPG inscription e�ciency in a hydrogen-loaded Corning SMF-28 �ber for pointto-point technique at di�erent source wavelengths (LPGs of the same period, 300
µm,
and of the same length, 2 cm). . . . . . . 112
5.1
Comparison between the experimental data on FBG strain sen-
5.2
Comparison between the experimental data on FBG tempera-
sitivity at di�erent wavelengths. . . . . . . . . . . . . . . . . . . 142
ture sensitivity at di�erent wavelengths. 6.1
. . . . . . . . . . . . . 145
Used initial values of the �tting parameters of the two gratings. 231
xxi
Acknowledgements
If I have seen farther than others, it is because I was standing on the shoulders of giants. Albert Einstein
At the end of my work, there are many People to thank for helping me during these three years of PhD. First of all, I wish to thank my supervisors, Prof. Valerio Vignoli and Prof. Massimo Brenci, for creating this opportunity to study exciting and fascinating research �elds in optical �ber sensor. I am very thankful for the guidance, advices and encouragements they provided since the beginning of my PhD. Cosimo (+reviewer) Francesco e Ambra Ada e Marco Franco e Simone ev:Tre bariste siena e Tre girls cnr It was a pleasure to work at the Laboratory of Telematics and Telecommunications and I'd like to thank all the colleagues of the Visual Information Processing and Protection group, for the interesting discussions and, above all, for their friendship... I am very grateful to the members of my thesis committee, Prof. Elena Biagi, Prof. Sabina Merlo and Prof. Marco Mugnaini, for accepting to be part of the committee. ...I would also like to express my gratitude to the reviewers of the thesis, Prof. Patrick Le Callet and Prof. Pedro Comesana Alfaro, for their valuable comments and suggestions... xxiii
Last but most important, I wish to thank my mother Nadia and my father Elvio for their everlasting love and support. From my heart, I love you! Francesco Chiavaioli Siena 13/01/12
Glossary
AFM
Atomic-Force Microscope
Extrinsic Optical Fiber
Sensor
BRE
Biological Recognition Element
CGN CW
EOFS
Colloidal Gold Nanoparticle
Continuous Wave
FBG
Fiber Bragg Grating
FEM
Finite Element Method
FOB
Fiber Optic Biosensor
FWHM
CMT
Coupled Mode Theory
DNA
DeoxyriboNucleic acid
GO
DNP
DiNitroPhenol
GODC
DBR
Distributed Bragg Re�ector
DSC ERI
Dual Shaped Core E�ective Refractive Index
EMI
ElectroMagnetic Interference
ESA
Electrostatic Self-Assembly
EFBG
Etched Fiber Bragg Grating
Full Width at Half Maxi-
mum Geometrical Optics Germanium-Oxygen-De�cient
Center
HRI
High Refractive Index
IR
InfraRed
IC
Interferometric Con�guration
IOFS
Intrinsic Optical Fiber
Sensor
LB xxv
Langmuir-Blodgett
LED
Light Emitting Diode
PVC
LOD
Limit of Detection
RFI
LP
Linearly Polarized
LSPCF
Localized Surface Plasmon
Coupled Fluorescence
LPG
Long Period Grating
NMR NA
Nuclear Magnetic Resonance
Numerical Aperture
OFS
Optical Fiber Sensor
RI
PolyVinyl Chloride Radio Frequency Interference
Refractive Index
RIU
Refractive Index Unit
SLD
SuperLuminescent Diode
SPR
Surface Plasmon Resonance
SRI
Surrounding Refractive Index
sPS
Syndiotactic PolyStyrene
OFG
Optical Fiber Grating
TEC
ORS
Optical Resonating Structure
TFBG
OSA
Optical Spectrum Analyzer
TIR
ppm
Parts Per Million
TMM
Transfer Matrix Method
TIBC
Transparent In�ux Boundary
PML
Perfectly Matched Layer
PRBC
Condition
PMC PCF
Phase-Matching Condition Photonic Crystal Fiber
Tilted Fiber Bragg Grating
Total Internal Re�ection
Perfectly Re�ecting Bound-
ary
Thermo-Electric Cooler
Condition
TAP UV
Turn Around Point
UltraViolet
VOC
Volatile Organic Compound
Abstract
The important thing is not to stop questioning. Curiosity has its own reason for existing. Albert Einstein
An optical �ber sensing system based on a hybrid cascaded long period grating (LPG) and �ber Bragg grating (FBG) con�guration and a thermo-stabilized �ow cell for refractometric measurements is proposed. The system makes it possible to measure, and thus cancel the LPG cross−sensitivities to strain, temperature and �ber bending by means of an ad-hoc developed methodology. The experimental results show that the proposed system provides satisfactory performances as far as the refractive index sensitivity and resolution are concerned. The maximum sensor sensitivity and resolution are 3120 nm RIU−1 and 2 x 10⁻⁵ RIU, respectively. The whole system, including its �ow cell and the gratings manufacturing, is extensively described, along with the acquisition and processing of data. The stability of the sensor has also been tested for several hours. Finally, the proposed system has been tested for preliminary measurements in the �eld of chemical/biochemical sensing. xxvii
Chapter 1
Introduction Nothing comes from nothing.
1.1 Motivation and approaches
T
he growing need for devices able to carry out fast, reliable and
in situ
measurements in the �eld of physical, chemical and biological sensing is
encouraging researchers to look for new technologies. There is much interest with regards to the refractive index (RI) measurements of liquids, which have been used for many years in the �eld of both the physical sensing and biochemical one. In the former, the optical properties of solutions, mixtures and, in general, any liquid can be achieved by means of RI measurements [27�29]. In the latter, instead, a chance for quantitative measurements of analytes in biological �uids can be o�ered by RI measurements together with the deposition of chemical/biochemical recognition layers on suitable substrates, eg optical �ber. Chemical/biochemical interactions with these layers lead to changes in the RI of the layer itself which can be detected by means of optical methods and which depend on the concentration of the interacting analyte [30,31]. This approach is known as label-free approach, in contrast with the methodology that makes use of luminescent markers chemically bound to recognition layers. Within the label-free approach, surface plasmon resonance (SPR) is unquestionably the most exploited optical approach [32], also because of the
1
presence of SPR-based devices on the market (eg Biacore system) .
Other
1 Biacore systems are used for label-free interaction analysis in real time and allow to char-
acterize molecules in terms of speci�city of their interactions, kinetics and a�nity. A more detailed description is available on this website http://www.biacore.com/lifesciences/ index.html
1. Introduction
2
well-known and fascinating technology platforms are based on the use of interferometric con�gurations (ICs) [33], made both on optical �bers and planar waveguides, and optical resonating structures (ORSs) [34, 35], which can be comparable with SPR in terms of resolution [31].
Within the optical ap-
proach, optical �ber gratings (OFGs) have been recently proposed as tools for chemical and biochemical sensing [36]. These sensors have high sensitivity to the RI of the medium surrounding the �ber cladding, in addition to all the other bene�ts o�ered by optical �ber sensors (OFSs). The main advantages coming from the use of OFGs-based sensor are as follows [37]: they are compact, lightweight and minimally invasive which are key features for use in the biomedical �eld. They can be also used in extreme conditions and hence in the industrial �eld thanks to their strength and toughness. Other distinctive features are the e�ective multiplexing capability on a single �ber network and the easy integration into a wide variety of structures as the signal modulation is spectrally encoded.
It is also important to stress the fact that the
optical modulation of the signal is a wavelength modulation and this implies that the read-out will not a�ected by changes in optical power due to either �ber bending and/or source �uctuations. Moreover, they are immune to both electromagnetic interference (EMI) and radio frequency interference (RFI) as there are no electrical currents �owing at the sensing point. In addiction, there is the expectation that they should be able to be produced at relatively low or competitive cost, often using a range of the technologies that have been �borrowed� from research in the optical communications �eld. Last but not least, they show multifunctional sensing capabilities, ie strain, temperature, �ber bending, surrounding refractive index (SRI), pressure, chemical and biological samples.
This latter feature can be either positive or negative.
In
fact, if we want to measure only the e�ects caused by the measurand of interest, we must bear in mind to design a methodology for eliminating the sensor cross-sensitivities. This key point will be discussed in part II of the present work.
For all the reasons just given, a number of refractometric measurement systems that make use of OFGs have been proposed in the literature relating to physical and biochemical sensing [27, 38�43]. As mentioned above, this kind of sensors show great sensitivity not only to the SRI, but also at the same time to
1.2. Application to sensor based on optical �ber grating
3
temperature, strain and �ber bending. Therefore a number of techniques have been proposed in the past in order to get rid of the �uctuations coming from these causes [14, 43, 44]. The in�uence of the cross-sensitivities can be essential when the refractometric measurement is carried out with the investigated sample �owing within a micro�uidic system, as generally occurs whenever the RI measurement is carried out for chemical/biochemical sensing. Very recently, another interesting optical system for refractive index measurements has been reported, which is based on one−dimensional photonic crystals [45] that are made by electrochemical micromachining of the silicon. Finally, it is worth pointing out a general concept, which, nevertheless, is extremely important, when RI measurements are used for physical sensing, we are talking about bulk or volume measurements because the interaction takes place all around the �ber and hence in the volume of the liquid. When RI measurements are used for biochemical sensing, instead, we are talking about layer or surface measurements because the interaction takes place in the layer/surface that has been deposited on the optical �ber.
1.2 Application to sensor based on optical �ber grating
A
s mentioned in section 1.1, the change of RI induced by a chemical/ biochemical interaction or by physical interaction with a di�erent liquid
surrounding the �ber is the working principle used in the �elds of biochemical and physical sensing. Starting from these considerations, there are two classes of OFGs-based sensors depending on the region where the interaction takes place. In the case of non-coated OFGs, the e�ect takes into account all the volume around the �ber and the transmission spectrum of the �ber is modi�ed by the considered interaction (ie volume measurements). On the other hand, if we consider OFGs on which a layer is deposited onto the grating portion, the interaction takes place within this layer or on its surface (ie surface measurements). In this case, only a portion of the optical radiation traveling along the �ber, which comes out of the �ber through the grating, interacts with the external environment, depending on the optical properties (ie thickness and refractive index) of the deposited layer. There are a lot of application �elds in
1. Introduction
4
which the OFGs-based sensors can be e�ectively used. In this section, a brief overview is given. Therefore it is obvious that, considering also the relative simplicity, the �rst types of sensors were based on volume measurements. One of the �rst examples of OFGs-based sensor is related to the determination of calcium chloride, sodium chloride and ethylene glycol in solution [28].
Since then,
many other OFGs-based sensors have been described for the measurement of isopropyl alcohol [46], glycerine [47], sucrose [48, 49], ethanol and glucose [49], cane sugar [50], antifreeze [27], xylene [29] and chloride ion [51, 52].
It is
worth observing that this approach presents the di�culty of measuring any changes in RI that occur in the volume surrounding the �ber, and hence the measurement will be highly a�ected by interferences coming from other substances di�erent from the investigated one. Therefore the use of non-coated OFGs is restricted only to pure solutions. In the last years, instead, most OFGs-based sensors are using a technological platform, which is based on coated OFGs and then carries out surface measurements. In fact, the use of a layer capable of capturing the substance �under test� is essential for the development of a real sensor, which can be put on the market.
In the literature, we can �nd a lot of exam-
ples of OFGs coated with polymers or sol-gel matrix for chemical sensing: sol-gel derived SnO2 thin �lm for ethanol vapor detection [53], poly(acrylic acid)/poly(allylamine hydrochloride) polymeric thin �lm for pH detection [54], syndiotactic polystyrene in the nanoporous crystalline
δ
form for chlo-
roform detection [55], palladium/palladium-argentum thin layer for H2 detection [56, 57], perovskite-type nanocrystalline thin �lm for low level H2 detection [58] and polydimethylsiloxane/ polymethyl-octylsiloxane co-polymers for detection of vapors of volatile organic compounds (VOCs) [59]. In all these cases, generally, the selectivity is only partial, since the deposited layer is not totally selective to a single analyte, but it adsorbs more than one species. Very recently, considering also the growing need in the biomedical �eld, many technological platforms based on coated OFGs have been developed for biochemical sensing. For this type of sensors, a biological recognition element (BRE) able to bind with the analyte can be used and, in this case, high selectivities can be also reached depending on the a�nity between the BRE
1.3. Contributions and outline
5
and the investigated analyte. One of the �rst demonstrations that OFGs can be e�ectively used as biosensors was given by Wang et al. [60, 61] using the biotin-streptavidin system, which serves as bioconjugate pair.
OFGs-based
sensors are also used for the label-free detection of bacteria using physically adsorbed bacteriophages [62], for the measurement of DNA hybridization [63, 64] and for antibody-antigen interaction [65�68]. Finally, the SRI sensitivity of OFGs can be also enhanced by means of colloidal gold nanoparticles (CGNs) deposited onto the grating portion. Using this methodology, two new classes of biosensors have been reported in the literature: the former is used for real-time and label-free monitoring of both the formation of DNA monolayer in aqueous environment and complementary DNA binding [69], the latter, instead, is used in order to create an antibody-antigen binding model for dinitrophenol (DNP) [70].
1.3 Contributions and outline
T
he present dissertation can be seen as a �rst step towards the realization and characterization of a thermo-stabilized �ow cell of relatively low vol-
ume for compensated RI measurements [26]. For this purpose, a hybrid con�guration of OFGs is used. This hybrid con�guration consists of two di�erent in-line OFGs, the former is a long period grating (LPG), which is able to sense changes in SRI, while the latter is a �ber Bragg grating (FBG), which is used for compensating the e�ects on the sensor response due to possible changes in strain and temperature induced on the �ber. Speci�cally, we focus our attention on the integration of a micro�uidic system with an OFGs-based sensor con�guration which allow us to stabilize the whole system both mechanically and thermally, and hence to measure accurately any RI changes occurring on the �ber surface. It is worth highlighting that the mechanical and thermal stabilization of both the �ow cell and sensor is a crucial aspect when very low RI change occurs as is the case in bioassay or, more in general, in the biochemical �eld.
In this case, a high sensitiv-
ity/resolution or a low limit of detection (LOD) is necessary in order to sense biological interactions with better metrological performance than other existing optical methods, and this can be only achieved by means of an e�ective
1. Introduction
6
mechanical and thermal stabilization of the whole system, when OFGs are used as sensing element. The issue of the development of a thermo-stabilized �ow cell for accurate RI measurements to be used in biochemical �eld too was an open problem that has now been solved. This work is organized as follows.
The part I provides a comprehensive
description of the theory of OFGs and a comparison between di�erent theoretical approaches to the issue of OFGs. This part includes also a brief look at the most used fabrication technology of OFGs. The theory and the most interesting applications based on OFGs for both physical and biochemical sensing are presented in part I too.
In the part II, the design and characterization
of the thermo-stabilized �ow cell with the OFGs-based sensor placed inside for accurate RI measurements are fully described and discussed.
Finally, a
summary and conclusions are given in the part III. The main contributions of this PhD thesis can be summarized as follows:
The integration of a thermo- and mechano-stabilized micro�uidic system with an OFGs-based sensor con�guration for accurate RI measurements is presented. The experimental results show that the proposed system provides good performances as far as the RI sensitivity and resolution are concerned. The maximum sensor sensitivity and resolution are 3120
−1 (Refractive Index Unit) and 2 x 10⁻⁵ RIU, respectively. It
nm RIU
is worth noting that the maximum resolution is one order lower than a commercial refractometer.
The long-term stability of the whole system was demonstrated with a
−1 . This kind of measurement is essential
calculated drift of about 1 pm h
for our ultimate goal, which is that of applying this system to the �eld of biochemical sensing, where several hour-long measurements can be necessary especially during the calibration procedure.
The methodology for measuring and thus for cancelling the sensor crosssensitivities to strain, temperature and �ber bending is presented. The �ber bending is negligible because the optical �ber is glued to the �ow cell using an UV optical �exible adhesive which also guarantees a safe sealing of the �ow cell.
Therefore the methodology lies in using both
a FBG written on the same �ber in series with the LPG and an accu-
1.4. Istruzioni per la stampa
7
rate temperature measurement system which make it possible to introduce feedback signals in order to eliminate the interferences coming from strain and temperature changes.
Referring to the proposed methodology, it has proved crucial to consider and hence experimentally evaluate the in�uence of the liquid RI on the sensor temperature sensitivity.
This is to be ascribed to the thermo-
optic e�ect acting on the di�erent liquids. We will show in subsection
?? how this e�ect is negligible for liquids whose RI is around the RI of
distilled water (ie 1.333 RIU) while it becomes the dominant e�ect for liquids whose RI is around the RI of the �ber cladding (ie 1.456 RIU). Considering this e�ect, we obtained the temperature sensitivity for all the test solutions and hence we were able to accurately measure the RI of any liquid in the sensor range by means of our methodology.
1.4 Istruzioni per la stampa Questo MASSIMO NON C'ENTRA NULLA!!!
Il documento deve essere stampato su fogli B5, fronte e retro;
Per le copertine usare il template fornito (�le .pub) realizzato con Microsoft O�ce Publisher;
Per la costola del libro indicare AUTORE, TITOLO, ANNO (scritti dall'alto verso il basso, in modo che quando il libro è posto in orizzontale le scritte non risultino rovesciate).
Part I
Theory, manufacturing and applications of optical �ber gratings
Chapter 2
General concepts about optical �ber gratings The secret to creativity is knowing how to hide your sources. Albert Einstein
2.1 Fundamentals
A
s above-mentioned in section 1.1, the use of optical �bers for sensing purposes has many advantages over other technological platforms. Op-
tical �bers were �rstly used in the past for telecommunication purposes as transmission medium of signals. Concerning this, there were two milestones in the history of optical �bers that have made possible their use in the �eld of sensing: the former was on May 16, 1960, when Theodore H. Maiman operated the �rst functioning laser at Hughes Research Laboratories, Malibu, California, while the latter was the discovery of the crucial attenuation limit of 20
−1 that was �rst achieved in 1970, by researchers Robert D. Maurer,
dB km
Donald Keck, Peter C. Schultz and Frank Zimar working for American glass maker Corning Glass Works, now Corning Incorporated. They also demon-
−1 attenuation by doping silica glass (SiO ) 2 −1 with titanium. A few years later they produced a �ber with only 4 dB km
strated a �ber with 17 dB km
attenuation using germanium dioxide (GeO2 ) as the core dopant. The early 1970s saw some of the �rst experiments on optical �bers being used not only for telecommunications but also for sensing purposes. Henceforth, the term
optical �ber sensor
(OFS) was coined to describe a type of sensor (physical,
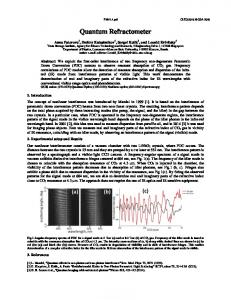
chemical, biological) that takes advantages of the optical �ber properties. OFSs can be classi�ed into two di�erent groups depending on the use of optical �bers (see �gure 2.1). In fact, when perturbations act on the optical �ber and it in turn changes some characteristics of light propagation inside the �ber itself, we are dealing with an intrinsic OFS (IOFS). In this kind of
2. General concepts about optical �ber gratings
12
sensors, hence, the optical �ber acts both as light guiding element and sensing one. When, instead, the optical �ber is simply used to carry the light to and from an external optical device where the sensing mechanism takes place, we are dealing with an extrinsic OFS (EOFS). In this case, the optical �ber acts only as light guiding element [71].
Figure 2.1: Optical �ber sensors classi�cation: extrinsic OFS on the left and intrinsic OFS on the right
Among the OFSs, those based on
optical �ber gratings (OFGs) are a special
class, which have witnessed a considerable increase in the sensing �eld during the last years. An OFG is a periodic (or aperiodic in the case of chirped gratings, see chapter 3) modulation of the core refractive index (ncore ) of a single mode �ber (SMF) and/or the its geometry. As can be seen in �gure 2.2(a), the induced modulation of the �ber core refractive index (∆ncore ) is depicted by means of gray circles inside the �ber, which are distant a period (Λ). In �gure 2.2(b) an example of RI pro�le is reported in which the modulation is made by means of a typical square wave pro�le of the �ber core RI along the �ber axis (z). Both the amplitude and the period of this modulation constitute the key physical parameters to manufacture an OFG with the desired optical characteristics. How these parameters in�uence the light coupling and propagation inside the �ber will be accurately explained in the �rst part of
2.1. Fundamentals
13
chapter 4.
Figure 2.2: Optical �ber gratings: physical depiction (a) and refractive index pro�le of the �ber core (b) OFGs are classi�ed into two groups according to the grating period (Λ), that is to say the distance between the grating fringes, the length of which sets out a speci�c mechanism of light coupling and propagation inside a SMF. From a historical point of view, the �rst type of in-�ber OFG was demonstrated by Ken Hill in 1978 [72] and they are known as short period gratings or better
�ber Bragg gratings (FBGs), which are characterized by a grating period
in the order of magnitude of hundreds of nanometers (nm) that gives rise to coupling between the fundamental core mode and its respective counterpropagating mode. For this reason, FBGs are also called
re�ection gratings .
Considering a single mode �ber, the light is traveling along the �ber core. When the light encounters the grating plane and hence sees a discontinuity of refractive indices, assuming to approximate the light propagation according to geometrical optics (GO) and remembering Snell's law, there will always be a re�ected ray and a di�racted one at each interface. The di�racted rays travel across the �ber and constitute the fundamental mode remaining in phase with each other, while the re�ected rays, in the event of constructive interference
14
2. General concepts about optical �ber gratings
with each other, produce the coupling with a mode that travels inside the �ber core in the opposite direction compared to the fundamental mode.
Figure 2.3: Fiber Bragg grating: depiction of light coupling and propagation with the distinctive spectra (Λ not in scale)
In �gure 2.3 we can see the spectral characteristics of a typical FBG in both transmission mode and re�ection one.
Λ is the grating pitch and the red arrows
depict both the place and the direction of the coupling. In fact, considering to have a broadband source in input to the optical �ber, whose spectrum is �at for simplicity over the considered wavelength range, the re�ectance spectrum is characterized by a re�ectance peak. The respective transmission spectrum is characterized by a transmission dip.
Both the re�ectance peak and the
transmission dip are centered at a speci�c wavelength that veri�es the phasematching condition (PMC) and hence the coupling between the two modes. In the case of FBGs, this particular PMC is known as �rst order Bragg condition, the details of which will be provided in the section 2.3.
2.1. Fundamentals
15
Later, in 1996, Vengsarkar et al. presented a new class, ie the second one, of OFG known as
long period gratings
(LPGs) [73], which are characterized
instead by a grating period in the order of magnitude of hundreds of micrometers (µm) that gives rise to coupling between the fundamental core mode and a discrete set of forward-propagating cladding modes. LPGs are also called
transmission gratings .
For this reason,
Therefore, in the case of LPGs,
the re�ected rays, in the event of constructive interference with each other, produce the coupling with some modes that travel inside the �ber cladding in the same direction of the fundamental mode due to a greater grating period.
Figure 2.4: Long period grating: depiction of light coupling and propagation with the distinctive spectra (Λ not in scale)
In �gure 2.4 we can see only the transmission spectrum of a typical LPG. As mentioned above,
Λ is again the grating pitch (greater compared to FBGs) and
the red arrows depict again both the place and the direction of the coupling. As can be seen from this �gure, the coupling in this type of gratings occurs only in the �ber cladding owning to a grating pitch three orders of magnitude larger than the operating wavelength.
This coupling happens between the
guided fundamental mode to forward-propagating evanescent wave cladding modes, which generates in the transmission spectrum of the �ber a series of attenuation bands centered at discrete wavelengths that verify the PMCs of each coupled mode. These modes decay rapidly as they propagate along the �ber axis owing to both the scattering losses at the cladding/plastic acrylate
2. General concepts about optical �ber gratings
16
coating interface and bends in the �ber. It is obvious in this case that, taking place a coupling between co-propagating modes, no kind of re�ection occurs; for this reason the re�ectance spectrum is not reported in �gure 2.4. So for LPGs, we simply refer to the phase-matching condition in which the coupled modes are speci�ed by means of a subscript (m) in the condition. Even for LPGs, the details of PMC will be also provided in the section 2.3. An optical �ber grating can be studied by means of two di�erent approaches: one is more rigorous and comprehensive, and is based on the theory of lightwave propagation in dielectric waveguides [74] and hence on Maxwell's equations, while the other is more intuitive and simple, and is based on the well-known theory of di�raction gratings. The former will be extensively explained in the chapter 3, the latter instead will be discussed in the next section.
2.2 Di�raction gratings
A
di�raction grating is a cascade of re�ecting (or transmitting) elements separated by a distance comparable to the wavelength of light under
study. A complete historical description of di�raction gratings can be �nd in
Di�raction Grating Handbook
[75]. Typical examples of di�raction gratings,
thought of as a cascade of di�racting elements, are a pattern of transparent slits (or apertures) in an opaque screen or a collection of re�ecting grooves on a substrate. In either case, the foremost physical characteristic of a di�raction grating is the spatial modulation of the refractive index. In accordance with the di�raction theory, an electromagnetic wave incident on a grating has its electric �eld amplitude, or phase, or both, modi�ed predictably due to the periodic change in RI in the region near the grating surface. When monochromatic light of wavelength
λ
is incident on a grating surface, it is di�racted
into discrete directions each of which can be seen as a very small, slit-shaped source of di�racted light. Therefore the light di�racted by each slit (or groove) interacts to form a set of di�racted wavefronts. The interesting feature of a grating is the fact that there exists only a set of discrete angles along which,
2.2. Di�raction gratings
17
for a given spacing (d) between slits (or grooves), the di�racted light from each slit (or facet) is in phase with the light di�racted from any other slit (or facet), leading to constructive interference.
Figure 2.5: Di�raction grating: an example of re�ection grating (a) and transmission grating (b)
2. General concepts about optical �ber gratings
18
An example of di�raction grating is shown in �gure 2.5 [75]. The picture (a) shows a re�ection grating, while the picture (b) shows a transmission grating. In both pictures, the input light ray strikes the grating surface at an angle
d
α,
while the di�racted rays come out from the grating surface (where
denotes again the grating pitch) along at set of angles (θm ). All the angles
are taken with respect to the grating normal, which is depicted as the dashed line perpendicular to the grating surface, and they are measured from the grating normal to the ray by means of arrows. The sign convention for these angles depends on whether the light is di�racted on the same side (hence plus sign) or on the opposite side of the grating as the incident light (hence minus sign). The signs are reported at the top of the same �gure close to the grating normal. Figure 2.6 shows in a di�erent manner the e�ects of a di�raction grating using the wavefronts, ie surfaces of constant phase [75].
Figure 2.6: Di�raction e�ect of a grating using wavefronts The geometrical path di�erence between two parallel rays of light from ad-
2.2. Di�raction gratings
19
jacent slits (or grooves) is
d sin α + d sin θ, as highlighted with the gray arrows.
The principle of constructive interference states that, when two parallel rays, in phase between each other at a particular time and space as shown with the gray line A, strike the grating surface with a grating pitch of length
d,
they
preserve the same phase information, at a particular time and space as shown in the same �gure with the gray line B, if the path di�erence between the two rays is equal to the wavelength of incident light
λ
or some integer multiple
thereof. The constructive interference among rays occurs only for some discrete angles
θm ,
while the destructive interference will have for all the other
angles. Considering all these reasonings, the
grating equation
can be written as
follows:
mλ = d (sin α + sin θm ) where the integer
m is the di�raction
order .
(2.1)
The grating equation governs the
angular locations of the principal intensity maxima when light of wavelength
λ is di�racted from a grating of slit (or groove) spacing d. that, for a particular wavelength λ, all values of m for
It is worth noticing which
|mλ/d| < 2
correspond to propagating di�raction orders rather than evanescent ones. The simplest case,
m = 0,
leads to the law of re�ection, ie
Generally several integers
m
θ = −α.
satisfy the equation (2.1) and they are the so
called di�raction orders. Referring to �gures 2.5 and 2.6, the �rst di�raction order (θ−1
= θ)
is just reported, not only for the sake of simplicity but also
because most of the energy is related to the �rst di�raction order (m
= ±1).
As seen from equation (2.1) and �gure 2.5, the distinction between positive and negative di�raction orders can be made according to this:
θ > −α θ < −α θ = −α This sign convention for
m
(m > 0), orders (m < 0), re�ection (m = 0)
for positive orders for negative for specular states that
m>0
(2.2)
if the di�racted ray lies to the
left (the counter-clockwise side) of the zero order
(m = 0)
and
m> π , the sidelobes
change of power between two modes occurs when over, for strongly overcoupled gratings where become signi�cantly more pronounced.
01−1p
But since the sidelobes are usually
undesiderable, most LPGs are designed to have
κ01−1p core-clad L ≤ π/2
while the
strongest gratings are designed to have the maximum coupling strength and hence, to verify the condition given in equation (3.79). As for FBGs, the other characteristic parameter of optical �ber gratings is the bandwidth of the coupled cladding mode under consideration. Also in this case, we consider the FWHM as grating bandwidth, which is still evaluated when
σ b = 0.
The most used expression in the literature, which is still used
in order to calculate the FWHM of a LPG, is that of determined by Erdogan as [86]
3.2. Study of OFGs by means of the coupled mode theory (CMT) � ∆ λLPG res (p) =
where the subscript and the term
∆ ne� p
p
λLPG res (p)
�2 s
∆ ne� p L
1 +
4 κ01−1p core-clad L π
65
(3.80)
indicates the number of the coupled cladding mode
represents the di�erential ERI, namely the di�erence in
e�ective refractive indices between the fundamental core mode and the
p−th
cladding mode. Thus the equation above highlights the bandwidth dependence of both the coupling constant of the cladding mode under consideration and the di�erential ERI, and the optical parameters of the grating too. Broadly speaking for each cladding mode, looking at equation (3.80), the bandwidth decreases as the length of the grating increases (as for FBGs). In addition, the bandwidth of each cladding mode depends strongly on the di�erential ERI and hence, on the ERI of the
p−th
cladding mode (unlike for FBGs obviously).
In this case as well, to compare the theory and an experimental measurement [76], �gure 3.15 shows the measured (dots) and theoretically calculated (solid line) transmission spectrum of a 50 mm-long weak LPG, which couples the LP01 core mode to the lowest-order cladding mode. This LPG is characterized by a design wavelength of about 1545 nm and an induced-index change of
∆ ncore = 4.2 × 10⁻³
κ b L = 0.39. This value of the coupling optimum value of π/2, leads to a low value of
RIU, thus yielding
factor, which is far from the
transmission about the resonance dip depicted in �gure 3.15. Typical values of the FWHM about LPGs ranges from 10 nm to 25 nm.
3.2.3 Hybrid coupled mode theory Broadly speaking, it is then usually straightforward to write a reasonable onset for the optical �eld by superimposing the respective basis �elds with coe�cient functions that are slowly varying along the direction of propagation. By following this approach, one obtains equations for the amplitudes of the basis �elds and their solutions. Approaches of this kind are usually addressed by the above-mentioned CMT. The question is that only in special situations, typically for longitudinally homogeneous media (ie waveguides, optical �bers), the CMT equations permit analytical solutions. This means that they lead to explicit analytical expressions that describe the light propagation. For other
3. Theory of optical �ber gratings
66
Figure 3.15: Measured (dots) and theoretically calculated (solid line) transmission spectrum for a 50 mm-long LPG with
κ b L = 0.39
con�gurations, no less interesting, one obtains coupled systems of di�erential equations of higher dimension or systems with nonconstant coe�cients that can only be treated by numerical analysis.
Then, the solutions consist of
numerical representations of the CMT coe�cient functions that still permit to inspect the amplitude evolutions of the couplings under consideration. Hammer [98] proved that a uni�ed formalism covers co- and contradirectional propagation, where applicable. coordinate is not required.
Moreover, a common propagation
Starting from these assumptions, once a physi-
cally plausible �eld template has been �xed for a given structure, no further heuristics is required to arrive at the desired approximate solutions for the optical �eld by means of the frequency-domain Maxwell equations.
In de-
tail, given the geometry and RI pro�le of a dielectric structure, the �rst step
3.2. Study of OFGs by means of the coupled mode theory (CMT)
67
is that of �xing a reasonable onset for the electromagnetic �elds. Typically, the expressions incorporate the guided modes that are supported locally by the structure. These are multiplied by amplitude functions, which depend on the propagation coordinate, that is most convenient for the respective mode. Then, what remains is to determine the strength of the interactions, namely to determine the amplitude functions. At this point, it is necessary to use a numerical approach which allows us to discretized the amplitude functions by
2
linear 1-D �nite elements (FE). Hence a Galerkin procedure
permits to estab-
lish a dense but small size system of linear equations for the FE coe�cients, which is �nally solved numerically. It is interesting to note that the methodology proposed by Hammer can be also applied to 2-D structures. Moreover, it is worthy of highlighting that the range of applicability of CMT approaches need not be restricted to structures with low RI contrast. In fact, the example in reference [98] covers structures with moderate to high RI contrast, but with only relatively weak or only localized mutual perturbations of the interacting basis modes, such that the optical �elds can be well described by the CMT templates by requiring the restricted functional to become stationary. If this last condition is con�rmed, then the arguments of the functional of six electromagnetic-�eld components satisfy the Maxwell equations in the domain of interest, together with suitable boundary conditions. These boundary conditions can be various.
In fact, Hammer [98] dealt with transparent in�ux
boundary conditions (TIBCs) and his methodology is known in the literature as
hybrid coupled mode theory .
On the other hand, Song et al [99] recently dealt with an optical �ber structure which is enclosed by a perfectly matched layer (PML) terminated by a perfectly re�ecting boundary conditions (PRBCs) and their methodology is known in the literature as
complex coupled mode theory .
As widely explained
in this section, in most practical applications, only limited number of modes (usually two) close to PMC play signi�cant roles in the interaction of the modal �elds. Consequently, a substantially reduced formulation of the CMT is used and simple analytical solutions are found.
For nonguided radiation
�elds, instead, the conventional two-mode CMT becomes cumbersome due to continuous spectrum of the radiation modes. To overcome this problem, leaky
2 For mode details see the website http://en.wikipedia.org/wiki/Galerkin_method
3. Theory of optical �ber gratings
68
modes are introduced to approximate the nonguided radiation modes [100]. The use of leaky modes in the conventional two-mode CMT su�ers from problems such as mode orthogonality and normalization in the real domain.
In
this context the Song's work gets in with the combination of the PML and PRBCs, which creates an open and re�ectionless environment in a close and �nite computation domain. Such a structure yields a set of complex orthogonal modes that can be readily normalized in terms of power and hence can be solved rigorously by standard analytical and numerical algorithms, such as the �nite di�erence (FD) method [101]. With properly chosen modal parameters, the guided modes of the original structure are not a�ected, whereas the nonguided radiation modes are represented by discrete quasi-leaky modes con�ned in the cladding as well as the PML modes concentrated in the PML. At this point, a well-de�ned coupled mode formulations can be derived based on the �eld expansion in terms of the complex modes. Song et al [99] showed that this theoretical approach can also be applied to optical �bers of circular symmetry e�ciently.
3.3 Study of OFGs by means of the transfer matrix method (TMM)
I
t is obvious that the methodologies brie�y explained in section 3.2.3 represent comprehensive ways to solve strictly the electromagnetic problem
about circular dielectric structures, ie optical �bers in which a RI perturbation was equally induced along the core of the �ber. It is equally true that all the methods described in this dissertation are based on the CMT of hybrid HE1 p modes, or rather approximated LP1 p modes without azimuthal �eld variation in step-index single-mode �bers. For this type of structures (ie three-layer �ber) in which the grating is written only in the core of the �ber, the expressions of electromagnetic �elds in both the core and the cladding regions are given in closed form. These assumptions are true in the case of UV-photowritten gratings, which represents the �rst discovered methodology for the manufacturing of gratings. Lately, there was a number of publications focusing on LPGs made via alternative fabrication methods, such as CO2 laser inscription, ion implantation,
3.3. Study of OFGs by means of the transfer matrix method (TMM)
69
electric-arc discharge, mechanical gratings. All these fabrication methods will be extensively described in chapter 4 together with the di�erences between them. However, there is evident that the RI distribution of gratings produced by these techniques is not uniform in cross section. The �rst experiments made by Davis et al [102] showed a power exchange between the fundamental guided core mode and a too great number of higher-order cladding modes, or rather the transmission spectrum of the �ber showed too many loss peaks.
This
phenomenon proves that the RI perturbation in those LPGs has azimuthal dependence and extends beyond the core region.
Anemogiannis et al [103]
�rstly reported a numerical method to simulate nontilted OFGs which have an azimuthal and/or radial varying RI distribution and may extend to the �ber cladding-air interface.
Therefore the optical �ber under consideration
can also have an arbitrary RI pro�le, thus this methods is a general one. The Anemogiannis's methodology starts its analysis with the consideration that high-order LP modes have a two-folded degeneracy due to the sine and cosine dependence of the �elds. Let us consider the LP modes of a cylindrical dielectric waveguide having an arbitrary RI pro�le.
Although the RI di�erence between the cladding
and the environment is not negligible, the LP approximation is still valid for low-order modes having arbitrary azimuthal order
l.
According with the LP
mode formulation described in section 3.2 and borrowed by reference [80], the LPlp mode of order radius
rj−1 < r < rj
p
and within a cylindrical dielectric layer
and refractive index
propagating along the
z
nj ,
ko = 2π/λ, λ
having
axis given by
( ) cos (lφ) Et,lp(j) (r, φ, z) = e(− i βlp z ) sin (lφ) ( � � Clp(j) Jl rγlp(j) + Dlp(j) Yl rγlp(j) × � � Clp(j) Il rγlp(j) + Dlp(j) Kl rγlp(j) where
j
has the transverse electric �eld
when
βlp < ko nj
when
βlp > ko nj
(3.81)
rβ lp is the longi 2 is = ko2 n2j − βlp
is the operating freespace wavelength,
tudinal propagation constant of the LPlp mode, the magnitude of transverse wavenumber,
φ
γlp(j)
is the azimuthal angle (see also
3. Theory of optical �ber gratings
70
�gure 3.1),
Clp(j)
and
Dlp(j)
are the arbitrary �eld expansion coe�cients deter-
mined by the boundary conditions within the cylindrical layer and
Yl rγlp(j)
�
l (l ≥ 0) of � Kl rγlp(j) are
are the Bessel functions of order
second kind, respectively, while Bessel functions of order
l
Il rγlp(j)
�
and
j , Jl rγlp(j)
�
the �rst and the modi�ed
of the �rst and second kind, respectively. Note that
the equation (3.81) represents the general expression of the transverse electric �eld, which have been explicitly written in the case of �rst (l
= 1)
azimuthal
order for both the core and cladding regions (see equations (3.10), (3.11) and (3.29)-(3.31)).
At this point, we need to calculate the propagation constant
βlp .
To do
this, in the general case of optical �bers having arbitrary RI pro�le in which all the azimuthal orders have to take into account, a particular optical approach must be used in order to simplify the electromagnetic problem and hence to �nd the propagation constant of LP modes. This optical approach is known in the literature as
transfer matrix method
(TMM) and the �rst who
applied this method to optical �bers was Morishita [104]. Later, Anemogiannis et al [103] presented a more compact form of TMM than Morishita which makes allowances for faster calculations of
βlp .
Broadly speaking, the TMM is
a method used in optics and acoustics to describe the propagation of electromagnetic or acoustic waves through a layered medium, such as anti-re�ective coatings and dielectric mirrors.
In fact, the re�ection of light from a single
interface between two media is described by the Fresnel equations. However, when there are multiple interfaces, such as in optical �bers with an arbitrary RI distribution, the re�ections, which are partially transmitted and then partially re�ected, can interfere destructively or constructively depending on the exact path length. The overall re�ection of a layered structure is the sum of an in�nite number of re�ections, which turns out to be cumbersome to calculate. Having just said that, the TMM is based on the fact that, according to Maxwell's equations, there are simple continuity conditions for the electric �eld across interfaces from one medium to the next. If the �eld is known at the beginning of a layer, the �eld at the end of the layer can be derived from a simple matrix operation. Thus the layered structure can be represented as a system matrix, which is the product of the individual layer matrices. Finally, the method involves converting the system matrix back into re�ection and
3.3. Study of OFGs by means of the transfer matrix method (TMM)
71
transmission coe�cients, or rather into propagation constants in our case. In this thesis we report a brief description of this methodology. Our analysis start by rewriting the equation (3.81) in a more compact form as
Et,lp(j) (r, φ, z) = e(− i βlp z ) Ψlp(j) (r, φ) = e(− i βlp z ) Φl (φ) Rlp(j) (r) where the term
Ψlp(j) (r, φ)
(3.82)
is the amplitude connected with the transverse
electric �eld which can be divided into two distinct terms:
the �rst
Φl (φ)
is the azimuthal component of the �eld, whereas the second
Rlp(j) (r)
is the
radial component of the �eld in layer
j.
This last term can be compactly
expressed as
� � Rlp(j) (r) = Clp(j) Cl rγlp(j) + Dlp(j) Dl rγlp(j) By considering the component of the radial �eld in layer continuity condition of the tangential electric �elds,
R
j
and by applying the
and
dR/dr
quantities
must be continuous along the interface of two consecutive cylindrical layers. Therefore, at radius
r = rj
and at the interface between layers
j
and
j + 1,
it
is necessary to satisfy the following conditions:
� � Rlp(j) (rj ) = Rlp(j+1) (rj ) =⇒ Clp(j) Cl rj γlp(j) + Dlp(j) Dl rj γlp(j) � � = Clp(j+1) Cl rj γlp(j+1) + Dlp(j+1) Dl rj γlp(j+1)
(3.83)
and
dRlp(j+1) (rj ) dRlp(j) (rj ) = dr drh
� �i 0 0 =⇒ γlp(j) Clp(j) Cl rj γlp(j) + Dlp(j) Dl rj γlp(j) h � �i 0 0 = γlp(j+1) Clp(j+1) Cl rj γlp(j+1) + Dlp(j+1) Dl rj γlp(j+1)
where
0
Cl (.)
and
0
Dl (.)
denote derivatives with respect to
tions (3.83) and (3.84) as a function of
Clp(j)
and
Dlp(j) ,
r.
(3.84)
By solving equa-
it can be obtained
the matrix equation for a single homogeneous cylindrical layer:
3. Theory of optical �ber gratings
72
"
# gj,j+1 (βlp ) gj,j+1 (βlp ) " # 11 12 Clp(j) C Qj Qj lp(j+1) = gj,j+1 j,j+1 (βlp ) g22 (βlp ) 21 Dlp(j) Dlp(j+1) Qj Qj " # Clp(j+1) = Γ(j,j+1) Dlp(j+1)
The elements of matrix
Γj,j+1
and the term
Qj
(3.85)
are given as
� � 0 j,j+1 g11 (βlp ) = γlp(j) Dl rj γlp(j) Cl rj γlp(j+1) � 0 � − γlp(j+1) Dl rj γlp(j) Cl rj γlp(j+1)
(3.86)
� � 0 j,j+1 (βlp ) = γlp(j) Dl rj γlp(j) Dl rj γlp(j+1) g12 � 0 � − γlp(j+1) Dl rj γlp(j) Dl rj γlp(j+1)
(3.87)
� � 0 j,j+1 (βlp ) = −γlp(j) Cl rj γlp(j) Cl rj γlp(j+1) g21 � 0 � + γlp(j+1) Cl rj γlp(j) Cl rj γlp(j+1)
(3.88)
� � 0 j,j+1 (βlp ) = −γlp(j) Cl rj γlp(j) Dl rj γlp(j+1) g22 � 0 � + γlp(j+1) Cl rj γlp(j) Dl rj γlp(j+1) h
�
0
�
0
�
Qj = γlp(j) Cl rj γlp(j) Dl rj γlp(j) − Cl rj γlp(j) Dl rj γlp(j) 2 when βlp < ko nj π γlp(j) rj = −1 when βlp > ko nj γ rj
(3.89)
�i (3.90)
lp(j)
Therefore, if we extend the application of equation (3.85) along the radial direction of an optical �ber having as a product of single layer:
N +1
layers, we obtain the global matrix
3.3. Study of OFGs by means of the transfer matrix method (TMM) "
73
# " # Clp(N +1) Clp(1) = Γ(1,2) Γ(2,3) · · · Γ(N,N +1) Dlp(1) Dlp(N +1) " #" # 1,N +1 1,N +1 g11 (βlp ) g12 (βlp ) Clp(N +1) = 1,N +1 1,N +1 g21 (βlp ) g22 (βlp ) Dlp(N +1)
(3.91)
It is worthy of highlighting that equation (3.92) relates the �elds in the inner (j
= 1)
layer of the �ber (core) to the most external (j
= N + 1)
layer, that
is to say the environment. Moreover, it is obvious that, for �nite �elds in the core and in the environment around the �ber, the coe�cients
CN +1
and
D1
must be zero. This condition allows us to write that
1,N +1 g22 (βlp ) = 0
(3.92)
which gives as roots the propagation constants the azimuthal order
l
under consideration.
βlp
of the optical �ber for
In general, the system in equa-
tion (3.92) can be solved by means of several di�erent techniques described widely in reference [105]. Having found all the propagation constants
βlp ,
the coe�cients
C
and
D
in each layer are normalized such that every mode with its transverse electric �eld carries the same power
Plp
equal to 1 W, as just explained in section 3.2
by means of the equation (3.37):
Plp =
βlp 2 ω µo
Z
2π
Φ2l (φ) dφ
0
0
Any periodic RI perturbation
Z
∞ 2 Rlp(j) (r) r dr = 1W
∆ n (r, φ, z)
(3.93)
inside the �ber can carry out
the power transfer from the fundamental core mode to one or more cladding modes. As highlighted in equation (3.39) before, the term
∆ n (r, φ, z)
is the
sum of two contributions, ie a DC and an AC refractive index variation, multiplied by an optional apodization function
σ (z) for reducing the spectral ripples
of the grating frequency response. In the case of gratings manufactured by an UV exposure, that means LPGs inside the �ber core only with no azimuthal RI variations, the periodic RI perturbation becomes equal to
∆ ncore (r, z) and
can be expressed as in equation (3.39). Broadly speaking, the RI perturbation in a generalized grating can be described as the product of three functions:
∆ n (r, φ, z) = σ (z) S (z) P (r, φ)
(3.94)
3. Theory of optical �ber gratings
74
where the function
P (r, φ)
is the transverse RI perturbation, while the func-
S (z) is the longitudinal RI perturbation, that is to say a periodic function the grating period Λ. It is worhy of noticing that S (z) depends strongly
tion of
on the way in which the grating was manufactured.
This function can be
approximated as
� S (z) = s0 + s1 cos where
s0
and
s1
2πz Λ
� (3.95)
are the coe�cients corresponded to the �rst two coe�cients of
the Fourier series regarding the exposure function. This is a general expression that can be used for any types of grating manufacturing. For example, if the LPG is formed by periodic local heating as the case of CO2 laser with a width of the beam waist
W,
then the exposure function can be approximated by a
periodic rectangular wave of width
W
and period
Λ as depicted in �gure 3.16.
In the case of an exposure due to a CO2 laser irradiation, the two Fourier
Figure 3.16: Longitudinal refractive index variation function of width
S (z)
due to an exposure
W
series coe�cients are equal to
W Λ and
− π2 sin
πW Λ , respectively. For gratings
�
having a longitudinal RI pro�le as that reported in �gure 3.16, the transverse RI pro�le
P (r, φ)
is not uniform along the �ber cross section. In fact, it was
proved that the RI perturbation is higher on the side where the laser beam shoots the �ber.
Therefore, it is necessary to divide the �ber cross section
into ring sectors having a constant index variation in order to approximate
3.3. Study of OFGs by means of the transfer matrix method (TMM)
75
the transverse RI perturbation. To understand that even better, we refer to �gure 3.17 [103]. For the
j−th
cylindrical ring of radius
Figure 3.17: Azimuthal refractive index variation
P (r, φ)
sectors
transverse RI pro�le
Pj (r, φ)
rj−1 < r < rj ,
has the following form:
the
divided into ring
3. Theory of optical �ber gratings
76
Pj (r, φ) =
where
pq,j
various
p1,j p2,j
for
θ1,j ≤ φ < θ2,j ;
for
θ2,j ≤ φ < θ3,j ;
. . . ps,j
for
θs,j ≤ φ < 2π + θ1,j
(3.96)
q = 1, . . . , s are the RI modulation values around the ring for angles θq,j . It is important to point out that equation (3.96) can be for
used to discretize any arbitrary RI perturbation on a plane transverse to the �ber. At this point, we have to recurse again to the CMT for modeling the interactions among LP modes inside the �ber under consideration. As mentioned in the previous section, according to the CMT the coupling between optical modes is proportional to their transverse coupling coe�cient
t . Klp
By assuming
a power normalization between modes equal to 1 W as already done in equation (3.93), remembering equation (3.82) and starting from equation (3.40), we are able to rewrite this last equation into a generalized expression of the transverse coupling coe�cient between the LPlp and the LPµν modes:
t Klp,µν
where
ω = 4
Ψ (r, φ)
Z
2π
Z
∞
∆� (r, φ, z) Ψlp (r, φ) Ψµν (r, φ) rdr dφ 0
represents the product between the radial and the azimuthal
component of the transverse electric �eld about an LP mode, ie
Φl (φ) Rlp (r),
(3.97)
0
Ψlp (r, φ) =
∆� (r, φ, z) is the permittivity perturbation which is related to the RI perturbation ∆ n (r, φ, z) by means of the following expression: while
∆� (r, φ, z) ∼ = 2 �o no (r) ∆n (r, φ, z)
(3.98)
no (r) represents the unperturbed RI of the �ber. It is worthy of pointing that the term ∆� (r, φ, z) is the generalization of the term ∆χ (r, z) given
where out
in equation (3.40) for a �ber having an arbitrary RI perturbation. Thus, by using equations (3.94), (3.95) and (3.98), equation (3.97) takes the following �nal form:
3.3. Study of OFGs by means of the transfer matrix method (TMM) t Klp,µν
�
�
2πz Λ
��
= σ (z) s0 + s1 cos Z Z ω�o 2π ∞ × no (r) P (r, φ) Ψlp (r, φ) Ψµν (r, φ) rdr dφ 2 0 0 � � �� 2πz = σ (z) s0 + s1 cos κlp,µν Λ
where the term
κlp,µν
77
(3.99)
is the generalized expression of the coupling constant
between the LPlp and the LPµν modes. As already discussed in section 3.2, traditional UV-photoinduced gratings having uniform RI perturbations within the core of the �ber generate LP01 −to−LP1p mode couplings.
Since these
modes do not have any angular dependence, the azimuthal integral is equal to
2π .
pro�le
For generalized LPGs with azimuthal variation of the perturbed RI
∆ n (r, φ, z),
there is a power transfer from the LP01 mode to the LPlp
modes with arbitrary
l, p non-negative numbers.
The crucial point is that each
LPlp is treated as two independent modes, one with second with
Φl (φ) = sin (lφ).
κCS,CS lp,µν
κlp,µν
can be achieved from
r0 = 0:
Z rj N ω�o X = Rlp (r) Rµν (r) rdr no (rj ) 2 r=rj−1 j=1 " #" # s Z θq+1 X cos (lφ) cos (µφ) × pq,j dφ sin (lφ) sin (µφ) q=1 φ=θq
Note that the
and the
Therefore, by using equations (3.82) and (3.96),
the generalized expression of the coupling constant equation (3.99) by enjoining
Φl (φ) = cos (lφ)
κ superscripts C
or
S
(3.100)
correspond to the azimuthal cosine or sine
dependence of the LPlp and LPµν modes. It is important to point out that the division of a generic RI perturbation into sector rings given by Anemogiannis et al [103] was proved to be computationally e�cient because it allows the calculation of azimuthal coupling coe�cients between modes without using double integration. In fact, the integration along the radial direction is done once per ring, while the integrations along the azimuthal direction can be calculated analytically. Now, by substituting equation (3.99) into the general coupled mode equation (forward-going amplitudes) given in equation (3.47), we can obtain the
3. Theory of optical �ber gratings
78
coupled di�erential equation system which describes all the LP mode couplings into the �ber. The system is not explicitly reported in this dissertation but it can be found in reference [103] disguised as matrix representation. Broadly speaking, the number of cladding modes supported by an optical �ber is very large and hence the system dimensions are large as well. But the number of modes that interact with the LP01 mode within the wavelength range of inter-
l have Rl (r) con�ned within the �ber core for coupling
est are usually limited. Moreover, only modes with low azimuthal order the most power of radial �eld
e�ciently to LP01 mode. As already explained in section 3.2, starting from the LPG characteristic equation (3.58), the expression that generalizes the equation (3.60), because takes into account any arbitrary RI perturbations and then any azimuthal order cladding modes, is the following:
�
� 2π βlp + s0 κCS ⇐⇒ lp,lp = Λ � � λLPG res (lp) e� e� = ncore − nclad (lp) + s0 κ01,01 − s0 κCS lp,lp 2π
β01 + s0 κ01,01 λLPG res (lp) Λ
�
−
�
This condition is known in the literature as
(3.101)
modi�ed �rst-order Bragg condition
even if it is related to LPGs. This generalized condition takes into account that the propagation constants
CS self-coupling coe�cients κlp,lp .
βlp
of LPlp modes are also perturbed by the
Anemogiannis et al [103] demonstrated the
accuracy of the just given condition by means of some examples. It is worthy of stressing a crucial point.
In the case of LPGs with RI
perturbation only in the �ber core, ie UV-gratings, it was proved that the optical characteristics (resonance wavelengths, intensity of dips, FWHM, etc.) of the �ber transmission spectrum are very similar by comparing the results obtained by means of the LP and the hybrid mode formulation. This is because, since for low
∆ �bers the propagating modes satisfy the weakly guiding
condition and the hybrid modes, having much of their power within or near the core, have the longitudinal component of the �elds tending to zero, they can be accurately approximated by LP modes.
Thus, for LPGs having RI
perturbation only within the core region, the LP mode approach is simpler and as accurate as the hybrid mode formulation.
On the contrary, in the
case of generalized LPGs with RI perturbation in both the core and cladding regions, ie non-UV-gratings, the transmission spectrum is dominated by the
3.4. Study of OFGs by means of the �nite element method (FEM)
79
resonance wavelengths due to LP1p and LP2p modes. The reason for this is that higher order modes have much smaller �eld amplitudes within the �ber core in comparison to the lower order modes. coupling coe�cients
κ01,lp .
This yields very small cross-
Thus the lack of high-order resonance wavelengths
justi�es the use of LP mode formulation instead of the more complicated hybrid mode formulation. In this case the modi�ed �rst-order Bragg condition approximates the true value of the resonance wavelengths better than the classic �rst-order Bragg condition [103]. In general, a key parameter is the value of the induced RI perturbation along the �ber (∆n (r, φ, z)). Moreover, for the sake of completeness, the di�erences between the intensity about dips in the transmission spectrum with or without the cladding-cladding mode interactions are less than 0.05 dB. Larger errors occur at the narrower dips since the LP01 mode power is coupled to many other cladding modes which satisfy the PMC. Therefore, the cladding-cladding mode interactions can be neglected for LPGs.
Broadly speaking, both the classic and the modi�ed �rst-order
Bragg conditions are very close to the true resonance wavelength when only one cladding mode interacts with the fundamental core mode because of the reductions done in the CMT.
3.4 Study of OFGs by means of the �nite element method (FEM)
A
mong the numerical methods that can be used for studying theoretically an optical �ber gratings, one of the best known is unquestionably that
which combines the coupled mode theory with a �nite element method (FEM). Once the coupling constants of the grating are known, the basic optical characteristics such as intensity of the dips, resonance wavelengths, FWHMs, etc., can be easily obtained as widely explained in next sections. For simple grating structures, the coupling constants can be achieved analytically. However, for more complicated grating structures such as gratings made in photonic crystal �bers (PCF), gratings made in di�erent types of �bers (ie multimode and single mode �bers), gratings with fringes tilted by a certain angle, etc., it is di�cult to obtain an analytical expression for the coupling constants. From this point of view, the methodology that combines FEM and CMT is the best
3. Theory of optical �ber gratings
80
and the most used for complex grating structures. In fact, the �nite element method is used to obtain the expression of the coupling coe�cients regarding the grating structure under consideration, whereas the coupled mode theory is then used to evaluate the spectral and optical characteristics of the grating structure by means of the coupled mode equations. By entering into details, the FEM is applied only to the region corresponding to one period of the grating structure in order to achieve the coupling coe�cients to be putted into the coupled mode equations. In reference [106] Fujisawa and Koshiba proved that the FEM-CMT method was computationally e�cient compared to other full numerical simulation methods such as the �nite-di�erence time-domain method and the �nite-element time-domain beam propagation method, because in combined FEM-CMT only the region corresponding to one period of a grating structure at any one time is analyzed. In the bargain, once the coupling coe�cients of the grating structure are known, both the optical and spectral characteristics of the grating structure with an arbitrary number of periods can be easily achieved by using the CMT. The present methodology will be brie�y described referring to [106]. Here we consider a grating structure of total length periodicity
Λ
L
made up of
N
periods of
written inside the core of an optical �ber. Its longitudinal sec-
tion is depicted as a sketch in �gure 3.18. For this type of grating structure a pair of coupled mode equations, which express the amplitudes of the electromagnetic �elds as a function of the coupling coe�cients, can be written in the same form of equations (3.47) and (3.48) reported in section 3.2.
The
coupling coe�cients, which make possible to obtain both the optical and spectral characteristics of the grating structure under consideration, are in turn as a function of some optical parameters. These parameters, which concern the standing wave distribution of one period of the grating structure as highlighted in �gure 3.18 by means of the dashed rectangle of length equal to the grating period
Λ,
can be easily evaluated from FEM [107] applied only to one
period of the periodic structure. For the sake of completeness, the overall procedure to calculate the characteristics of a grating structure by using combined FEM-CMT method is reported and summarized in �ve points: 1. determine the structure of the grating;
3.4. Study of OFGs by means of the �nite element method (FEM)
Figure 3.18: Sketch of periodic grating structure of total length period
Λ
81
L = N Λ and
with input and output unperturbed regions
2. calculate the dispersion curves of the grating structure by means of FEM [107] and obtain the optical parameters concerning the standing wave distribution of one period of the grating structure at the wavelength range of interest; 3. calculate the propagation constants of the unperturbed structure by means of FEM and obtain the same optical parameters; 4. calculate the coupling coe�cients; 5. calculate the characteristics of interest about the grating structure throughout its length
L.
It is worthy of noting that this procedure can be also applied to waveguide
82
grating with the same steps.
3. Theory of optical �ber gratings
Chapter 4
Manufacturing of optical �ber gratings Not everything that can be counted counts, and not everything that counts can be counted. Albert Einstein
4.1 Basics about gratings manufacturing n this chapter a comprehensive overview about the manufacturing tech-
I
niques of OFGs is given.
As mentioned in the introduction of this PhD
thesis (section 1.1), the most distinguishing feature of OFGs is the �exibility that they o�er for achieving the desired spectral characteristics. This can be mostly obtained because of the �exibility about the manufacturing methods pertaining to OFGs.
In fact, numerous physical parameters can be varied,
including the induced-index change, or rather the value of the periodic modulation (∆ ncore ), the grating length (L), the type of apodization (σ ), the chirp of the grating period (grating with aperiodic change in grating period), the tilt of the grating fringes (grating with fringes tilted at a well-de�ned angle with respect to the grating normal) and whether the grating supports counterpropagating or forward-propagating couplings at a desired wavelength according to the grating period (Λ).
But �exibility is only one key features that
characterizes a particular manufacturing technique. Other important features are, for example, an economical mass production capability, a good physical and optical qualities of the manufactured gratings and a good repeatability, that is to say, the technique should be good enough under the condition of mass production and interchangeable without a calibration procedure.
Re-
garding the physical and optical qualities especially, we are dealing with the mechanical strength of the grating, which should not be degraded after the
4. Manufacturing of optical �ber gratings
84
production, the narrow bandwidths, which should be themselves su�ciently separated in wavelength, one with the other, and �nally the low losses, which are required to achieve high resolution measurements. As already explained in chapter 2, the periodic modulation (∆ncore ) of the core refractive index (ncore ) along the
z
axis of an optical �ber causes perma-
nent changes in the core refractive index pro�le and determines a speci�c value
e�
of the e�ective RI (ERI) of the �ber core (ncore ) responsible for the coupling of modes. For a better understanding, we refer to �gure 2.2 again. These changes
LPG res(p)
lead to a speci�c value of both the resonance wavelength (λ the peak intensity (transmission
T
for LPGs or re�ectivity
or
λFBG res ) and
R for FBGs) about
the coupled modes. This concept has been already expressed mathematically in section 3.2, but it is important to point out that the periodic modulation can be divided into two di�erent terms with a di�erent meaning regarding the manufacturing parameters, as reported below:
ne� core (z) = ncore + ∆ ncore (z)
(4.1)
AC = ncore + nDC core (z) + ncore (z)
The term
nDC core
is the induced-index change of the �ber core spatially averaged
over the grating length, which sets out the value of the resonance wavelength. On the contrary, the term
nAC core
is the induced-index modulation of the �ber
core, which sets out the value of the peak intensity. From a practical manufacturing point of view, it is worthy of highlighting that these two parameters can not be varied independently but they are bound themselves. Therefore, a trade-o� between them is necessary in order to achieve a coupling between two modes at the desired resonance wavelength and with the desired peak intensity. It is important to stress that the optical properties of a �ber grat-
∆ ncore , namely, axis z . Figure 4.1
ing are substantially determined by the periodic modulation the variation of the induced-index change along the �ber
illustrates some common variations in induced-index change which include the uniform variation (4.1(a)), the Gaussian-apodized variation (4.1(b)), the raised-cosine-apodized variation (4.1(c)), the chirped variation (4.1(d)), the discrete phase-shift variation (4.1(e)) and, �nally, the superstructure variation (4.1(f )). As the uniform variation is the simplest one and then the most used, especially for LPGs, we focused on this last type of structure.
4.1. Basics about gratings manufacturing
85
Figure 4.1: Common types of �ber gratings classi�ed by the variation of the induced-index change along the �ber axis:
(a) uniform, (b) Gaussian-
apodized, (c) raised-cosine-apodized, (d) chirped, (e) discrete phase-shift and (f ) superstructure
After some general concepts about the grating manufacturing, we are ready to start the description of the manufacturing techniques of OFGs. In fact, this chapter is organized as follows: the �rst section describes the manufacturing
4. Manufacturing of optical �ber gratings
86
techniques about FBGs, while the second section deals with the manufacturing techniques about LPGs. All the methods are those of reported in the literature until now. We focus the attention on the physical principle of grating formation which leads to di�erent optical and physical qualities of the grating itself. We deal also with both the advantages and disadvantages about each manufacturing technique.
4.2 Fiber Bragg gratings
B
efore starting the description about manufacturing techniques of FBGs, it is worthy of discussing the classi�cation of the FBGs with respect to
both the grating period
Λ and the tilt angle γ
three di�erent types of FBGs:
of the grating planes. There are
uniform FBG , blazed FBG
and
chirped FBG .
An uniform FBG is the classical FBG which has been already discussed in chapter 2. Looking at �gure 2.3, in fact, we can see that this type of gratings is characterized by both a uniform spacing of the grating fringes, hence a constant
Λ,
and a tilt angle of 0° degrees (ie 90° degrees with respect to the
�ber axis). As regards the blazed FBGs, they are characterized by a uniform spacing of the grating planes, hence a constant
Λ
again, but a tilt angle
γ
greater that 0° degrees as can be seen in �gure 4.2. Typical tilted angles are in the range between 2°
−20°
degrees.
In this type of gratings, the grating
period along the �ber axis, which determines the resonant wavelengths for coupling, is
Λ = Λg / cos γ .
The most interesting feature of this gratings is
possibility of the coupled mode to propagate also in the �ber cladding and hence to have access to the medium surrounding the �ber, due to the tilted grating period. This opportunity makes possible to use them as SRI sensors in both physical and biochemical �eld, as explained in part I. A comprehensive explanation about the coupling in blazed (or tilted) gratings, which goes beyond the aim of this dissertation, can be found in this reference [76]. Finally, the chirped FBGs are characterized by a tilt angle of 0° degrees (that is to say 90° degrees with respect to the �ber axis), but a nonuniform spacing of the grating planes, or else an aperiodic change of
Λ
with monotonic increase.
This con�guration can be observe in �gure 4.3. Looking at the same �gure, when the incident light encounters a nonuniform spacing of the grating planes,
4.2. Fiber Bragg gratings
87
Figure 4.2: Blazed �ber Bragg grating: physical depiction
Figure 4.3: Chirped �ber Bragg grating: physical depiction
this can be seen as a periodic nonuniform change of the �ber core RI. This means that shorter wavelengths are re�ected back before the longer ones. As a result of this phenomenon, the peak or the dip of the �ber spectrum will be widened. This type of gratings is used in the �eld of telecommunications
4. Manufacturing of optical �ber gratings
88
as dispersion compensator [108]. After this introduction regarding the FBGs' structures, we are able to talk about the di�erent manufacturing techniques of FBGs. Before entering into details of the description of the various manufacturing techniques about FBGs, some general remarks have to be pointed out. First of all, the index modulation of the �ber core is permanent, that is to say, its life time is about 25 years. Furthermore, the value of the induced
∆ ncore
depends on di�erent factor: the irradiation conditions (ie wavelength, intensity and frequency of laser source pulses and total dosage of irradiating light), the material composition of the �ber core (ie Ge-doped, Ge-Boron co-doped, etc) and any processing about the �ber prior to irradiation (ie hydrogen loading treatments, etc).
As it will be explained afterwards, FBGs are written on
photosensitive optical �bers.
The meaning and the reason of this will be
explained in next subsection, but it means that a laser source have to be used in order to write a FBG. Moreover, as explained in subsection 4.2.2, the best laser sources are those near the UV light spectrum. Thus the most commonly used sources are KrF (λ
=
248 nm) and ArF (λ
=
193 nm) excimer lasers,
−1 and total −2 to 1 J cm−2 . Under intensity of light irradiation ranging from 100 mJ cm which are characterized by pulse repetition rates of 50-75 pulses s
∆ ncore
these conditions, the value of the induced
−5 RIU to 10−3 RIU. �bers ranges from 10
in photosensitive optical
4.2.1 Internal writing technique The �rst technique for FBGs manufacturing was found away back in 1978 by Hill et al [72], [1] and it is known as
internal writing technique
experimental setup is shown in �gure 4.4.
.
The
A continuous wave (CW) blue
(488 nm) light from an Argon ion laser was launched into a 1 m-long sample of single-mode germanium(Ge)-doped-core optical �ber and the intensity of the light re�ected back from the �ber was monitored by means of a power meter. Initially, the re�ected light intensity was low, but after a period of few minutes, it grew in strength until almost all the light launched into the �ber was re�ected back. This last feature can be observed in �gure 4.5 in which the re�ectivity changes from 4% to 44%. Note that the grating re�ects the light within the �ber core, therefore the true value of re�ectivity corresponds to 88%
4.2. Fiber Bragg gratings
89
Figure 4.4: Schematic of the original experimental setup used for writing �ber Bragg gratings within the optical �bers [1]
by assuming a realistic launch e�ciency of 50%. Moreover, the insets (a) and (b) in the same �gure show the re�ection and transmission, respectively, of a typical FBG manufactured by means of this technique. However, the growth in back-re�ected light was explained in terms of a new nonlinear e�ect called
photosensitivity
which enabled to create an index modulation within the �ber
4. Manufacturing of optical �ber gratings
90
core. The reasoning is as follows: the coherent light propagating into the �ber
Figure 4.5: Time evolution of re�ectivity of a 1 m-long Ge-doped-core optical �ber (NA = 0.1 and core diameter = 2.5
µm).
Insets (a) and (b) show typical
FBG re�ection and transmission, respectively
interfered with a small amount of light re�ected back from the end of the �ber and this set up a standing wave pattern, which created an index modulation within the �ber core by means of the photosensitivity (
Hill grating ).
As the
strength of grating increased, the intensity of the back-re�ected light increased until it saturated near 100%. The grating resulted written over the total length of �ber. It represents a �rst disadvantage of this technique. At the time, it was recognized that gratings in optical �bers would have many potential applications in �ber optic communications [72], such as optical �lters in laser mode control, as synthesized �lters with tailored response characteristics for use in high-capacity wavelength-multiplexed light-wave communication systems and in wavelength-selective switches and couplers. In fact, it was shown that
Hill gratings could be used as a feedback mirror for a laser and
as a sensor for strain by stretching the �ber. In addition, the photosensitivity of Ge-doped-core optical �bers had relevant implications for the performance of this type of waveguide concerning the �eld of telecommunications: it will be shown later that the photosensitivity does not a�ect both the dispersion and the losses of waveguide in the wavelength regions of interest to optical com-
4.2. Fiber Bragg gratings
91
munications (850 nm, 1300 nm and 1500 nm). Although the photosensitivity appeared to be an ideal means for gratings manufacturing in optical �bers, the
Hill gratings
unfortunately work only at light wavelengths in the visible range
close to the wavelength of the laser source writing light. This represents the second drawback of the present technique. However, the discovery of photosensitivity gave rise to the era in technology of core-doped optical �bers. This last issue will be resumed in next subsections.
4.2.2 Two-beam interferometer techniques Given the signi�cant limitations of the above-described technique, two other completely di�erent techniques was implemented over the time: �rst is known as
mask technique .
the
two-beam interferometer technique , while the second as phase
The former will be explained in subsection 4.2.2, while the
latter in subsection 4.2.3. At the end of subsection 4.2.3, we will highlight the main advantages of the phase mask technique compared with the twobeam interferometer one.
This issue has led us to choose the phase mask
technique for the FBGs manufacturing (see section 6.4).
Holographic technique The limitation on photosensitivity at light wavelengths in the visible spectrum was overcome about ten years later (around 1989) in an experiment given by Meltz et al [2], who recognized from the work of Lam and Garside [109] that photosensitivity was a two-photon process (low e�ciency) that could be made much more e�cient if it were a one-photon process at a wavelength in the 5 eV (around 244 nm) germania oxygen-vacancy defect band [110] in germanosilicate optical �bers. The FBG was formed by exposing a short length of bare photosensitive optical �ber to a pair of overlapping coherent UV beams which came from a laser source. The schematic of the original experimental setup is
1
shown in �gure 4.6. A tunable excimer
pumped dye laser, which worked at
a wavelength in the range of 486-500 nm, was used with a frequency-doubling crystal to provide a UV source that lay in the 244 nm band and had a good
1 For more details about excimer lasers see the website http://en.wikipedia.org/wiki/
Excimer_laser
92
4. Manufacturing of optical �ber gratings
Figure 4.6: Schematic of the original experimental setup used for writing �ber Bragg gratings in optical �bers by means of transverse holographic method [2]
coherence length. The two overlapping UV light beams interfered producing a periodic interference pattern that wrote a corresponding periodic index modulation in the �ber core. This technique, which is known in the literature as
transverse holographic technique ,
was possible because the pure fused silica
(SiO2 ) cladding of the �ber was transparent to the UV light whereas the core of the �ber, doped with germanium oxide, was highly absorbing to the UV light. Moreover, the intensity of the produced pattern could be increased by focusing the two beams on the �ber by means of a pair of cylindrical lenses with a rectangular focal spot (ie 4 mm in length and 125
µm
in width). A �ltered
4.2. Fiber Bragg gratings
93
mercury arc source was used together with a high-resolution monochromator to measure both the re�ection and transmission spectra of the grating. The re�ected signal was monitored by inserting a beam splitter at the �ber input and the value of the re�ectivity was evaluated by comparing the re�ected signal level to the power re�ected, at a wavelength near but out the �lter band, from a mirror placed at the �ber output. Figure 4.7 shows a sketch of the above-described experimental setup for writing �ber Bragg gratings by means of transverse holographic method. The
Figure 4.7: Sketch of the experimental setup used for writing �ber Bragg gratings by means of transverse holographic method [3] change of the angle
ϕ,
which is the angle between one beam of the UV laser
source and the normal to the �ber axis at the focusing point of the interference pattern, allows us to change the FBG pitch
ΛF BG
according to the following
equation:
ΛF BG = where
λU V
λU V sin ϕ
(4.2)
is the wavelength of the UV laser source. Thus varying the grating
period and remembering equation (3.59), a group of FBGs with di�erent
λFBG res
can be obtained, which attests the �exibility of the present method. It is clear that the value of
ϕ
must belong to a narrow group of values around 40°.
This implies that the pitch of a FBG made by means of this technique can be changed in a small amount.
Furthermore, equation (4.2) shows that an
alternative way to vary the grating period is to tune the wavelength of the UV
4. Manufacturing of optical �ber gratings
94
source.
This last feature greatly depends on the characteristics of the used
laser source, thus representing a limitation of this method. It is worthy of noticing that this technique o�ers many advantages in comparison with the internal writing technique. It works at any wavelength regardless of the wavelength of laser source, thus it still operates at much longer wavelengths in the spectral region of interest for many optical devices and sensors. In addition, it had been proved that the photosensitivity mechanism for this technique is a one-photon process consequently with more e�ciency than the �rst-described technique.
The main drawback was characterized
by the high costs of the entire fabrication setup, especially due to the highcoherence UV laser source. For the sake of completeness, standard single-mode optical �bers (eg SMF28) can be also used for FBGs manufacturing by means of this technique after a hydrogen loading treatment to make the �ber photosensitive.
The
trouble of using this type of �ber is that it requires a long-lived post-fabrication treatment, eg heat treatment at high temperature (around 200
−300 )
or
rather annealing process, in order to provide the thermal stability of FBGs.
Source-tunable interferometer technique The second method based on a two-beam interferometer technique, known in the literature as
source-tunable interferometer technique , was demonstrated
by Dockney et al in 1996 [111]. It is able to overcome some disadvantages of the transverse holographic technique.
A schematic of this method is shown
in �gure 4.8. Unlike the above-mentioned transverse holographic technique, the FBG resonance wavelength can be selected by tuning the wavelength of the UV laser source
n λU V
rather than precisely adjusting the angles
θm
of
mirrors, whilst the change in FBG resonance wavelengths can be extended by varying the angles of the two mirrors. The obtainable resonance wavelength of FBGs, which is determined by
θm
in the interferometer method based on a
phase mask and two mirrors, is given by the following equation:
λFBG res =
n λU V sin (θpm + 2 θm )
(4.3)
4.2. Fiber Bragg gratings
95
Figure 4.8: Sketch of the experimental setup used for writing �ber Bragg gratings by means of source-tunable interferometer method [3]
where
θpm = sin−1
�
λU V Λpm
�
is the angle between the normal to the �ber axis
and the beam of the phase mask related to the �rst-order di�raction and
Λpm
is the pitch of the phase mask. In fact, the phase mask is an optical di�ractive element made of a �at slab of silica glass, which is transparent to UV light. On one of the �at surfaces, a one dimensional periodic surface relief structure is etched using photolitographic techniques. The shape of the periodic pattern can be approximated as a square wave in pro�le with a pitch equal to
Λpm .
Therefore, when the UV light is incident normal to the phase mask, the light passes through and is di�racted by the periodic corrugations of the phase mask. In general, most of di�racted light energy is contained into the 0 and
±1
di�raction orders. However, the phase mask are designed to cut the zero-
order di�raction by controlling the depth of the corrugations. Thus only
±1
di�raction orders pass through a phase mask. Therefore, precision FBGs writing can be achieve by means of this approach with a wide wavelength range, if the entire interferometer system is well stabilized during the fabrication steps. It is obvious that it is necessary to have a high-coherence UV laser source in order to manufacture FBGs with
4. Manufacturing of optical �ber gratings
96
good optical properties. Consequently, the use of a tunable UV laser source with a large coherence length increases the system costs unquestionably. This last issue represents the main drawback of the present technique. Finally, it is interesting to make a comparison between the internal writing technique and the two-beam interferometer techniques about the e�ciency of FBGs writing. The internal writing technique is based on a two-photon process at 514.5 nm, whereas the two-beam interferometer techniques are based on one-photon process with coherent UV radiation at 244 nm [2]. It was reported that, to obtain an index perturbation of 3 x 10
−5 RIU using a CW argon-
ion radiation at 514.5 nm, it required a writing power of 90.7 mW with an exposure of about 6 minutes [109]. This is equal to expose the �ber core to an
−2 . A FBG with the same strength could be −2 at a wavelength of 244 nm by obtained with an energy �ux of only 1 kJ cm energy �ux of about 665 MJ cm
directly bleaching the absorption band of Ge-doped-core optical �bers. Thus
5 in writing e�ciency had been achieved.
an improvement of 6.7 x 10
4.2.3 Phase mask techniques Because of the limitations of the two-beam interferometer techniques, mainly due to the high costs of the manufacturing apparatus, a completely di�erent approach for FBGs fabrication was developed in 1993 by Hill et al [112]. This new technique was simply based on the use of a phase mask and a UV laser source, so gratings were written in single-mode photosensitive optical �bers. The main advantages of this technique compared to two-beam interferometer techniques are as follows: simpler writing apparatus and greater repeatability. In the literature, two di�erent methodologies about this approach had been reported: a simple
phase mask method ,
and a
modi�ed phase mask method .
The former will be explained in the following subsection, while the latter in subsection 4.2.3.
Phase mask method The phase mask technique is obviously based on the use of a phase mask. In �gure 4.9 we show its sketch. As above-mentioned, only the two �rst
m = ±1
di�raction orders pass through a phase mask. These two orders interfere each other and generate an interference pattern in the middle of the phase mask.
4.2. Fiber Bragg gratings
97
Figure 4.9: Sketch of the phase mask used for writing �ber Bragg gratings by means of phase mask technique
The periodic interference pattern was used to photoimprint a refractive index modulation into the core of a photosensitive optical �ber placed immediately behind, in proximity, and parallel to the phase mask. the grating manufactured is related to the period
Λpm
The period
ΛF BG
of
of the used phase mask
according to the following equation:
ΛF BG =
Λpm 2
(4.4)
4. Manufacturing of optical �ber gratings
98
This method is essentially based on a precision photolitographic apparatus together with a UV laser source, ie a KrF excimer laser source at a wavelength of 248 nm.
Hill et al used an unmodi�ed Lumonics excimer laser, which
2
operated at 249 nm, with a cross-section of 0.7 x 2 cm , a pulse duration of 12 nm and a pulse repetition rate of 50 Hz.
Moreover, the unfocused
−2 . With these parameters energy density per pulse was about 100−200 mJ cm −4 RIU and a an induced RI modulation of the �ber core in the order of 10 re�ectivity lower than 20% were been obtained. The phase mask technique was simple to use, resulted in reduced mechanical sensitivity of the grating writing apparatus and was correctly functional even with low coherence laser sources. In addition, because the phase masks were manufactured under computer control, photolitographic imprinting processes, this technique o�ered much �exibility for changing both the grating period and strength of the coupling coe�cient
κ01−01 core-core
given in equation (3.43),
as a function of the distance between the optical �ber and the phase mask. By means of this technique, the value of the induced
∆ ncore
is also in�uenced
both by �ber/mask alignment during the fabrication process and by some intrinsic characteristics, such as nonlinearities in the photosensitive response of the �ber, the imperfect nulling of the zero-order di�raction, the presence of higher order di�racted beams downstream from the phase mask and the low coherence of the laser source. Finally, it was demonstrated that phase masks have a tolerance �uence level per pulse of 1 J cm
−2 without any damage.
Modi�ed phase mask method To remove some limitations of the simple phase mask method, a modi�ed version had been developed in 1993 by Prohaska et al [113]. version made possible to tune the FBG resonance wavelength
The modi�ed
λFBG res
with a
�xed phase mask by using a diverging or converging wavefront incident on the phase mask. The very simple principle of this technique is shown in �gure 4.10. Let us consider a plane wavefront that hits on a positive lens of focal length
f,
hence the grating period photoimprinted on the �ber is given by the following equation:
ΛF BG = M Λpm
(4.5)
4.2. Fiber Bragg gratings
99
Figure 4.10: Schematic of modi�ed phase mask technique used for writing �ber Bragg gratings
where the term
M
represents the demagni�cation factor, which expression is
as follows [3]:
M= where
p
and
q
f − p − q f − p
(4.6)
are the distances between the cylindrical lens and the phase
mask and between the phase mask and the optical �ber, respectively. Thus the grating period could be tuned by varying
p and/or q .
However, the tuning
range was estimated to be within a few tens of nanometers as
q
was limited
by the coherence length of the laser source. The techniques that make use of a phase mask are characterized by the fact that the grating is as long as the length of corrugations in the phase mask itself. Moreover, narrower the FBG bandwidth is, more accurately the shift of the FBG resonance wavelength induced by a measurand can be detected. Having said that and remembering that the FBG bandwidth is inversely proportional to its length, very long (in the order of mm) gratings with high re�ectivity are required. Thus to achieve this goal, a number of variations of the phase mask technique based on phase mask scanning had been reported in the literature [114�116]. For the sake of completeness, the basic idea was to keep the phase mask and the optical �ber held together in proximity and parallel, as shown in
4. Manufacturing of optical �ber gratings
100
�gure 4.9, except that the UV light beam was scanned along the phase mask and optical �ber assembly.
After the roundup of the manufacturing techniques of �ber Bragg gratings, it is worthy of highlighting the advantages of the phase mask techniques compared with the two-beam interferometer ones, which are reported and summarized down here [1]:
the FBG resonance wavelength
λFBG res
depends on the period of the phase
mask and is independent of the wavelength
λU V
of the UV laser source;
they o�er a high mass production with good repeatability at relatively lower costs;
single-beam writing methods improve considerably the mechanical stability of the FBG fabrication apparatus and so they are easy to use in practice;
the requirement for coherent UV laser sources is highly reduced and hence laser sources with low spatial and temporal coherence can be used to replace highly coherent, very expensive UV lasers which are required by the two-beam interferometer methods.
4.3 Long period gratings
T
he �rst long period gratings were written photochemically by means of the use of UV laser light at wavelengths coinciding with the maximum
of the absorption band of defects in Ge-doped optical �bers near 5 eV (see �gure 4.11). This meant that the inscription took place in the �ber core and it was realized by either KrF excimer laser radiation (λ second-harmonic radiation of a CW argon-ion laser
= 248 nm) [5] or the (λ = 244 nm) [44]. Both
the techniques were conventional low-excitation-energy (5 eV)
photochemical
approach, which led to LPGs fabrication via single-quantum photochemical reactions. Therefore, both techniques were based on an ultraviolet laser source at a wavelength around the maximum of the absorption band of �ber defects,
4.3. Long period gratings
101
Figure 4.11: Absorption spectrum of 3.5 mol% Ge-doped fused silica [4] compared with that of pure fused silica
but the gratings writing could be obtained by means of two di�erent methods: using an amplitude mask technique (see subsection 4.3.1) or a point-to-point technique (see subsection 4.3.1). Later, other
non-photochemical
approaches of LPGs inscription were de-
veloped, which were based on a change in refractive index. This RI change could be induced in several ways:
by heating the �ber by means of both
a point-to-point laser radiation of di�erent kind (see subsection 4.3.2), by applying an electric arc (see subsection 4.3.2), by varying the material properties of the �ber (see subsection 4.3.2) or by applying a mechanical pressure (see subsection 4.3.2).
Finally, it is worthy of emphasizing that all listed
non-photochemical approaches pertain to a material excitation by heating or stressing the �ber cladding, that is to say, the deposition of the absorbed energy in the �ber cladding.
4. Manufacturing of optical �ber gratings
102
More recently, various high-excitation-energy point-to-point techniques of LPGs fabrication in standard optical �bers had been developed. These methods included single-photon femtosecond UV (λ
=157
nm) fabrication with an
excitation energy of 7.9 eV and multi-photon femtosecond IR (λ
=800
nm)
fabrication with an excitation energy of 7.8 eV. This meant that the energy band-gap for the core of a low-level Ge-doped standard �ber was lower than 7.8 eV and hence also lower than that of the pure fused silica cladding, which was about 9.3 eV [4].
Looking at �gure 4.11, it is worthy of noticing that
Figure 4.12: Schematic of photoexcitation pathways for di�erent LPG writing techniques in standard optical �ber: the conventional single-photon (5 eV) and three multi-photon approaches [4]
the wavelengths at 211 nm, 264 nm and 352 nm (not explicitly shown in that �gure) (ie the �fth, the fourth and the third harmonics of the 1055 nm fundamental radiation of femtosecond Nd:glass laser, respectively) corresponded to the minimum values of linear absorption in germanosilicate �bers as well as in pure fused silica ones. This last condition was necessary for carrying out a
4.3. Long period gratings
103
two-photon or three-photon excitation with values of total excitation energy in the range from 9.4 eV to 11.8 eV (see �gure 4.12). Such a high values of total excitation energy exceeded the values of energy band-gap mentioned above (ie 7.8 eV). Therefore, the two-photon or three-photon approach for grating writing could be used to imprint photochemically a LPG in both the cladding and the core. This last issues will be resumed in subsection 4.3.1.
4.3.1 Photochemical or UV methods As above-mentioned, photosensitive optical �bers have a well known photoinduced refractive index change imprinted by UV light at a wavelength near 240 nm. The mechanism responsible for a permanent increase in the core RI is unquestionably the absorption of energy into the band of Ge-doped-core �ber defects. This phenomenon was explained as a change in the UV absorption spectrum of the �ber through the
Kramers-Kronig
principle [117]. It is also
true that there was an additional contribution to the RI change caused by the densi�cation of the glass structure, which began with the annihilation of the defects responsible for the absorption. Mizunami et al [118] proved that the use of germanium oxide GeO2 served to increase the �ber photosensitivity by increasing of value of core refractive index.
Therefore, several types
of high-doping GeO2 levels were fabricated during the time.
The increase
of GeO2 doping level from 4 mol% germania of standard low-loss �bers to high-Ge-doped �bers with greater than 10 mol% germania allowed to increase both the grating re�ectivity and the value of index perturbation (∆ and also to reduce the writing time of the grating.
ncore ),
Nevertheless, the value
of Ge-doping level could not be increased to in�nity because in this way the �bers showed a high di�erence in refractive indices, thus the �bers could not ful�ll both the condition of low
∆
�bers (remember the expression of
in equation (3.1)) and the condition of
total internal re�ection
∆
given
(TIR), which
left single mode the �bers themselves. To compensate this problem, later, a new kind of photosensitive optical �bers were manufactured. The core of these �bers was doped with a boron (B) oxide B2 O3 too. In fact, they dealt with B-Ge co-doped optical �bers. The addition of B2 O3 allowed the �bers to keep the same photosensitivity though the di�erence in refractive indices decreased at the same value of standard optical
4. Manufacturing of optical �ber gratings
104
�bers. This meant that B-Ge co-doped optical �bers still were low
∆
�bers
and ful�lled the TIR condition. Moreover, Williams et al [117] demonstrated that, using B-Ge co-doped optical �bers, the same order of magnitude of both index perturbation and grating re�ectivity could be achieved with a strongly reduced writing time of the grating (from one hour to about ten minutes). All that allowed the great di�usion of these co-doped �bers.
Amplitude mask The �rst methodology for writing a LPG was developed in 1996 by Vengsarkar et al [5]. A photosensitive optical �ber was exposed to a KrF excimer laser (λ
=248
nm) through an amplitude mask as shown in �gure 4.13.
Figure 4.13: Experimental setup for writing LPGs by means of an amplitude mask
4.3. Long period gratings
105
The amplitude mask is an array of windows that enlightens periodically the �ber portion in which we want the grating to be inscribed. The UV radiation coming from the KrF excimer laser hits the amplitude mask and part is transmitted in the same direction of the incident wave, part encounters a di�usion array, which di�ract the light beams in a way that they form an interference pattern with the beams not di�racted. It is in these areas, where the interference takes place, which the core RI changes, thus to inscribe the grating. Therefore, a rectangular modulation structure is obtained.
It is worthy of
remembering that only the �ber core absorbs the UV radiation, as explained above. Looking at �gure 4.13, it is obvious that the grating length is as well as the length of the amplitude mask. The key parameter for the correct writing of the grating by means of this technique is the distance
d
between the �ber
and the amplitude mask. In fact, the di�usion relationship takes into account this distance too, which have to be kept within a certain value. Otherwise the intensity decay of the di�racted beams will occur, which in turn would lead to the incorrect writing of the grating. By using the experimental setup discussed above, typical exposure condi-
−1 , pulse repetition frequency
tions were the following: energy of 250 mJ pulse
of 20 Hz and beam area of 2.6 x 1.1 cm. In these conditions, typical fabrication times were around 10 minutes for photosensitive �bers. The time evolution of the grating with a period of
Λ=
474
µm
during the fabrication process is
reported in �gure 4.14 by monitoring actively the transmission spectrum of the �ber. The �gure 4.14 shows the growth of the grating over the time by stopping the UV light exposure from 1 minute (curve A) to about 5 minutes (curve E). It is clear that the loss peak and the associated resonance wavelength of the coupled cladding mode increased during the time as a function of the total excitation energy absorbed by the �ber core. Moreover, the spectral characteristics of the grating can be further modi�ed by changing the length of the grating (or the number of grating fringes, equally) or the RI pro�le of the �ber. The same results were achieved a year later by Bhatia et al [44]. LPGs with di�erent periods were written in hydrogen-loaded �bers with UV radiation (power of about 120−140 mW) from a frequency-doubled argon-ion continuous-wave laser by using the same physical and experimental mecha-
4. Manufacturing of optical �ber gratings
106
Figure 4.14: Time evolution of a LPG with period of
Λ=
474
µm
at 1-min
intervals [5]
nism. In fact, chrome-plated amplitude masks with rectangular transmittance functions were used to vary the grating periodicity from 340
µm
to 280
µm.
The gratings were annealed at 200 for approximately 15 hours to remove the residual hydrogen and the unstable UV-induced index changes.
In this
way, gratings experienced a good thermal stability.
Point-to-point As introduced in section 4.3, photosensitive optical �bers had attracted much interest because they allowed one to imprint an index modulation in the
4.3. Long period gratings
107
�ber core. The �rst gratings were written by UV radiation with the excitation of a singlet-singlet transition band (near 242 nm) of a germanium-oxygende�cient center (GODC). It was also well known that a GODC had a weak forbidden absorption band with its maximum at 330 nm due to the singlettriplet transition [119], namely, a high-excitation-energy method. Dianov et al [6] showed for the �rst time that the direct photoexcitation of the GODC triplet state could induce a change in germanosilicate glass structure similar to those induced by the band excitation of the GODC singlet state at 242 nm and hence could lead to an index change. This meant that it was also possible to use other wavelength values of laser sources around 330 nm for writing a LPG. In addition, Dianov et al [6] proved experimentally that the absorbance of the GODC triplet state band was three orders of magnitude smaller than that of the common GODC singlet state band.
Having said that, however, it was interesting to understand better the physical mechanism behind the direct triplet excitation. Therefore, Dianov et
+ laser, which
al [6] made some experiments using a coherent Innova 200 Ar operated in the 333364-nm multiline regime.
The gratings were written by
means of a point-to-point technique in step-index �ber characterized by a 10 mol% GeO2 in the core and a cut-o� wavelength of 0.92
µm.
The UV light
was focused at the �ber core by means of a spherical silica lens.
Typical
diameter of focal spot measured by an optical microscope was about 20
µm.
The �ber was placed upon a computer-controlled translation stage with a resolution of 3
µm.
The grating period of 200
µm was chosen in order to place
the resonance wavelengths of the coupled cladding modes (from p = 1 to p = 15) in the working spectral range of 12001600 nm. time of each point was 1 s.
A typical irradiation
After the irradiation of a half-period region,
the UV light was blocked by a shutter and the �ber was moved to write the next grating period: from this manufacturing technique that came out the name of point-to-point technique. Following this procedure, they formed an approximately rectangular grating pro�le along the �ber axis. The total grating length
L
was 4 cm.
Moreover, they varied the total UV intensity
−2 range by inserting broadband optical �lters in the
in the 20170 kW cm
laser beam, by keeping a constant relation between the intensities of the laser lines and therefore between their contributions to the induced refractive index.
4. Manufacturing of optical �ber gratings
108
The grating spectrum measurements were performed by an optical spectral analyzer simultaneously with the grating preparation.
A halogen lamp was
used as a white-light source. An example of LPG recorded with this technique is given in �gure 4.15. Figure 4.15 shows the transmission spectrum of a 4cm-
Figure 4.15: Transmission spectrum of a 4cm-long LPG with a period of 200
µm
written in 10 mol% Ge-doped �ber [6]
long LPG with a period of 200
µm
written in 10 mol% Ge-doped �ber by
means of a UV light source at a wavelength near 330 nm and with a power
5 W cm−2 .
density of about 1.7 x 10
From this �gure, it is possible to see
that the strongest loss peak on the right, which corresponds to the coupling between the fundamental core mode and a high order cladding mode (p = 15), has a depth of 3 dB in accordance with what have just been said. This fact
4.3. Long period gratings
109
limits unquestionably the pratical use of this band and so this methodology for the manufacturing of photoinduced grating structures. By the way, the obtained value of the induced RI change in the �ber
−4 RIU. The
core for the grating shown in �gure 4.15 was about 1.9 x 10
Figure 4.16: Dependence of induced refractive index on near-UV power density [6]
authors also studied the dependence of the induced RI in the core of the �ber (∆
ncore )
on the power density of the UV radiation. The curve, reported in
�gure 4.16, showed a saturable behavior as in the case of common singletsinglet excitation. Later, starting from the studies of Dianov et al, other authors aimed at contributing to the development of new high-excitation-energy techniques in order to understand better the physical mechanism behind the grating inscription. A good article about this topic was written in 2006 by Nikogosyan [4].
4. Manufacturing of optical �ber gratings
110
The author made a comparison with the di�erent point-to-point LPG manufacturing techniques based on high-intensity femtosecond UV and near-UV laser pulses.
As mentioned previously and based on the analysis of the ab-
sorbed energy distribution (see �gure 4.12), LPGs were induced by means of a two-photon (λ
=
211 nm and
λ=
264 nm) or three-photon (λ
=
352 nm)
absorption mechanism and were characterized by preferential energy deposition in the �ber cladding, which led to a high asymmetry of RI pro�le and resulted in high birefringence properties of gratings. The experimental setup of high-intensity point-to-point LPG manufacturing is shown in �gure 4.17.
For LPGs recording, the author used the fourth
Figure 4.17: Schematic of experimental setup for point-to-point LPGs manufacturing with high-intensity femtosecond UV and near-UV laser pulses [4]
(264 nm), the �fth (211 nm) and the third (352 nm) harmonics of the fundamental radiation of a commercially available femtosecond Nd:glass Twinkle laser. The pulse duration was 220 fs (FWHM) for 264 nm pulses and about 250 fs (FWHM) for 211 nm and 352 nm pulses. The beam diameter at FWHM was 0.3 cm, 0.22 cm and 0.27 cm at 264 nm, 211 nm and 352 nm, respectively. The repetition rate was 27 Hz and the pulse energy was maximal in the case of the fourth harmonic (up to 200
µJ)
and minimal in the case of the third
4.3. Long period gratings and �fth harmonics (up to 100
111
µJ).
The femtosecond UV pulses were focused
by means of a 45.4 cm fused silica lens (in the case of 264 nm) or by a 48.6 cm CaF2 lens (in the other cases) through a slit of width 150
µm (or 200 µm),
onto the �ber (with the acrylate coating removed), which was placed behind the slit at a distance of about 100
µm.
This allowed author to approximate
the spatial distribution of light intensity on the �ber by that on the slit. The displacement of the lens with respect to the �ber allowed author to change
−2
both the incident UV irradiation intensity in the range of 100-1000 GW cm
−2 . The �ber
and the �uence (energy) per pulse in the range of 30-200 J cm was �xed on a 50 mm (1
µm resolution) computer-controlled translation stage
PI 405.DG (Physik Instrumente) and was exposed point by point with a pe-
Λ = 300 µm and with a total length of the grating of 2 cm (or with a period Λ = 400 µm and total grating length of 2.5 cm). The total number of
riod
recorded fringes was 67 and 63, respectively. The evolution of loss peaks in the LPG transmission spectrum was monitored in situ with a halogen lamp and an optical spectrum analyzer AQ6317C (Yokogawa Europe BV). The UV exposure and �ber translation processes were both computer-controlled using LabVIEW and a PCI-GPIB card (both from National Instruments). In the experiments, the author used the standard telecom �ber SMF-28 with a core diameter of 8.2
µm
and cladding diameter of 125
µm.
The sensitization of
the �ber was performed in a hydrogen atmosphere at 160 bar at 80 for 90 hours.
For the sake of clarify, the author gathered in several tables the experimental data regarding similar LPGs (with a period of 300
µm
and a length
of 2 cm) written by di�erent laser sources in the spectral range between 157 nm and 352 nm, that is to say, from UV to near-UV spectrum. Looking at table 4.1, it follows that the LPGs, recorded in the hydrogenated SMF-28 �ber by high-intensity 352 nm pulses, possess the highest value about the grating strength, not only in comparison with the other point-to-point femtosecond 211 nm and 264 nm techniques, but also in comparison with all the other known photochemical techniques (λ
=
248 nm and
λ =
157 nm).
Further-
more, such a high value about the grating strength was characteristic of LPGs inscribed in the same �ber by non-photochemical techniques (eg CO2 laser irradiation, where practically all the absorbed energy was localized in the �ber
4. Manufacturing of optical �ber gratings
112
Table 4.1: Comparison between the experimental data on LPG inscription e�ciency in a hydrogen-loaded Corning SMF-28 �ber for point-to-point technique at di�erent source wavelengths (LPGs of the same period, 300
µm,
and
of the same length, 2 cm).
Source
Incident
Incident
Grating
Resonance
wavelength
intensity
�uence
strength
wavelength
(nm)
−2 ) (GW cm
−2 ) (J cm
(dB)
(nm)
1300
17
1464
5
21
1594
248
0.02
157
0.0002
264
470
38
24
1487
211
125
32
25
1434
352
1090
197
30
1450
cladding). An explanation of this fact was given by means of a photograph of the LPG section shown in �gure 4.18.
The LPG was written in a stan-
dard SMF-28 �ber with the laser radiation at 325 nm characterized by an incident intensity of 1350 GW cm
−2 and an incident �uence of 208 J cm−2 .
From �gure 4.18 it was easy to see regular damage in the cladding area near the incident laser radiation. It is worthy of noticing that the length of each periodic damage was 150
µm
as well as the length of the slit in �gure 4.17.
Looking at that �gure, two main observations followed: �rst, the absorbed energy was distributed very non-uniformly inside the �ber similar to that in the experiments on LPGs inscription involving a CO2 laser source and, second, as the value of band-gap energy for Ge-doped fused silica was more than 7.1 eV (see �gure 4.12) and one photon of 352 nm radiation was equal to 3.53 eV, the excitation energy of two photons (7.05 eV) was not su�cient for the excitation of either the cladding or the core. Thus these experimental data suggested a three-photon absorption mechanism for high-intensity LPG inscription. Finally an important observation can be made.
In fact, this last UV
method for LPG manufacturing can be seen as a special class of photochemical methods because, although the physical mechanism of grating formation is based on high-excitation-energy photochemical absorption, the grating inscrip-
4.3. Long period gratings
113
Figure 4.18: Photograph of the LPG section written by means of point-topoint technique based on high-intensity femtosecond laser pulses at a wavelength of 352 nm [4]
tion depends strongly on the irradiation intensity (not a saturable behavior) and the gratings show the typical optical characteristics of gratings written non-photochemically as it will be explained in next subsection.
4.3.2 Non-photochemical or non-UV methods As described in subsection 4.3.1, the �rst LPGs were written exposing a Ge-doped �ber to UV radiation from a KrF laser through an amplitude mask. This method needed to make photosensitive the �bers with high levels of germanium doping or to use already doped �bers. During the time, several ways to improve the photosensitivity had been suggested, such as co-doping the �ber with photosensitive elements, hydrogenation and exposure of the �ber to other types of radiations. Unquestionably, �ber hydrogenation was a
4. Manufacturing of optical �ber gratings
114
good way to increase the photosensitivity, although is was a time-consuming procedure that also required a post-UV irradiation heat treatment in order to restore the spectral position of the resonance wavelengths due to hydrogen out di�usion. Moreover, the stability of UV-induced LPGs at high temperatures (greater than 400) was not so straightforward. In fact, it was proved that the decrease of RI modulation during the annealing process represented the main practical constrain in such applications. The necessity for a large number of amplitude mask with di�erent pitches was another disadvantage, although it could be overtaken by means of the implementation of a more �exible pointto-point writing technique (as described in subsection 4.3.1), but with the increase of both the fabrication time and the costs of the equipment. Consequently, several non-photochemical or non-UV techniques of LPGs manufacturing had been developed. These methods relied on physical deformation of the �ber or on RI variation produced by CO2 lasers, femtosecond laser pulses in both the UV and IR spectra, ion implantation or electrical discharges. All these non-photochemical methods had proved to manufacture LPGs with high thermal stability due to the process of grating inscription characterized by a local heating of the �ber.
Furthermore, they were much
simpler techniques and did not need expensive laser equipment. Finally, LPGs could be written in any type of �ber, because the grating characteristics were mostly de�ned by the intrinsic properties of silica glass itself [10].
Point-to-point Among the non-UV techniques, the point-to-point techniques, which make use of infrared (IR) lasers, are widely used. The literature reports two di�erent techniques, which use pulsed laser sources emitting in two di�erent IR wavelength range: the former emitting in the 800 nm range, the latter in the 1060 nm (CO2 laser).
The �rst technique was developed in 1999 by Kondo et al [7]. It was previously demonstrated with some experiments by Miura et al [120] that focused irradiation of femtosecond Ti:Sa laser pulses causing a permanent RI increase in various glasses and thus in optical �bers. Therefore, Kondo et al showed
4.3. Long period gratings
115
for the �rst time how to induce a periodic RI modulation in the core of a single-mode optical �ber by means of a light which wavelength was absorbed neither by the �ber core nor by the �ber cladding. The experimental setup for this fabrication technique is reported in �gure 4.19.
The optical �ber that
Figure 4.19: Experimental setup for LPGs manufacturing by means of a point-to-point non-UV technique based on a IR laser source [7]. ND, neutral density. CCD, charge-coupled device was used by the authors was a standard single-mode �ber for telecommunication (NA = 0.11, mode �eld diameter = 9.3 = 125
µm ±
2
µm,
cut-o� wavelength = 1260
µm ± 0.5 µm, clad diameter nm ± 40 nm). The �ber core
and cladding were Ge-doped and pure fused silica glass, respectively.
The
laser pulses that were used to induce a RI change were obtained from a regeneratively ampli�ed Ti
3+ :Al O laser pumped by an Ar+ laser. The pulse 2 3
width was 120 fs, the wavelength was 800 nm and the repetition rate was
4. Manufacturing of optical �ber gratings
116
200 kHz. The laser beam was guided by means of a microscope and �nally focused into the �ber core by means of a 20X objective (NA = 0.46). The features produced during focused irradiation of femtosecond pulses were observed through a CCD camera mounted upon the microscope. The �ber, which was �xed on a computer-controlled XYZ-translation stage, was irradiated by the point-to-point method. An optical spectrum analyzer real-time monitored the transmission spectrum of the fabricated LPGs.
The laser power was set at
150 mW by use of a neutral density (ND) �lter. The beam size before the objective was 6 mm and the irradiation time was 10 s for each spot. Assuming that the femtosecond laser beam had a Gaussian pro�le, the spot size at the
2
focal point and the Rayleigh length
were estimated to be 2
µm
and 3
µm,
−2 and each spot was subjected
respectively. The �uence per pulse was 24 J cm
−2 . With this value of total exposure dose, the −3 RIU. expected value of the RI increase could be estimated to be about 10
to an energy dose of 50 MJ cm
The same authors proved also that, for a correct grating inscription, the acrylic polymer coating of the �ber must be removed before writing the grating.
Otherwise, the index change in the core did not occur obtaining only
the �ber coating ablation. So, after removing the �ber coating, the �ber was irradiated by means of the experimental setup described above. Figure 4.20 showed the transmission spectrum of a 29.9 mm-long LPG with a grating period of 460
µm.
Large loss peaks whose FWHM were approximately from
10 nm to 20 nm could be clearly observed. Moreover, many small loss peaks could also be observed and the transmission spectrum of the �ber went to a more complicated shape.
This feature con�rmed that the focused radiation
induced a RI increase in the �ber core as well as in the �ber cladding. Thus, unless laser pulses were focused only in the core, the RI of the cladding also changed.
The complexity of the spectral shape had been attributed to the
irregularity of the index modulation. The authors demonstrated that the RI increase induced by focused irradiation of femtosecond pulses at 800 nm could not be attributed to Ge-related defects. In fact, from observations given by Miura et al [120] with an atomicforce microscope (AFM), it was proved that a local densi�cation in glass irradiated by focused radiation of femtosecond pulses at 800 nm was the main
2 For more details see the website http://en.wikipedia.org/wiki/Rayleigh_length
4.3. Long period gratings
117
Figure 4.20: Transmission spectrum of a 29.9 mm-long LPG with a period
Λ=
460
µm
[7]
physical mechanism involved in the grating inscription. In addition, a nonlinear reaction through a multi-photon process and/or conventional heating by a multi-photon transition occurred during laser irradiation. Furthermore, by varying the laser �uence, it was revealed that the photoreaction, which induced the RI change, had a threshold in �uence (a saturable behavior). Finally, it was also proved that LPGs fabricated by a focused radiation of femtosecond pulses showed high resistance to thermal decay despite of having no special stabilization. This thermal stability was achieved because the cause of the RI increase induced by a focused radiation of femtosecond pulses was di�erent (non-photochemical) from that of the UV-induced RI increase. Although this methodology had the advantage to allow the writing of gratings in both photosensitive and standard SMF �bers, it showed the drawback of changing the RI not only in the core of the �ber, but also in the cladding, even though the laser beam was focused into the �ber core only. This means that the loss peaks in the �ber transmission spectrum were very close to each other making more complicated to explain the transmission spectral shape (see
4. Manufacturing of optical �ber gratings
118
�gure 4.20), which is a�ected by the coupling occurring between the asymmetric cladding modes.
Moreover, looking at �gure 4.19, the experimental
setup was clearly di�cult to use in practice and made up of a very expensive equipment.
The second point-to-point technique was published for the �rst time in 1998 by Davis et al [8]. The proposed LPGs manufacturing method was based on direct exposure of the optical �ber to focused CO2 laser pulses (10.6
µm).
By this new, simple and high controllable technique, the �ber was not physically deformed, as occurred in the case of an ultraviolet exposure, thus the physical mechanism giving rise to the RI increase was both the residual stress relief and the densi�cation of the �ber glass rather than the photoexcitation. LPGs were written into both non-H2 -loaded and H2 -loaded dispersionshifted �bers.
The experimental con�guration consisted of a computer-con-
trolled translation stage, which positioned the �ber in an alignment �xture. Under the control of a computer, each laser pulses (intensity of 0.5 W, duration of 300 ms) were focused onto a 140
µm diameter spot (�uence per pulse of 7.7
−2 ) at the desired position along the axis of the �ber. An optical imaging J mm system mounted above the �ber aided in the alignment and enabled veri�cation that no physical deformation was occurred. A broadband source with a freespace wavelength in the range from 1.4
µm
to 1.6
µm
and an optical spec-
trum analyzer were used to monitor the �ber transmission spectrum during the grating inscription. Figure 4.21 shows transmission spectrum of LPG written in non-H2 -loaded and H2 -loaded dispersion-shifted �bers. The di�raction of the core guided light into the cladding modes produced the characteristic loss peaks shown for both �bers. The H2 -loaded �ber exhibited higher writing sensitivity, and therefore a shorter pulse duration (200ms) was used. Only 20 periods were written instead of the 40 periods used for non-H2 -loaded �ber. The periodic spacing (Λ
=
480
µm)
of the pulses, and thus the grating period
was the same for both the �ber gratings. However, the values of the resonance wavelengths of the grating written in H2 -loaded �ber were di�erent compared to the non-H2 -loaded �ber, indicating that the couplings to cladding modes occurred with di�erent propagation constants. Later, the same point-to-point CO2 laser technique was resumed in 2004
4.3. Long period gratings
119
Figure 4.21: Transmission spectrum of LPG written in non-H2 -loaded and H2 -loaded dispersion-shifted �bers [8]
and was improved by Braiwish et al [9]. One of the main advantages of using a CO2 laser for the LPGs fabrication was unquestionably the possibility of using also standard SMF optical �bers. No hydrogen loading or dopant was needed. In addition, the point-to-point method gave a higher degree of control over the grating parameters and allowed one to monitor real-time the spectral response during the grating fabrication. These features made the point-to-point CO2 laser technique one of the most attractive and desiderable technique for LPGs manufacturing. Gratings were written into hydrogen-free Corning SMF-28 single-mode �ber using the con�guration shown in �gure 4.22.
A cylindrical lens was
120
4. Manufacturing of optical �ber gratings
Figure 4.22: Fabrication apparatus for writing LPGs by point-to-point CO2 laser exposure [9]
used to focus the CO2 laser beam into a narrow line. The �ber was aligned at a right angle to the focal line of the lens and was attached to a computercontrolled motorized translation stage that could be translated to create any desired grating period. A shutter was placed before the lens to accurately control the exposure time of the CO2 laser beam. An optical spectrum analyzer,
4.3. Long period gratings
121
in combination with a broadband source, was used to monitor the transmission spectrum of the grating. A polarizer was also used to control the CO2 laser beam polarization.
Additional instruments such as an optical power meter
and a CO2 laser spectrum analyzer were used for monitoring purposes.
To
control the �ber during fabrication, a camera with a high-magni�cation longworking-distance microscope was mounted above the �ber and connected to a video monitor. This allowed any physical deformation to be observed. The laser beam wavelength was set to 10.59
µm
since material re�ectance was low
and absorption was high at this wavelength.
The entire fabrication process
was computer-controlled with a custom LabVIEW program. The fabrication program was designed to allow monitoring of the transmission spectrum as well as the laser power for each grating period.
It also allowed authors for
continuous control of the shutter during the fabrication. These features made it possible to change the number of shutter exposures per period, and thus to tailor the transmission spectrum of the grating. Because of the high absorption at the wavelength of about 10.6 laser-induced LPGs had azimuthally varying RI pro�les.
µm,
CO2
Although the RI
change in an UV-induced grating occurred mainly in the �ber core, the index modulation induced by the CO2 laser radiation occurred over the entire crosssection of the optical �ber and was higher on the side of the �ber toward the laser beam. Thus the RI change was induced not only in the �ber core but also in the �ber cladding, which meant that the couplings occurred also to antisymmetric cladding modes. That is to say, when the �ber was exposed to the CO2 laser beam, the absorption was higher on the �ber side that faced the laser beam. As a result of the azimuthal asymmetry, CO2 induced LPGs were very sensitive to �ber bending. Therefore, the transmission spectrum of the �ber was signi�cantly a�ected by any axial rotation of the grating.
Electric arc Among the non-UV methods of LPGs manufacturing, the most promising was that based on electrical discharges.
This technique was developed
for the �rst time in 1998 by both Godbout et al [121] and Kosinski and Vengsarkar [122].
As above-mentioned in subsection 4.3.2, the electric arc
technique is much simpler and did not required expensive laser equipment.
4. Manufacturing of optical �ber gratings
122
This features together with the good thermal stability of the fabricated LPGs allowed electric arc technique to spread greatly. The �rst comprehensive study about the performance and the physical mechanism behind the grating inscription was reported for the �rst time in 2001 by Rego el at [10]. The authors studied also the spectral characteristics of LPGs written in both standard SMF and photosensitive �bers using the �exible and low-cost electric arc technique. For LPG inscription, Rego et al [10] used a technique similar to that described in previous works [121, 122] but with some di�erences. A schematic of the fabrication setup is shown in �gure 4.23.
The fabrication process
Figure 4.23: Fabrication apparatus for writing LPGs by electrical discharges produced by a commercial splicer
consisted of positioning a portion of uncoated �ber between the electrodes of a commercial splicing machine. One end of the �ber was clamped in a �ber holder on top of a computer-controlled translation stage with a precision of 0.1
µm.
At the other end of the �ber, a mass was attached to keep the �ber
under a constant axial tension. An electric discharge was then produced with a current less than 10 mA and duration of about 1 s, exposing a portion of the �ber of about 150
µm length.
Afterwards, the �ber was moved by the selected
grating period, typically in the range from 400
µm
to 700
µm.
The last two
4.3. Long period gratings
123
steps were repeated 15−55 times, depending on the grating length that we want to achieve, in order to give rise to periodic perturbations along the �ber axis due to its local heating. The local temperature of the �ber during the arc exposure was more than silica glass softening temperature (about 1660 ) because, for moderate applied tension (a mass of about 10 g as in �gure 4.23), a tapering of the �ber was observed, which increased as the axial tension was increased. The same authors suggested three main physical reasons, which could explain the mode couplings in these gratings: the �ber diameter decrease, or rather the periodical tapering of the �ber cladding, the dopant di�usion in photosensitive optical �ber and, �nally, a change of the glass properties by the fast local heatingcooling process. Although the local dopant di�usion out of the �ber core could not be totally excluded, it was demonstrated that the dopant di�usion played a minor role in the grating formation. Furthermore, when low axial tension was applied to the �ber (mass of about 5g) a very small decrease in the �ber cross−section was observed (change in the diameter lower than 1%). On the contrary, the changes in glass properties due to the fast local heating−cooling process, annealed periodically the residual stresses of the �ber, creating new stresses in the �ber itself, which gave rise to mode coupling.
In details, it was discussed [10] that such a process having more
than 1000 s
−1 cooling rate had to result in a change of the �ctive temper-
ature of the glass in the local portion of the �ber exposed to the electric arc. The change of the �ctive temperature resulted, in turn, in a change of glass density, viscosity, refractive index and Rayleigh scattering. To prove all that, Rego et al [10] exhibited the transmission spectra of LPGs written in three di�erent optical �bers by means of the electric arc technique.
The gratings were written in a 1.5 mol% GeO2 -doped (dotted
curve in �gure 4.24) and sulfur-doped (solid curve in �gure 4.24) �bers under an axial tension caused by a mass of 22.8 g (GS ) and exposed to the electric arc for 17 and 35 times, respectively. The electric discharge (one per period) was characterized by a current of 9 mA and a duration of about 1.1 s. A mass of 5.1 g (lowest axial tension) was used in the case of the nitrogen-doped (dashed curve in �gure 4.24) �ber that was exposed for 1 s to a 10 mA electric arc current for 55 times. It is clear that fabrication conditions as well as the types
4. Manufacturing of optical �ber gratings
124
Figure 4.24: Transmission spectra of three di�erent LPGs with the same period of 540
µm
[10]
of the �bers used are di�erent, thus the resonant loss peaks show di�erent spectral position. The authors studied also the in�uence of the axial tension on grating inscription. The LPGs reported in �gure 4.25 had the same period of 540
µm
and were written in 1.5 mol% GeO2 -doped �ber (as the dotted curve in �gure 4.24) after a number
n
of electric arc discharges (one per period).
e�ect of pre-annealing at 1100 for 30 minutes was also shown.
The
As can
be seen in �gure 4.25, by keeping the arc parameters constant, as the axial tension increased from the lowest value GB to the highest one GSS it was possible to obtain higher isolation loss with less discharges, although the insertion loss increased. So it was possible to notice that the increasing axial tension, which also a�ected the �ber cross-section, was favorable to the writing process. Another important aspect, that it was possible to note as well, was that the reproducibility of this technique increased using the lower axial tension (GB ). Looking at �gure 4.25, another observation could be made: the
4.3. Long period gratings
125
Figure 4.25: The in�uence of di�erent axial tension (GB , GS and GSS ) on grating inscription [10]
�ber tapering was the secondary physical e�ect to the grating inscription since it was possible to write gratings with a large value of transmission after few discharges (about 10) without a change of the �ber cross-section. Due to the physical mechanism behind the grating formation using the electric arc technique, the RI perturbations along the �ber axis were induced not only into the �ber core but also into the �ber cladding.
As discussed
previously, this meant mode couplings to antisymmetric cladding modes. In 2007, Ivanov and Rego [11] studied for the �rst time the origin of antisymmetric perturbations in arc-induced LPGs.
They demonstrated that these
perturbations were caused by the temperature gradient in the �ber, which was induced, in turn, by the temperature gradient in the arc discharge. As above-discussed, di�erent mechanisms were involved in the inscription of arcinduced gratings. Among those mechanisms, an important role was certainly played by the modulation of the core diameter, which was due to �ber tapering, strain induction or relaxation, microbending and microdeformation.
126
4. Manufacturing of optical �ber gratings
In fact, one of the consequences of the temperature gradient was the periodical microdeformation that consisted in a shift of the �ber core under arc discharges. The authors proved that such microdeformation was responsible for the coupling to antisymmetric cladding modes. To give evidence in favor of this, a photograph of the arc discharge produced by a commercial splicer is shown in �gure 4.26. The current produced during an arc discharge is a direct
Figure 4.26: Photograph of the arc discharge showing its asymmetry [11] current, hence the arc is directional and the center between the electrodes is not the center of symmetry.
Moreover, the electrode at the bottom (cath-
ode) glows only at its tip, while the electrode at the top (anode) glows over a much larger area. The arc itself is brighter near the lower electrode. Thus, it could be expected that there is a gradient of temperature explaining the origin of the antisymmetric perturbations.
The authors found two di�erent
4.3. Long period gratings
127
types of geometric deformation of the �ber during an arc discharge: tapering and microdeformation. Tapering was a symmetric diameter reduction and an elongation of the �ber. The degree of the �ber tapering depended on both the pulling axial tension and the value and duration of the electric current in the arc.
With typical arc discharge parameters, �ber deformation induced cou-
pling to symmetric modes only. However, the coupling constant corresponding to a typical �ber diameter reduction of a few percent was too small to explain the grating formation. Therefore, microbending occurred when the �ber was locally displaced in the plane lateral to the �ber axis due to some asymmetry in the fabrication setup. Such a di�erence between the two sides of the �ber, which was caused by the di�erence in silica viscosity, induced a core shift or geometrical microbending that led to the grating formation. This di�erence in viscosity itself was due to the temperature di�erence between the two electrodes. To estimate the viscosity di�erence between the two sides of the �ber heated by the arc, the authors proposed to place a silica capillary into the arc instead of the �ber (too di�cult) as shown in �gure 4.27. From the �gure 4.27
Figure 4.27: Photograph of the asymmetric deformation of a silica capillary (56
µm
/ 125
µm)
submitted to an arc discharge [11]
4. Manufacturing of optical �ber gratings
128
it could be clearly seen that the capillary was asymmetrically swollen as could occur in optical �bers. Finally, it is worthy of highlighting that, although the symmetric tapering of the �ber did not induce coupling to the antisymmetric cladding modes, it had a strong in�uence on the LPGs spectra because the average decrease of the �ber diameter caused a wavelength shift of the LPGs resonance wavelengths. During the �rst time of my research activity about optical �ber gratings, we focused our attention on arc-induced LPGs.
Due to a �exible, simple
and cheap manufacturing system, a lot of measurements were carried out in order to �nd the correct values of both the current intensity and the arc duration for manufacturing gratings with high e�ciency mode coupling.
In
the �rst measurements we decided to use arcs characterized by high current intensity (about 40 mA) and very short duration (about 1 ms).
By using
these parameters, we saw clearly that gratings were very sensitive to both �ber bending and the position of the �ber (birefringence). This phenomenon was easily explained if we assumed that the grating was written mainly in the cladding of the �ber. In fact, despite having high current intensity, the arc duration of the arc was too short to ensure an e�cient heat di�usion into the core of the �ber as well. Thus, we decided to decrease the current intensity up to 12 mA and to increase the arc duration until to 200 ms. With these choices, the change in refractive index regarded not only the �ber cladding but also the core of the �ber. To better understand the mechanism of grating inscription using the electric arc technique, we made a photograph of an electric arcinduced LPG written in a standard step-index SMF-28 optical �ber by means of the transmission optical microscope Nikon Optiphot (see �gure 4.28).
As
can be seen, the e�ect of both core and cladding perturbation was clearly visible (brighter regions) together with the physical deformation of the �ber (�ber tapering), which was caused by the electric discharges generated by the arc of the splicer. By the way, the main constrain of this methodology was the poor reproducibility for the arc-induced LPGs together with the great number of loss peaks in the �ber transmission spectrum due to antisymmetric couplings too. For the sake of completeness, it is worthy of noticing that some of the above-discussed features about arc-based LPGs, and more generally of the
4.3. Long period gratings
129
Figure 4.28: Photograph made by the transmission optical microscope Nikon Optiphot of an electric arc-induced LPG written in a standard step-index SMF-28 optical �ber
di�erence between UV and non-UV methods, have been recently called into question by Smietana et al [123]. The authors presented for the �rst time a comparative study of LPGs written by point-by-point UV radiation at
λ =
248 nm and by electrical arc discharges. The gratings used for comparative purposes were inscribed in a highly photosensitive B-Ge co-doped step-index optical �ber with two di�erent grating periods, 350
µm
and 400
µm.
They
observed that the spectra of the gratings manufactured by electric arc were shifted to the shorter wavelengths, while the gratings manufactured by UV radiation showed some distortions and an extra attenuation band at 1200 nm. As previously mentioned more than once, it is certainly true that the characteristics of a gratings, while in�uenced by the �ber properties, depend mainly
Λ, on the induced change in the refractive index ∆ n, on technology and on the grating length L. The di�erence between
on the grating period the writing
the spectra has been explained by the fact that the arc discharge induced a �ber tapering, thus resulting in decreased core and cladding diameters.
In
detail, the �ber tapering was caused by the axial tension applied to the optical �ber during the grating fabrication. It has always been said that LPGs manufactured by means of the UV exposure can be considered as symmetric in terms of the induced RI modulation along the azimuthal direction of the �ber [11]. But the resonance observed by Smietana et al [123] at a wavelength of 1200 nm in the spectrum of the UV-irradiated grating was the result of the coupling to an asymmetrical cladding mode. The same authors proved by the polarization-dependent loss measurements that there was a strong azimuthally
4. Manufacturing of optical �ber gratings
130
asymmetric RI change due to single-side exposure and deposition of the energy in the cladding [124]. This could be expected because the B-Ge co-doped �bers required much higher UV radiation to obtain a grating e�ect than did the hydrogenated �bers [125].
Anyway, the good quality of the spectra ob-
tained by Smietana et al in our proved the possibility of achieving coupling to only symmetrical cladding modes, by reducing the power of the laser and thus avoiding damage to the surface of the �ber.
Moreover, the statement
that gratings manufactured by means of the arc electric method gave rise to couplings to antisymmetric cladding modes only seems to be not necessary true considering the work of Smietana et al [123].
Ion implantation Another non-photochemical method for the fabrication of long period gratings was based on the use of a RI increase induced by ion implantation. This technique was reported for the �rst time in 2000 by Fujimaki et al [12]. In fact, it was well known that a relatively high RI increase in the order of magnitude of 10
−3 RIU could be obtained by ion implantation in almost all silica-based
optical �bers.
The physical mechanism behind the RI increase was proved
to be the compaction of the glasses [126].
Figure 4.29 shows the schematic
of ion implantation technique. The optical �ber used in the experiment was a Corning SMF-28 �ber. The core of the �ber was Ge-doped silica glass of 97SiO2 :3GeO2 and had a diameter of 9
µm.
The core was embedded in a
cladding of pure silica glass with a diameter of 125
µm.
The �ber was im-
2+ ions at room temperature in a vacuum of 10−6 Torr through
planted with He
a metal amplitude mask by means of the use of 1.7 MV tandem accelerator. The acceleration energy of the He ions was 5.1 MeV, the maximum attainable at that time.
The mask was made of Ni:Co and had 29 periods of 170
pitch grating with 60
µm
µm
spacing. The transmission spectra of the fabricated
gratings were observed with an optical spectrum analyzer (Hewlett-Packard 70951A). Figure 4.30(a) shows a photograph of the cross-section of the He-ion implanted optical �ber, when a white light was launched through the �ber itself. Obviously, the bright circle at the center was the light guided by the core of the �ber. The light arc across the �ber indicated the region in which the im-
4.3. Long period gratings
131
Figure 4.29: Schematic of ion implantation technique with a metal amplitude mask [12]
planted He ions induced a signi�cant RI increase. As shown in �gure 4.30(b), the depth of the arc from the optical �ber surface was about 24
µm,
which
corresponds to the projected range of the 5.1 MeV He ions in silica glass. Since ions must reach the core of the optical �ber to manufacture LPGs, the authors etched the cladding of the optical �ber with hydro�uoric acid (10% HF in H2 O) for 7 hours and prepared an optical �ber with a cladding diameter of about 53
µm,
as shown in �gure 4.30(c). Figure 4.31 shows the transmis-
sion spectrum of the grating fabricated by the ion implantation with a dose
15 He2+ cm−2 after the etching of the �ber cladding in the way just
of 20 x 10
described. Looking at the transmission spectrum, a very sharp and e�ective loss peak owing to the coupling between the fundamental guided mode and a cladding mode was observed around 1410 nm. Moreover, as shown in �gure 4.30, the induced RI increase indicated by the light arc was not only in the core but also in the cladding of the �ber. This was so because the ion implantation induced a quite-high RI increase even in pure silica glass and hence in the �ber cladding.
The RI increase in the cladding caused an issue for
the practical use of this gratings, because the fundamental guided core mode
4. Manufacturing of optical �ber gratings
132
Figure 4.30: Photograph (a) and sketch (b) of the cross-section of the He-ion implanted optical �ber.
Sketch (c) of the cross-section of the optical �ber
etched with hydro�uoric acid [12]
4.3. Long period gratings
133
Figure 4.31: Transmission spectrum of the He-ion implanted etched optical �ber [12]
coupled not only to the symmetric cladding modes but also to asymmetrical ones (as mentioned above), which resulted in high background losses, as could be seen in �gure 4.31. However, this losses could be removed by means of the use of a mask with narrow spacing, through which ions were implanted only in the core of the optical �ber. Furthermore, it was demonstrated that, with an amplitude mask of about 1
µm
pitch gratings, FBGs could be manufactured
with this technique [72].
Mechanical gratings The last non-photochemical technique regarding the LPG fabrication was developed in 2000 by Savin et al [13].
It concerned the characterization of
mechanically induced LPGs by pressing a plate with periodic grooves against a short length of �ber. Via the photoelastic e�ect, the pressure points between the �ber and the grooved plate induced a periodic modulation of the refractive index: this was the physical mechanism behind the RI increase. In fact, as shown in �gure 4.32, it was possible to induce a RI modulation mechanically by pressing the �ber between a periodically grooved plate and a �at plate. One of
4. Manufacturing of optical �ber gratings
134
Figure 4.32: Side view of a mechanically induced long period grating with period
Λ
[13]
the plates that the authors tested had V grooves with a depth of about 125
µm
and the �at-topped pro�le shown in �gure 4.32. An example of periodically grooved plate used to induce LPGs mechanically is shown in �gure 4.33. The test �ber was a Corning SMF-28 CPC �ber (8.3-µm core diameter, 125-µm cladding diameter and 0.11 numerical aperture). 580
µm)
The grating period (Λ
was selected in order to achieve a coupling near 1.55
µm,
=
which
occurred to a low-order cladding mode. The pressure was applied through a springloaded clamp. An advantageous feature of this design was that one could adjust the grating period, and thus the positions of the loss peaks, by changing the angle between the �ber and the grooves. Similarly, the length of �ber under pressure, which controlled the bandwidth of the loss peaks, could easily be changed. Moreover, one could tune the depth of the loss peaks by adjusting the pressure. When the perturbation was removed, the transmission spectrum of the �ber returned to its initial spectrum. Thus a wide range of �lter functions could be generated with the same grooved plate and �ber. The authors had found through experimentations that, if the �ber under pressure was unjacketed, the loss peaks are broad and overlap, and the out-of-band losses increased. Far lower losses and cleaner spectrum were obtained when the �ber remained jacketed. The reason for the lower losses given by the same authors was that the jacket reduced the �ber microbending. This approach was also preferable
4.3. Long period gratings
135
Figure 4.33: An example of periodically grooved plate used to induce LPGs mechanically
because it did not compromised the �ber integrity. By the way, to reduce the out-of-band losses, the authors demonstrated that it was enough to place the �ber under a slight tension before it was clamped. In addition, it is clear that using this method, the index modulation was created in both the �ber core and cladding. As explained previously, this meant that the coupling occurred to asymmetric cladding modes too. Figure 4.34 illustrates the e�ect of increasing pressure on the transmission spectrum of the �ber regarding a LPG recorded with a period of 712
µm.
Higher pressures resulted in stronger mode coupling and thus generally
in deeper loss peaks.
If the pressure was increased beyond a certain point,
however, one expected the depth of the loss peaks to begin to decrease. This behavior was supported, over certain ranges of grating length and coupling constant, by the expression of LPG transmission
T
given in equations (3.76)
and (3.78), as also con�rmed from �gure 4.34. In fact, when the pressure was increased from p4 to p5 , the attenuation of the loss peak on the left decreased, whereas that of on the right, which had not reached its maximum coupling
136
4. Manufacturing of optical �ber gratings
Figure 4.34: Transmission spectra of a grating with period
Λ =
712
µm
measured for an applied pressure increasing from p1 to p5 [13]
strength condition (see equation (3.79)), continued to increase. Finally, this technique o�ers the unique advantages of being tunable, erasable and recon�gurable together with the simplicity and low costs. But it has a great drawback: the grating does not remain permanently imprinted on the �ber, namely, the grating vanishes when the grooved plate is removed. This is the main reason why the mechanical gratings can not be used for developing a real sensor (we should also take into account the thermal expansion of the plates) and hence may be useful for educational purposes only.
After the roundup of the manufacturing techniques about long period gratings, as already done in the case of FBGs, it is worthy of highlighting the main di�erences between the photochemical methods and the non-photochemical
4.3. Long period gratings
137
methods. The photochemical methods are characterized by:
the physical principle of the grating writing is based on the photochemical approach, namely, the maximum of the absorption band of �ber defects;
the grating is written only into the �ber core, which means that the coupling occurs between the fundamental guided core mode and symmetric cladding modes, or rather cladding modes with azimuthal symmetry;
the grating can be written on photosensitive optical �bers (ie Ge-doped, B-Ge co-doped, etc) or on standard optical �bers after a special treatment that makes the �bers photosensitive to UV radiation (ie SMF-28 after hydrogen loading treatment);
the manufacturing apparatus plans to use an expensive laser equipment and a di�cult fabrication setup, as general rule;
while the non-photochemical methods by:
the physical principle of the grating writing is based on the physical and/or structural deformation of the �ber;
the grating is also written into the �ber cladding, which means that the coupling occurs between the fundamental guided core mode and antisymmetric cladding modes, or rather cladding modes that do not have azimuthal symmetry;
the grating can be written on both photosensitive optical �bers and non-photosensitive optical �bers without any prior- and post-fabrication process, such as hydrogen loading (prior) and thermal annealing (post);
the manufacturing apparatus plans to use a little expensive and much simpler equipment, without the use of a laser source at times;
the manufactured gratings are very sensitive to �ber bending and have a high thermal stability.
Chapter 5
Optical �ber gratings for physical and biochemical sensing Things should be made as simple as possible, but not any simpler. Albert Einstein
5.1 Theory of optical �ber gratings for physical sensing ptical �ber sensor technology based on optical �ber gratings has been
O
used in a number of important and attractive application �elds, which
range from the structural monitoring to chemical/biochemical sensing [3, 127]. Practical and cost e�ective systems are now available in the market due to the recent advances in grating manufacture and sensor readout instrumentation. Any change in �ber properties, such as axial strain, temperature or surrounding refractive index, which induces a change in the e�ective refractive
e�
index of the �ber core (ncore ) and/or the �ber cladding (n
e� clad (p) )
and/or in
the grating period (Λ), will change, in turn, the resonance wavelength.
An
OFG is an intrinsic sensor which changes the transmission spectrum (or alike the re�ection spectrum) of an incident light signal by coupling energy to other �ber modes. As widely discussed in previous sections, in the case of FBGs, the incident wave is coupled to the same counter-propagating core mode and thus it is re�ected back (the simplest case); on the other hand, in the case of LPGs, the incident wave is coupled to distinct forward-propagating cladding modes and thus it is transmitted ahead. The main drawback of using OFGs as sensor element is that both types of grating are sensitive at the same time to all the external perturbations.
5. Optical �ber gratings for physical and biochemical sensing
140
Thus, if one has in mind to develop a real selective sensor using OFGs, it has to remember that the measurement has to be �puri�ed� from the interferent measurands in order to obtain the e�ect of the measurand of interest. Therefore, a number of di�erent techniques have been proposed in the past in order to get rid of the �uctuations coming from these interferent measurands [14, 44]. In the case of LPGs, for example, the multiple bands of a LPG can be used to e�ectively separate two distinct e�ects acting simultaneously on the grating [44]. One of the most used technique recurs to the use of two in-line gratings, a LPG followed by a FBG. This type of hybrid grating con�guration is that we were used.
A detailed description will be given in the
part II. It is worthy of highlighting that the combination of the use of optical �bers with the fact that the signal modulation is spectrally encoded o�ers multiplexing and remote measurement capabilities, which the other technology platforms are not able to or can hardly o�er [17].
It is very important to
stress that, because the optical modulation of the light signal is a wavelength modulation, this implies that the readout is not a�ected by changes of the optical power caused by either �ber bending or source �uctuations. Therefore, all the shifts of the resonance wavelength in the �ber spectrum, seen as a narrowband re�ection in the case of FBGs or loss peak in transmission in the case of LPGs, are independent of the optical intensity and uniquely associated with each grating. With care in selection of the resonance wavelengths, each sensor based on OFGs only registers a measurand change along its length. The sensitivity of the OFGs properties to perturbations of the optical �ber caused by the surrounding environmental conditions has led to an extensive study of their use as �ber sensor elements. In subsections 5.1.1 and 5.1.2, a detailed discussion about the sensing principles of FBGs and LPGs, respectively, in physical �eld applications is reported.
5.1.1 Fiber Bragg gratings FBG sensors have been reported for the measurements of strain, temperature, pressure, dynamic magnetic �eld [3].
The physical mechanism relies
upon the shift of the FBG resonance wavelength induced by a change of these parameters. The FBG sensitivity is governed by the �ber elastic, photoelastic
5.1. Theory of optical �ber gratings for physical sensing
141
and thermo-optic properties of the used optical �ber and by the nature of the load or axial strain, which is applied to the structure that the �ber is attached to or embedded within. The sensitivity to a particular measurand is similar to that of the �ber interferometric con�gurations [1]. In fact, the fractional change in phase of an interferometer is the same as the fractional wavelength shift in FBG resonance wavelength. However, in the case of a �ber interferometric con�guration, an optical leverage is realized because of the large phase path associated with a long length of �ber. This multiplier in the measurement resolution can be regained in the case of a FBG sensor, but not without some additional complication in the wavelength demodulation technique. The most studied and full-grown optical �ber sensor technologies based on FBGs are undoubtedly those that concern the strain and temperature sensors. The sensing principle about the strain sensor based on FBGs will be discussed in subsection 5.1.1, while the sensing principle about the temperature sensor based on FBGs will be discussed in the subsection 5.1.1.
Strain sensor By di�erentiating the Bragg resonance wavelength with respect to the applied axial strain expression:
�,
λFBG res
in equation (2.7)
it can be obtained the following
� � e� d λFBG res = 2 Λ d ncore + ne� d Λ core d � d� d�
(5.1)
d ne� core takes into account the e�ect of material dispersion of d� dΛ the �ber core, whereas the term d � takes into account the e�ect of change in where the term
grating periodicity due to an applied axial strain over the �ber. By considering a limited range of applied axial strain (up to about 3 m�), equation (5.1) can be linearly rewritten as follows:
FBG ∆ λFBG res = λres (1 − ρα ) ∆ � = S�FBG ∆ � where the term
∆ λFBG res
is the shift of the Bragg resonance wavelength,
the photoelastic coe�cient of the �ber, strain over the �ber, while the term
(5.2)
ρα
is
∆ � is the variation of the applied axial
S FBG �
represents the linear coe�cient of
5. Optical �ber gratings for physical and biochemical sensing
142
the strain sensitivity about the FBG. Writing equation (5.2), we have assumed an isotropic and homogeneous strain [1].
Moreover, equation (5.2) can be
simpli�ed to its more common form given by:
∆ λFBG res = (1 − ρ ) ∆ � ∼ 0.78 ∆ � = α λFBG res For the sake of completeness, the photoelastic coe�cient of the �ber
(5.3)
ρα
can
be expressed by means of the following equation:
ne� ρα = core 2 where the term
$
�2 h i ρ12 − $ (ρ11 + ρ12 )
is the Poisson ratio and
ρij
(5.4)
are the Pockel's coe�cients of
the �ber. Typical values for the FBGs sensitivity to an applied axial strain are gathered in table 5.1 [3].
It was proved that the strain response is linear with
Table 5.1: Comparison between the experimental data on FBG strain sensitivity at di�erent wavelengths.
Resonance wavelength
λFBG res (nm) 820
Strain sensitivity
S�FBG −1 ) (pm µ� 0.64
1300
1
1550
1.2
no evidence of hysteresis at temperatures as high as 370 [1]. It is worthy of noticing that the value of the strain sensitivity coe�cient of FBGs
S�FBG
depends on the value of both the FBG resonance wavelength and the photoelastic coe�cient of the used optical �ber. The latter depends, in turn, on the material structure of the �ber itself. Anyway, the slope of the strain response of a FBG will be always positive because the same counter-propagating core mode is coupled.
5.1. Theory of optical �ber gratings for physical sensing
143
Figure 5.1: Typical FBG characterization in axial strain of a standard Corning SMF-28 optical �ber
An example of the typical FBG characterization in strain sensitivity is shown in �gure 5.1.
The used �ber is a standard Corning SMF-28 optical
�ber. The circles in the �gure represent the experimental points at di�erent values of applied axial strain, which induce a shift of the FBG resonance wavelength at longer wavelengths. As it can be observed from the �gure, the best �tting curve of the experimental points is a linear trend characterized by a slope value of about 1 pm
µ�−1 ,
which represents the value of the FBG
strain sensitivity coe�cient.
Temperature sensor Starting from the di�erentiation of the Bragg resonance wavelength in equation (2.7) with respect to the temperature following expression:
T,
λFBG res
it can be obtained the
5. Optical �ber gratings for physical and biochemical sensing
144
� � e� d λFBG res = 2 Λ d ncore + ne� d Λ core d T dT dT
(5.5)
d ne� core takes into account the e�ect of material dispersion of dT dΛ the �ber core, whereas the term d T takes into account the e�ect of change where the term
in grating periodicity due to a temperature variation along the �ber.
The
�rst term in equation (5.5) is better known in the literature as thermo-optic coe�cient of the �ber core, whereas the second term as thermal expansion coe�cient of the �ber. By considering a limited range of temperature (from 10 to about 150 ), equation (5.5) can be linearly rewritten as follows:
FBG ∆ λFBG res = λres (α + ξ) ∆ T = STFBG ∆ T where the term
α
∆ λFBG res
is still the shift of the Bragg resonance wavelength,
is the thermal expansion coe�cient of the �ber,
e�cient of the �ber core, �ber, while the term
(5.6)
STFBG
∆T
ξ
is the thermo-optic co-
is the variation of the temperature along the
represents the linear coe�cient of the temperature
sensitivity about the FBG. It was proved [1] that the temperature sensitivity of a bare optical �ber is primarily due to the thermo-optic e�ect. Therefore, equation (5.6) can be simpli�ed to the following form given by:
∆ λFBG res = (α + ξ) ∆ T ∼ 6.7 × 10⁻⁶ ∆ T = λFBG res
(5.7)
Typical values for the FBGs sensitivity to a temperature variation up to 85
are gathered in table 5.2 [3].
It was proved that the temperature
response is linear with no evidence of hysteresis, as occurs in the case of the above-described strain response. It is worthy of noticing that the value of the temperature sensitivity coe�cient of FBGs
STFBG
depends on the value of the
FBG resonance wavelength and as well as on the value of both the thermal expansion and thermo-optic coe�cients of the used optical �ber. The latter two depend, in turn, on the material composition of the �ber itself. Anyway, the slope of the temperature response of a FBG will be always positive because the same counter-propagating core mode is coupled, as occurs in the case of strain response.
5.1. Theory of optical �ber gratings for physical sensing
145
Table 5.2: Comparison between the experimental data on FBG temperature sensitivity at di�erent wavelengths.
Resonance wavelength
λFBG res (nm) 820
Temperature sensitivity
STFBG −1 ) (pm 6.8
1300
10
1550
13
A typical value for the temperature sensitivity coe�cient of FBGs at 1550 nm is 0.01 nm
−1 .
At temperatures higher than 150 , the sensitivity in-
creases and the response becomes slightly nonlinear [1]. If the �ber is jacketed or embedded in another substance then the sensitivity changes due to the thermo-optic e�ect of the substance itself. In fact, this allows one to eliminate or, in any case, to greatly reduce the temperature sensitivity of the grating by means of the proper choice of the surrounding material.
This is clearly
desirable in special applications, such as if the grating has to be used as a �lter or for wavelength control and stabilization of a semiconductor laser. An example of the typical FBG characterization in temperature sensitivity is shown in �gure 5.2. The used �ber is still a standard Corning SMF-28 optical �ber. The circles in the �gure represent the experimental points at di�erent values of applied temperature, which induce a shift of the FBG resonance wavelength at longer wavelengths. As it can be observed from the �gure, the best �tting curve of the experimental points is still a linear trend characterized by a slope value of about 10 pm
−1 ,
which represents the value of the FBG
temperature sensitivity coe�cient. Fiber Bragg gratings are also sensitive to changes in both the pressure and dynamic magnetic �eld.
Both of sensor �elds will not be discussed in
this thesis because it goes out the aim of the work, even if the use of FBG as pressure sensor has been reported in the past literature. In fact, a FBG sensor is also used to measure pressure changes and to detect acoustic signals. However, the sensitivity is far less because the glass �ber is very sti�. Some
5. Optical �ber gratings for physical and biochemical sensing
146
Figure 5.2: Typical FBG characterization in temperature of a standard Corning SMF-28 optical �ber
enhancements are possible by using a thick, low bulk modulus jacket, but the intrinsic response is still quite small. It was demonstrated that large changes in pressure are detectable with simple readout systems, but however complicated interferometric systems are required to use the FBG device to detect sound �elds and other low-level transverse strains. However, a clear description of FBGs used as both pressure and dynamic magnetic �eld sensor is reported in references [1, 3].
5.1.2 Long period gratings pGs are characterized by mode coupling between the propagating core
L
mode and co-propagating cladding modes, which gives rise to a series of
loss peaks, or rather attenuation bands in the �ber transmission spectrum centered at the wavelengths (resonances) that verify the phase-matching con-
5.1. Theory of optical �ber gratings for physical sensing
147
dition of each coupled cladding mode. The exact shape of the spectrum and the resonance wavelengths of the attenuation bands are sensitive to the grating period
Λ,
L
to the grating length
the temperature
T,
axial strain
�,
�ber bending
of the medium surrounding the �ber eters modify the period of the LPG and cladding modes
e� ne� core − nclad (p)
and to the local environment, such as
nsur [16]. Λ and/or
R
and the refractive index
Any changes in these paramthe di�erential RI of the core
according to the LPG characteristic equa-
tion (2.9). This modi�es the PMCs for coupling to the cladding modes and causes a change in the resonance wavelengths of the attenuation bands, which can be measured by means of an optical spectrum analyzer. In next subsections, it will be shown as the sensitivity to a particular measurand is dependent upon the material composition of the used optical �ber and upon the order
p
of the cladding mode to which the guided optical power is coupled. Moreover, it will also be discussed as the sensitivity to a particular measurand is thus di�erent for each cladding mode and hence for each attenuation band.
All
these reasons make LPGs particularly attractive for sensor applications, with the prospect of using for both single-parameter sensing and multi-parameter sensing by means of a single sensor element [14]. As above-mentioned, LPGs are also sensitive to the bending of the optical �ber. This sensitivity characteristic of LPGs will not be taken into account in this work because the �ber bending can be avoided by �xing the portion of the �ber where the grating (or more than one) has been previously written. By the way, this sensitivity characteristic of LPGs has been widely studied in the past not only for sensing purposes, but also in the case of non-UV manufacturing techniques of LPGs, especially in the case of LPGs fabricated by means of electric arc (see subsection 4.3.2). In fact, it has been mentioned that a great sensitivity to �ber bending can be achieved for LPGs manufactured by means of non-UV methods due to the coupling to antisymmetric cladding modes [11]. In the �rst subsection 5.1.2 of this section, it will be presented a general formulation for studying the sensitivity characteristics of LPGs, which is based on a general sensitivity factor (γ e) and speci�c sensitivity factors (Γ� ,
Γsri )
ΓT
and
for each of the three sensitivity parameters of interest. This attractive
and fascinating theory was developed in 2002 by Shu et al [92] and represents still now one of the most used way for describing the di�erent sensitivities of
5. Optical �ber gratings for physical and biochemical sensing
148
LPGs by means of general analytic expressions. As for FBGs, the �rst studied optical �ber sensor technologies based on LPGs are undoubtedly those that concern strain and temperature sensors. However, during the last decade especially, LPGs have been reported many times as surrounding refractive index (SRI) sensor.
In fact, it was demon-
strated that they showed great SRI sensitivity [27]. In subsection 5.1.2 the sensing principle about the strain sensor based on LPGs will be discussed, whereas in subsection 5.1.2 the sensing principle about the temperature sensor based on LPGs will be faced.
The last subsection 5.1.2 will provide a
comprehensive description about the LPGs response to changes in the refractive index of the medium surrounding the �ber.
The analysis will include
not only the case where the surrounding refractive index is lower than that of the �ber cladding, but also the one that is greater than the RI of the �ber cladding. This is because the developed optical �ber sensor is based on these three sensitivity characteristics of both FBG and LPG and, in particular, on the SRI sensitivity characteristic of LPG.
General sensitivity factor of LPGs One of the most interesting way to study the sensitivity characteristics of LPGs is unquestionably that was developed by Shu el al [92].
The authors
presented a detailed investigation into the LPGs sensitivity as a function of temperature, axial strain and surrounding refractive index (SRI), with particular attention to the higher order cladding modes. In fact, following a general theoretical analysis, they identi�ed a general sensitivity factor together with a set of measurand-speci�c sensitivity factors, which o�ered a new physical insight into LPGs behavior and turned out to be a useful design tool. Moreover, they demonstrated that some higher order cladding mode showed greater sensitivity than all the others, because of the existence of turn around points (TAPs) in the mode dispersion characteristics (see �gures 3.9, 3.10, 3.11) at which ultrasensitive operation can be achieved.
This subsection provides a
brief description of the present method. As done above in the case of FBGs, starting from the LPG characteristic equation (2.9), it is possible to derive the analytic expressions for the strain sensitivity
d λLPG res (p) /d �,
the temperature sensitivity
d λLPG res (p) /d T
and SRI
5.1. Theory of optical �ber gratings for physical sensing sensitivity
d λLPG res (p) /d nsur
of the resonance wavelength as
d λLPG res (p) d� d λLPG res (p) dT
� � γ e α + Γ = λLPG � res (p)
(5.8)
� � e 1 + ΓT = λLPG res (p) γ
(5.9)
d λLPG res (p) d nsur where
α
149
e Γsri = λLPG res (p) γ
(5.10)
is still the thermal expansion coe�cient of the optical �ber,
γ e
is the
general sensitivity factor, which describes the waveguide dispersion, and is de�ned by the following expression [91]:
d λLPG res (p) γ e = e� d Λe� ncore − nclad (p) The terms
Γ� , ΓT
and
Γsri
(5.11)
are the measurand-speci�c sensitivity factors, which
describe the axial strain, temperature and surrounding RI dependences, respectively, of the waveguide dispersion and are de�ned by the following expressions [92]:
Γ� =
e� ρα,core ne� core − ρα,clad nclad (p)
(5.12)
e� ne� core − nclad (p)
ΓT =
e� ξcore ne� core − ξclad nclad (p)
(5.13)
e� ne� core − nclad (p)
� �3 u2p nsur λLPG res (p) Γsri = − � �� �3/2 e� 2 2 8 π a3clad nclad ne� − n n − n core sur clad clad (p) where
ρα,core , ρα,clad
and
ξcore , ξclad
are the photoelastic and thermo-optic
aclad zero−th
coe�cients of the core and cladding materials, respectively, of the �ber cladding and
up
is the
(5.14)
p−th
root of the
is the radius order Bessel
5. Optical �ber gratings for physical and biochemical sensing
150
function of the �rst kind
J0 (up ) = 0
J0 ,
that is to say, the values at which the condition
is satis�ed.
It is worthy of observing that the factor
γ e
is related to the LPGs sensi-
tivity to all the types of external perturbation including temperature, strain and surrounding refractive index. Thus the term
γ e
was rightly known as the
general sensitivity factor. Furthermore, broadly speaking, each sensitivity to a particular measurand for both the gratings can be divided into two di�erent contributions:
the former is known as material dispersion, while the latter
is known as waveguide dispersion which takes also into account the phasematching curve of the �ber
d λLPG res (p) /d Λ.
The next step consists of calculating the relationship between
Λ
λLPG res (p)
and
for all the cladding modes, namely, the phase-matching curve of the used
optical �ber. An example is shown in �gures 3.9, 3.10, 3.11. Having said that, the general sensitivity factor
γ e=
γ e
can also be expressed as
e� ne� ∆ ne� core − nclad (p) = ∆ ng ngcore − ngclad (p)
(5.15)
∆ne� is the di�erence in e�ective refractive index between the core mode g the p−th cladding mode, whereas ∆ n is the corresponding di�erence in
where and
group refractive index. By de�ning the group RI of the core mode as
LPG ngcore = ne� core − λres (p) whereas the group RI of the
p−th
d ne� core d λLPG res (p)
λLPG res (p) . (from
∆ ng
d ne� clad (p)
1 to
p=
d λLPG res (p)
! (5.17)
as a function of the resonance wavelength
Figure 5.3 shows the plots of
p=
(5.16)
cladding mode as
LPG ngclad (p) = ne� clad (p) − λres (p) it is possible to plot the curve
!
∆ ng
for the �rst 30 cladding modes
59). From the �gure 5.3, it can be observed that, in the
∆ng is always positive always negative for the p =
considered wavelength range (from 800 nm to 2000 nm),
p=1 p = 59
p=
for the
to
13 cladding modes, and is
45 to
cladding modes. This is in agreement with the corresponding
5.1. Theory of optical �ber gratings for physical sensing
151
Figure 5.3: Di�erence in group RI between the fundamental core mode and
p =
each of the �rst 30 cladding modes (from
1 to
p =
59, only a few are
numbered) as a function of LPG resonance wavelength, calculated for BGe
∆ng = 0 |e γ| > 5
co-doped optical �ber. The intersection points of the curves with the axis correspond to the turn around points. In the shaded region,
signs of the slopes of the phase-matching curves shown in �gures 3.9, 3.10, 3.11. Because
∆ ne�
is always positive, the sign of the sensitivity factor
determined by that of the
∆ ng = 0
∆ ng
∆ ng .
The regions of
is
γ e > 0 and γ e < 0, above and below
line, are depicted in �gure 5.3 as well. The intersections of the
curves for each cladding mode with the
where
γ e
|e γ| → ∞
∆ ng = 0
line de�ne the points
and hence correspond to the turn around points depicted as
circles in �gures 3.9, 3.10, 3.11. The shaded area shown in �gure 5.3 represents the high sensitivity region in which
|e γ | > 5.
Looking at equations (5.12), (5.13) and (5.14), it is clear that greater is the value of the sensitivity factor
γ e
and greater is the value of the sensitivity
to the measurand of interest. Shu et al [92] showed that the greatest values of the sensitivity factor was achieved for the
p=
19 to
p=
25 cladding modes
(shaded area in �gure 5.3) at di�erent wavelengths ranging from 1450 nm
5. Optical �ber gratings for physical and biochemical sensing
152
to 1650 nm.
Moreover, equations (5.12) to (5.14) allow us to separate the
sensitivity of a LPG to any measurand of interest into a general factor (γ e) and a measurand-speci�c factor (Γ) that re�ects the in�uence of the measurand on the dispersion of the LPG. The strain sensitivity factor
Γ�
is determined by the photoelastic coe�-
cients of the core and cladding materials and by the mode order proved [92] that the magnitude of with
ρα,clad
Γ�
p.
It was
decreases with increasing mode order,
held constant at a value of -0.22 for pure fused silica cladding.
dλLPG res (p) /d� is determined by Γ� > −1 sign of γ e. Finally, following this anal-
However, the sign of the strain sensitivity or
Γ� < −1
(see [92]), as well as by the
ysis, Shu et al demonstrated that, to produce strain-insensitive LPGs, the condition to be satis�ed was
Γ� = −1.
This is usually possible for only one
mode, which changes depending on the material composition of the optical �ber. The temperature sensitivity factor
ΓT
is determined by the thermo-optic
coe�cients of the core and cladding materials and by the mode order a given value of
ξcore
and by holding constant
for pure fused silica, the absolute value of order because
∆ ne�
observed that
ΓT
ΓT
ξclad
For
at a value of 7.8 x 10
−6
decreases with increasing mode
is larger for higher order cladding modes.
It was also
increases with increasing di�erence between the thermo-
optic coe�cients of the core and cladding materials. The sign of either positive or negative, as determined by
e� ξcore ne� core < ξclad nclad (p) . co-doped �bers,
p.
ΓT < 0,
ΓT
can be
e� ξcore ne� core > ξclad nclad (p)
For standard �bers,
ΓT > 0,
or
whereas for BGe
because boron doping decreases signi�cantly the
thermo-optic coe�cient of the core [92]. Thus, it was proved that the thermal responses of LPGs produced in these two di�erent optical �bers exhibit opposite trends. Broadly speaking, for pure fused silica optical �bers, with
α=
4.1 x 10
−7
−1 .
α 100 µm,
the
5. Optical �ber gratings for physical and biochemical sensing
156
material dispersion contribution is negative, whereas the waveguide dispersion contribution is positive.
For LPGs with grating periodicity
Λ < 100 µm,
both the contributions to the strain sensitivity are negative. In fact, a LPG with grating period of 40
µ�−1 [16].
µm
exhibited a larger strain sensitivity of -2.2 pm
Broadly speaking, appropriate choice of grating period and material
composition of the optical �ber will thus allow the generation of attenuation bands with positive, negative or zero sensitivity to axial strain. Besides the magnitude and the slope of LPG attenuation bands may be di�erent if a BGe co-doped optical �bers were used due to a di�erent material dispersion contribution of the �ber core.
Temperature sensor The origin of the temperature sensitivity may be understood by di�erentiating the LPG resonance wavelength to the temperature
d λLPG res (p) dT where
L
λLPG res (p)
in equation (2.9) with respect
T:
d λLPG res (p) � = � d δ ne� (p)
d ne� d ne� clad (p) core − dT dT
!
d λLPG res (p) 1 d L + Λ dΛ L dT
(5.22)
is the grating length. The �rst term on the right-hand side of equa-
tion (5.22) is the material dispersion contribution and is related to the change in the di�erential ERI of the core and cladding. This is related, in turn, to the thermo-optic e�ect.
The material dispersion contribution is dependent
upon the composition of the optical �ber and is strongly dependent upon the order
p
of the coupled cladding mode.
Bhatia et al [128] showed that, for
coupling to low−order cladding modes (p
= 1, 3, ...19),
accessed using longer
grating periods (Λ
> 100 µm), the e�ect of the material dispersion dominates. For coupling to very−high−order cladding modes (p = 41, 43, ...59), accessed using shorter grating periods (Λ < 100 µm), the e�ect of the material dispersion for standard germanosilicate optical �bers can be negligible. The second term is the waveguide dispersion contribution as it results from changes in the grating period. This is related, in turn, to both the thermal expansion e�ect of the �ber and the local slope of the phase-matching curve
d λLPG res (p) /d Λ
for
a particular cladding mode. The magnitude and sign of the second term still
5.1. Theory of optical �ber gratings for physical sensing depend upon the order
p
157
of the coupled cladding mode.
Bhatia et al [128]
showed again that, for coupling to low−order cladding modes (p the local slope of the phase-matching curve the very−high−order cladding modes (p
d λLPG res (p) /d Λ
= 41, 43, ...59),
= 1, 3, ...19),
is positive, while for
this term is negative,
as can be seen from the graphs in �gures 3.9, 3.10 and 3.11. By considering again a limited range of temperature (from 20 to about 160 ), equation (5.22) can be linearly rewritten as follows:
LPG ∆ λLPG res (p) = ST (p) ∆ T where the term
∆ λLPG res (p)
(5.23)
is the shift of the LPG resonance wavelength of the
p−th coupled cladding mode, ∆T is the variation of the temperature along the LPG �ber and S T (p) represents the linear coe�cient of the temperature sensitivity about the LPG in which the guided core mode coupled to the p−th coupled cladding mode. Looking at equation (5.22), the shift of the resonance wavelength due to the material dispersion e�ect can have either polarity and its magnitude is a function of the di�erential change between the e�ective indices of the guided core and cladding modes. For LPGs with periodicity of magnitude of hundreds of micrometers, the material dispersion e�ect typically dominates the waveguide dispersion contribution to the temperature-induced shift. The strong dependence of the material dispersion e�ect on the order
p
of the coupled cladding
modes results in distinct shifts of each attenuation band of LPGs. Moreover, since the period of the grating
Λ
dictates the order
p
of the coupled cladding
mode, the temperature sensitivity of each attenuation band for a given optical �ber can vary considerably with the grating periodicity.
Figure 5.5 depicts
the shift of the resonance wavelength of four attenuation bands (from curve A to curve D) as a function of the temperature for the same LPG (Λ
µm)
=
280
used in strain characterization [14]. The depicted spectra correspond to
temperatures of 22.7, 49.1, 74.0, 100.9, 127.3 and 149.7. The distinct spectral displacement of the four bands is clearly visible. The shift of the attenuation band related to curve A (higher order cladding mode, 1608.6 nm at 31.2 ) is about 11.8 nm from 22.7 to 149.7 . A linear �t to the shift data of the resonance wavelength yields a slope of about 93 pm
−1
and that
is almost an order of magnitude higher than that observed in a �ber Bragg
158
5. Optical �ber gratings for physical and biochemical sensing
Figure 5.5: Shift in the resonance wavelengths of four attenuation bands, A−D, as a function of temperature for a LPG. The dashed line is the temperature-induced wavelength shift for a FBG fabricated at 1550 nm for comparison [14]
grating. For a complete comparison, �gure 5.5 shows also the temperatureinduced shift of the resonance wavelength for a FBG at 1550 nm (curve E), which is characterized by a linear �t of about 13 pm
−1 .
It is easy to ob-
serve that a FBG is less temperature sensitive than a LPG. Moreover, the non-linearity in the shift of the resonance wavelength for the LPG bands can be attributed primarily to the temperature dependence of the thermo-optic coe�cients of the core and the cladding. For this particular grating, the sen-
5.1. Theory of optical �ber gratings for physical sensing
159
sitivity to temperature increases with the order of the cladding mode due to the di�erent material dispersion contributions for distinct cladding modes. In general, LPGs fabricated in standard SMF-28 optical �bers exhibit temperature sensitivities ranging from 30 pm
−1
to 100 pm
−1
[14].
On the
contrary, LPGs fabricated in photosensitive optical �bers exhibit greater temperature sensitivities than that of fabricated in standard SMF-28 optical �bers (see part II). As an example, LPGs manufactured in photosensitive B-Ge codoped optical �bers have been shown to o�er sensitivities of up to 2.75 nm
−1
[129].
Thus, the LPG temperature sensitivity is at least an order of
magnitude larger than the FBG temperature sensitivity. For the sake of completeness, other techniques for enhancing the temperature sensitivity (ie 19 nm
−1 )
have been reported based upon surrounding
the optical �ber by a material of large thermo-optic coe�cient, resulting in the LPG responding to both the changes in temperature and the temperatureinduced RI change of the surrounding medium [15, 130]. Alternatively, recoating an optical �ber characterized by a negative thermal expansion coe�cient, with a material with a positive thermo-optic coe�cient has been shown to permit the temperature sensitivity to be reduced up to 0.7 pm
−1
[131].
It is worthy of highlighting that, by an appropriate choice of the grating period, it is possible to balance the two dispersion contributions to the temperature sensitivity in order to obtain both a temperature-insensitive attenuation band and also attenuation bands with temperature sensitivities (positive or negative) appropriate to speci�c applications. Moreover, by altering the material composition of the optical �ber, such that the thermo-optic coe�cient of the core is either large or smaller than that of the cladding, it allows us to obtain a required temperature sensitivity [97]. Therefore, the magnitude and the slope of LPG attenuation bands may be di�erent if a B-Ge co-doped optical �bers were used due to both a di�erent material dispersion contribution of the �ber core and a di�erent thermal expansion e�ect of the �ber itself.
Surrounding refractive index sensor As discussed previously, it is worthy of remembering that the sensitivity of LPGs to environmental parameters is in�uenced by the period of the grating
Λ,
by the order
p
of the cladding mode to which the coupling takes place and
5. Optical �ber gratings for physical and biochemical sensing
160
by the material composition of the optical �ber.
Having said that, the last
found sensitivity characteristic of LPGs, which is also the most interesting one because of the many applications developed in di�erent �eld later (see section 5.2), is their sensitivity to the refractive index of the medium surrounding the �ber cladding (nsur ) in the grating region. This arises from the dependence of the resonance wavelengths of each attenuation band on the effective refractive index (ERI) of the cladding modes, which depends, in turn, on the refractive index (RI) of the medium surrounding the �ber cladding (see equation (3.61)) [27].
This is the physical principle that allows us to
use LPGs as RI sensors based on the change in resonance wavelength and/or transmission of the LPG loss peaks. By considering the LPG characteristic equation (3.61) and by assuming that both the grating period
ne� core nsur ,
Λ
and the e�ective RI of the guided core mode
remain unchanged under the e�ect of a change in the surrounding RI the in�uence of variation in the surrounding refractive index around the
�ber cladding of a LPG can be mathematically expressed by means of the following nonlinear function
f (nsur )
[14, 26, 42]:
� � e� d n λ, n , n d λLPG sur clad clad (p) res (p) � � f (nsur ) = = d nsur d nsur e� d nclad (p) λ, nclad , nsur d λLPG res (p)
where
ne� clad (p)
(5.24) is the e�ective RI of the
depends on the working wavelength on the cladding RI
nclad
cladding mode, which in turn
(material and waveguide dispersion),
and, as mentioned above, on the RI of the medium
surrounding the �ber cladding
d ne� clad (p) /d nsur
λ
p−th
nsur .
It is worthy of noticing that the term
is di�erent for each cladding
p−mode
and hence the spectral
response of a long period grating depends strongly on the order
p of the coupled
cladding mode. It is important to observe that the shift in the LPG resonance wavelength may be positive or negative for a given optical �ber and cladding mode, depending on the local slope of the characteristic phase-matching curve
d λLPG res (p) /d Λ
[14].
Everything has just been said can be observed in �gure 5.6. In fact, �gure 5.6 shows the shifts of the resonance wavelength in four attenuation bands for a long period grating written in a standard Corning SMF-28 optical �ber
5.1. Theory of optical �ber gratings for physical sensing
161
Figure 5.6: Experimental shift of the resonance wavelength in four attenuation bands (from curve A to curve D) of a long period grating as a function of the surrounding refractive index [14]
and characterized by a grating period of 320
µm.
The �lled black points are
the experimental data related to four di�erent attenuation bands and hence to four di�erent cladding modes. The values of the resonance wavelength of each cladding mode are 1496.6 nm (curve A), 1329.3 nm (curve B), 1243.8 nm (curve C) and 1192.1 nm (curve D), respectively. These values were measured by placing the optical �ber in air, namely, when
nsur =
1 RIU. The shifts of
each resonance wavelength were also measured with respect to the locations at
nsur =
1 RIU (air). Looking at �gure 5.6 it is clear that, for this particular
grating, the shift of the resonance wavelength is negative for all bands and increases with the order of the coupled cladding mode from curve D (lower
5. Optical �ber gratings for physical and biochemical sensing
162
order cladding mode) to curve A (higher order cladding mode). It is worthy of highlighting that the largest shifts of the resonance wavelength of about
−66.9
nm (curve A) were measured for the attenuation band related to the
higher order cladding mode, as expected from the literature [27]. Anyway, the sensitivity to changes in external RI can be enhanced or reduced by manipulating the parameters of the used optical �ber and by choosing the suitable grating period for coupling to speci�c cladding modes [14].
Patrick et al [27] found experimentally that the longest resonance wavelength, or equally the highest order attenuation bands were most sensitive to
nsur
λLPG res (p) cladding nclad .
and the largest variations of
refractive index of the �ber
were seen as
nsur
approached the
The shift of the resonance wave-
length occurs because increasing the surrounding RI increases the e�ective RI of the coupled cladding mode as well, particularly for the higher order cladding modes which extend further into the medium surrounding the �ber [17]. The sensitivity to surrounding refractive index manifests itself as a change in the value of both the resonance wavelength (see �gure 5.7(a)) and the minimum transmission (see �gure 5.7(b)) of the attenuation band related to the coupled cladding mode.
The �gure 5.7 shows the shift of the resonance wavelength
(a) and the minimum transmission value of the attenuation band (b) related to the same coupled cladding mode as a function of the refractive index of the medium surrounding the LPG. The LPG is characterized by a grating period of 400
µm
and is written in a B-Ge co-doped optical �ber with a cut-o�
wavelength of 650 nm [15].
As can be seen from the same �gure 5.7, when
the surrounding RI changes from
nsur =
1 RIU (air) to
nsur =
1.44 RIU,
this is a total internal re�ection (TIR) condition, which is best dealt with using the coupled mode theory based on a three-layer geometric model of the �ber [81, 86].
Therefore, the principal e�ect is a blueshift (shift to shorter
wavelengths) of the resonance wavelength of the attenuation band related to the coupled cladding mode, which is particularly pronounced in the longest attenuation bands, as discussed above (see �gure 5.6). In the same RI range, the minimum transmission value remains practically unchanged, or rather changes about a few dB. Between
nsur =
1.45 RIU and
nsur =
1.46 RIU, an abrupt
change in the spectral characteristics is observed, which is associated with the maximum RI sensitivity (the maximum slope of the curve in �gure 5.7(a)).
5.1. Theory of optical �ber gratings for physical sensing
163
Figure 5.7: Plot of the shift of the resonance wavelength (a) and the minimum transmission value of the related attenuation band (b) as a function of the refractive index of the medium surrounding a long period grating with a period 400
µm
written in a borongermanium co-doped optical �ber [15]
5. Optical �ber gratings for physical and biochemical sensing
164
Now, the cladding modes would be expected to no longer be discrete guided modes and, as seen, the attenuation bands in the transmission spectrum spread and the couplings nearly disappear. In fact, when
nsur = nclad ,
the cladding
appears to be of in�nite extent and thus supports no discrete modes.
This
means that the cladding modes are converted to radiation modes [132].
A
few dB of broadband radiation-mode coupling losses are then observed, but no distinct attenuation bands. In this RI range, the observed changes in the minimum transmission value are due to the expansion of the cladding modes as the guiding of the optical �ber decreases, decreasing the coupling coe�cients between the core mode and cladding modes until the guiding around
nsur =
1.46 RIU is almost nonexistent (attenuation bands nearly disappear).
Finally, for
nsur > 1.46 RIU or rather when the surrounding refractive index is
higher than that of the cladding, the resonance wavelengths of the attenuation bands show a considerably reduced sensitivity (a minimum slope of the curve in �gure 5.7(a)) [27, 41], but a change in the form of the transmission spectrum is observed, namely, the extinction of the attenuation bands is reduced. The reappearance of discrete attenuation bands was explained by means of the socalled
leaky modes , which exist in waveguides with an inverted RI pro�le.
In
fact, as the surrounding RI increases this leaky modes are better con�ned, increasing both the coupling coe�cients between the core mode and these leaky modes and the minimum transmission value [100]. From a physical point of view, the presence of attenuation bands in this situation, where the cladding is no longer acting as a guiding element, is related to the existence of attenuated cladding modes (ie leaky modes) arising from Fresnel re�ection, rather than the total internal re�ection at the cladding/surrounding interface [16].
For the sake of clarify, the last case, or rather when
nsur > nclad ,
was
comprehensively discussed by Hou et al [133]. The authors bore out that the analysis of SRI sensitivity of LPGs must be e�ectively performed by means
nsur < nclad , as widely explained in chapter 3. case where nsur > nclad , the authors showed that
of a three-layer model while On the other hand, for the
the two-layer model was used to calculate the cladding modes, which provided reasonably accurate values. In fact, the two-layer model basically treats the �ber cladding and core as one multimode optical �ber and the surrounding environment as the new cladding only in the grating region of LPG. In this
5.2. Applications of optical �ber gratings for physical sensing
165
case, the cladding modes no longer experienced the TIR condition and were referred to as leaky modes.
Thus, the problem has to be treated as a two-
layer model in order to accurately calculate the cladding modes.
Anyway,
looking at �gure 5.7(a), the resonance wavelength experiences a measurable shift of a few nm, which suggested that LPGs coated with a material of higher refractive index than that of the �ber cladding may be used as refractive index sensors [133]. The use of coated OFGs will be discussed in section 5.3. The refractive index sensitivity of LPGs has been extensively studied in the literature to develop refractive index sensors, such as chemical concentration sensors [28, 29, 50], liquid level sensor [134].
More recently, LPGs have
been proposed as a new technological platform in the �eld of biochemical sensing [40, 65]. To use LPGs as biosensors, LPGs have to be coated with selective layers and hence the analysis given in this section must be reviewed. This will be discussed in section 5.3. On the contrary, LPGs have also been fabricated in optical �bers with complex structures in order to desensitize the LPG spectrum to the surrounding refractive index. As an example, LPGs fabricated in dual shaped core (DSC) dispersion-shifted optical �ber exhibited an attenuation band that was insensitive to external refractive index and to mechanical damage of the �ber surface [135]. The DSC �bers contain an inner cladding region that has a higher refractive index than the outer cladding layer. The refractive-index-insensitive attenuation band was believed by the authors to correspond to coupling to a mode of this inner cladding.
5.2 Applications of optical �ber gratings for physical sensing ptical �ber gratings can o�er some advantages compared with the use
O
of other technology platforms thanks to the typical properties of optical
�bers such as compactness and light weight and, from a technological point of view, the fact that they are highly compatible with optoelectronic components/devices used for standard and photosensitive optical �bers, since the working wavelengths generally correspond to the telecommunication windows around 1300 nm and 1500 nm. Moreover, the literature about FBGs showed that they can be also used to study the dispersive phenomena, in particular
5. Optical �ber gratings for physical and biochemical sensing
166
for applications such as dispersion compensation, pulse shaping and for all the other applications which make use of �ber and semiconductor laser components [76, 136].
In the case of LPGs, the dispersion is more of a concern
mainly because these have a broader bandwidths than FBGs even in absence of dispersion [76], but other interesting applications about LPGs can be found in this reference [136]. Broadly speaking, FBGs and LPGs are used in both the �eld of telecommunications and the �eld of sensors. Some examples using FBGs and LPGs are presented in subsection 5.2.1 and 5.2.2, respectively.
5.2.1 Fiber Bragg gratings FBGs have �rstly be used in the �eld of telecommunications and later in the �eld of sensors. An excellent overview can be found in [1]. In fact, Hill and Meltz gathered in two tables of all the FBG applications. The �rst table collected the most interesting applications of FBGs in the telecommunications area, whereas the second table in the area of �other� applications. The �rst application in the �eld of telecommunications was found by Hill et al [137] and regards the use of FBGs as optical �lters. Due to the spectral characteristics of FBGs, they were used as narrow-bandwidth optical waveguide transmission �lters.
Another typical telecommunications application regards their use as
optical add/drop multiplexer [138].
Figure 5.8 depicts the mechanism of
Figure 5.8: Schematic of an optical add/drop multiplexer based on a �ber Bragg grating an optical add/drop multiplexer based on a �ber Bragg grating. The optical
5.2. Applications of optical �ber gratings for physical sensing
167
add/drop multiplexer expression refers to the speci�c characteristics of the multiplexing about the SDH/SONET network, which allow one to draw or enter directly a single data �ow without having to demultiplexing the entire aggregate �ow. In fact, looking at �gure 5.8, the selected (added or dropped) data �ow (red) is that is characterized by the same wavelength than that of the schematized FBG. Another classical application regards the use of FBGS as wavelength selective devices. An example is their use as wavelength division multiplexing [139]. Figure 5.9 depicts the mechanism of an optical wavelength
Figure 5.9: Schematic of an optical wavelength division multiplexing system based on a �ber Bragg grating
division multiplexing system based on a �ber Bragg grating. Within an optical �ber network, the FBG can be used as a system to multiplex the data in transmission and to demultiplex the data in reception based on a division in wavelength.
One of the most interesting application about the FBGs in
the �eld of telecommunications was undoubtedly that regards their use as dispersion compensation [140, 141, 141].
Figure 5.10 depicts the mechanism
of an optical dispersion compensation system based on a chirped �ber Bragg grating (see �gure 4.3). The e�ect of dispersion in optical �bers belongs two
168
5. Optical �ber gratings for physical and biochemical sensing
distinct temporal signal to each other. Therefore, the use of a chirped FBG allows the two signal to place at a certain distance. From a spectral point of view, there is obviously a spread of the FBG re�ection spectrum. In fact, the
Figure 5.10: Schematic of an optical dispersion compensation system based on a chirped �ber Bragg grating
change in the grating period means that di�erent wavelengths are re�ected in di�erent places and at di�erent times. In this way the e�ect of dispersion due to the optical �ber can be strongly reduced. Other applications concern their use together with �ber and semiconductor laser components, for example as pulse shaping [136] and also as cascaded Raman ampli�cation at 1.3
µm [142].
Among the above-mentioned area of �other� applications, Hill and Meltz [1] talk about the use of FBGs as optical �ber mode converters [143], for studying the nonlinear e�ects [82] and, �nally, as grating-based sensors.
Optical �ber sensor technology based on �ber Bragg gratings has uses in a number of important application areas, ranging from structural monitoring to chemical sensing [127]. As discussed widely, any change in �ber properties, such as strain, temperature or polarization, which varies the e�ective RI of the core mode or the grating period, causes an almost linear shift of the Bragg resonance wavelength.
Moreover, the measurand information is wavelength
encoded, thus the sensor response is practically independent from the intensity modulations that can be pertained to the optical source or to the optcial �ber. These characteristics made FBGs excellent sensor elements. In addition, optical �ber sensors (OFSs) can o�er several advantages over the conventional
5.2. Applications of optical �ber gratings for physical sensing
169
sensors, such as resistance to chemical agents because the glass is an inert material, linear response over several orders of magnitude and very low signal
−1 ). In fact, the optoelectronics control unit can
attenuation (about 0.3 dB km
be placed several tens of km far from the measurement point. Many examples of applications can be found in the literature and hence a complete list and description is out of the aims of the present work, but the most important �elds of applications are summarized below:
structural health monitoring in civil engineering (strain, temperature and pressure sensors) [144];
cultural heritage (strain, temperature and pressure sensors) [145];
aerospace applications (strain, temperature and pressure sensors), such as the monitoring of new aerospace materials as reinforced carbon �ber composites [146];
marine applications (pressure sensor), such as the monitoring of structures but also as Bragg re�etors in distributed Bragg re�ector (DBR) laser for subsea acoustic sensing [147];
medical applications, such as the remote temperature monitoring in nuclear magnetic resonance (NMR) machines [148];
pipeline monitoring [149];
measurements on moving vehicles, such as aircrafts, trains, etc;
measurements on harsh environments, such as during nuclear fusion processes.
The list could have been very large, considering also that the FBGs can be applied to any kind of transducer, which changes its shape under the e�ect on a particular physical, chemical or biochemical measurand. Other interesting con�gurations are based on multiple in-line FBGs, which are able to be use in the �eld of multi-parameters sensing. The most used con�gurations are based on two FBGs written in series within the same optical �ber for simultaneous measurement of changes in axial strain and environmental temperature.
170
5. Optical �ber gratings for physical and biochemical sensing
5.2.2 Long period gratings As in the case of FBGs, even the LPGs were used in the �eld of telecommunications at the beginning. The two classical applications regard their use as band-rejection �lters [73] and as gain-�attening �lters for erbium doped �ber ampli�ers [5]. Because the spectrum of LPGs is characterized by a series of attenuation bands centered at discrete wavelengths, these bands can be used as optical wavelength-selective band-rejection �lters. The only drawback can be the not-too-small value of bandwidth of the attenuation bands, typically from 10 nm to 20 nm. Thus, these optical �lters may not be su�ciently selective. Moreover, considering both the nonuniform gain pro�le of the erbium doped �ber ampli�ers (solid curve in �gure 5.11) and the opposite trend of the attenuation bands of LPGs around the same wavelength range, Vengsarkar et al [5] wrote an LPG in series with an erbium doped �ber ampli�er.
The total
Figure 5.11: E�ect of gain-�attening (�lled circles) using LPGs on the gain of erbium doped �ber ampli�ers (solid curve) [5] e�ect is the �attening of the gain of the erbium doped �ber ampli�er (�lled
5.2. Applications of optical �ber gratings for physical sensing circles in �gure 5.11).
171
The wavelength division multiplexing channels of an
−1 ) can be accommodated within
optical �ber network (each operating at Gb s
the 1530−1560 nm band of an erbium doped �ber ampli�er. But the nonuniform gain pro�les of erbium doped �ber ampli�ers gave rise to uneven gains in the di�erent channels leading to unacceptable bit-error-rate performance. By writing an in-line LPG, this problem was avoided.
Later, the use of LPGs has been extended to the �eld of sensors as well. Other than just discussed in section 5.1.2, the refractive index sensitivity of LPGs has been exploited to form other types of physical sensor. LPGs have been proposed to form a �ow sensor to monitor the arrival of resin within a liquid composite molding system [150]. The measurement relies upon the reduction in the transmission value of the LPG attenuation band that occurs when the LPG is surrounded by a material of higher refractive index. Another interesting application reported in the literature concerns an LPG−based liquid level sensor [134].
The partial immersion of the LPG within a liquid (see
Figure 5.12: Principle of operation of the liquid level sensor based on an LPG: (a) schematic of the LPG and (b) transmission spectrum of the expected split in the LPG attenuation band [16]
�gure 5.12(a)) results in each attenuation band splitting into two. One of the
5. Optical �ber gratings for physical and biochemical sensing
172
splitted attenuation bands has a resonance wavelength corresponding to coupling to the cladding mode when the optical �ber is surrounded by air (band B in the transmission spectrum depicted in �gure 5.12(b)), while the other has a resonance wavelength corresponding to coupling to the same cladding mode, but when the optical �ber is surrounded by the liquid sample (band A in the transmission spectrum depicted in �gure 5.12(b)) characterized by a refractive index higher than the air. As expected from the theory of LPGs, the minimum transmission value of an LPG attenuation band is dependent on the length of the grating according to equation (3.78). So the relative depth of the splitted attenuation bands changes in response to a change in the liquid level.
The authors proved also that the proposed liquid level sensor has a
linear response over 60% of the grating length.
As already mentioned in section 5.1.2, the refractive index sensitivity has also been used to enhance or to reduce the temperature sensitivity of LPGs. Surrounding the LPG by a liquid with a large thermo-optic coe�cient results in the LPG responding to both changes in temperature and to the temperatureinduced RI change of the surrounding medium [15, 130, 131].
According to
the sign of both the thermo-optic coe�cient and the thermal expansion of the �ber (see equation (5.22)), the total e�ect can be an increase or a decrease in the temperature sensitivity of LPGs. For example, recoating an LPG with a UV-curable acrylate-based polymer of refractive index approximately equal to that of the �ber cladding and with a negative thermo-optic coe�cient, increased the sensitivity of the LPG fabricated in a conventional dispersionshifted optical �ber from 50 pm
−1
to 800 pm
−1
[15].
Using a liquid
crystal material and an air-clad optical �ber in which the air regions were �lled by the same material, it produces a temperature sensitivity of about 2.1 nm
−1
[130].
Moreover, ultra high sensitivity of up to 19 nm
over a limited temperature range of 1
,
−1 ,
has been obtained by surrounding
the optical �ber with a cargille oil of refractive index that was approximately equal to that of the �ber cladding [15]. The sensor has be designed to operate at a range of temperatures by choosing an oil whose thermo-optic coe�cient was such that, at the required operating temperature, the refractive index was approximately equal to that of the �ber cladding. On the contrary, for an LPG recoated with a material of positive thermo-optic coe�cient, a temperature
5.2. Applications of optical �ber gratings for physical sensing sensitivity as low as 0.7 pm
−1
173
was obtained [131].
As for the LPG refractive index sensitivity, it can be seen from �gure 5.7(a) that the RI sensitivity range of bare LPGs is limited from 1.4 RIU to the RI of the �ber cladding. speci�c.
Moreover, the response of bare LPGs is not species
Nevertheless, it has been shown that bare LPGs may be used for
on-line monitoring of the concentration of aqueous solutions of materials and of materials in harsh environments for industrial production quality control. One of the �rst examples of a long period grating applied to chemical sensing was related to the determination of calcium chloride, sodium chloride and ethylene glycol in solution [28]. Concentrations of these solutions have been measured with sensitivities equal to, or better than that of conventional hand-
−4 RIU). Since then, many other OFG
held Abbe refractometers (about 5 x 10
platforms have been described that are based on the measurement of the RI changes within the volume around the optical �ber for the measurement of isopropyl alcohol [46] (etched FBG, see section 5.3.1), glycerine [47] (etched FBG, see section 5.3.1), sucrose [49], ethanol and glucose [49], cane sugar [50], antifreeze [27] and chloride ion [51, 52].
Moreover, the use of LPGs to
monitor the re�ning of kerosene, which requires that the concentration of organic aromatic compounds such as benzene and xylene has to be measured, has been proposed [29]. To demonstrate the feasibility, the concentration of a binary solution of xylene in heptane was measured with a minimum detectable volumetric concentration of about 0.04%, corresponding to a refractive index
−5 [29]. This is comparable to the accuracy of the standard
change of 6 x 10
techniques, such as liquid chromatography and UV spectroscopy. As discussed in chapter 3, the wavelength shift for a particular band of a long period grating due to axial strain or temperature is a strong function of the optical �ber parameters and the order of the corresponding cladding mode. The di�erential shift in two or more attenuation bands of an LPG can be utilized for multi-parameter sensing [14].
Among these multi-parameter
sensing techniques, the use of two cascaded LPGs, with di�erent periods chosen such that one LPG had an attenuation band that was insensitive to temperature changes, while the other one had a band that was insensitive to refractive index variations, has been shown to allow simultaneous, independent measurement of these two parameters [151]. This potentially allows the
5. Optical �ber gratings for physical and biochemical sensing
174
temperature-independent monitoring of chemical solutions with temperaturedependent refractive indices. Another example concern the use of two di�erent attenuation bands of an LPG centered at two di�erent wavelengths for simultaneous measurement of axial strain and temperature [44]. By writing a system of two independent equations related to the two di�erent attenuation bands and by assuming all the four coe�cients of axial strain and temperature related again to the two di�erent attenuation bands are known, the value of both
∆� and ∆T
can be evaluated. Although this approach is very simple, the
non-linearity in the four coe�cients requires at-large that they be expanded in higher order terms. Additionally, the cross-sensitivity between strain and temperature causes the linear and higher order coe�cients related to
∆ � to be
functions of temperature [14]. If both the non-linearity and cross-sensitivity are appropriately characterized, a single LPG can be used for simultaneous strain and temperature measurements.
Among the multi-parameter sensing, some example of hybrid grating con�gurations have been reported in the literature.
Patrick et al [152] pro-
posed a novel sensor, which used the di�erence in strain and temperature response of two in-line FBGs and an LPG to discriminate between strain- and temperature-induced shifts of the resonance wavelength. The large di�erence in temperature response of the LPG compared to the FBGs made LPG's excellent candidates for dual grating sensors. The sensor con�guration presented by the authors uses the advantages of the LPG sensor, while allowing the system interrogation to be performed entirely on the FBG re�ections. Strain and temperature were simultaneously measured with a root mean square (rms)
±9 µ� and of the measured temperature from the applied temperature of ± 1.5 , respectively. deviation of the measured strain from the applied strain of
Jesus et al [43] described a �ber optic sensing system for simultaneous measurement of refractive index and temperature, based on a hybrid �ber Bragg grating/long period grating arrangement.
The experimental results showed
that the proposed setup had a good performance in terms of linearity and sensitivity, with a maximum sensor resolution for the refractive index of about 2 x
−5 RIU. The sensing con�guration has the ability to be read-out in re�ection
10
and works in the telecommunications window. Moreover, the proposed sensing system has good characteristics for application in salinity measurements or for
5.3. Theory of optical �ber gratings for biochemical sensing
175
detection of pollutants and other chemical substance.
5.3 Theory of optical �ber gratings for biochemical sensing uch
M
research has gone into the study of antigen detection, drug recog-
nition and the development of antibodies in order to diagnose and treat
harmful illnesses. Previous to the last decade or so, most biological reactions have been monitored predominantly on a chemical basis. The Enzyme-Linked Immuno-Sorbent Assay (ELISA) is a good example.
The assay allows re-
searchers to assess whether or not a reaction is taking place and at which degree. Though the ELISA is a widely used method of antibody-antigen interaction detection, it has the drawbacks of requiring chemical treatment and manipulation of the samples and several time-consuming steps [153]. The expensive and delicate process associated with the labeling of antibodies is a concern. Polystyrene binding capacity and non-speci�c adsorption e�ects also o�er drawbacks to the ELISA. Optical sensing techniques can be employed to eliminate some of these problems.
For example, optical techniques can
o�er real-time results in a short period of time, sometimes eliminating the need for labeled secondary antibodies. Constructing a more desirable means of detection to yield real-time results with a minimum of preparation techniques is the motivation behind attempting to use long period gratings as �ber optic biosensors. They o�er the possibility to use an optical approach to detect chemical and biochemical species without resorting to luminescenceor absorption-based measurements. This distinctiveness is important and can be essential to measure chemicals and biochemicals which do not have optical properties or which interact selectively with recognition elements without producing �uorescence or absorption changes. In bioassays, for example, the most di�used optical approach is provided by label-based assay, which exploits the interaction between the analyte under study and a biological recognition element (BRE), labeled with �uorescent or chemiluminescent labels. On the other hand, the use of labeled BREs very often implies multistep detection protocols (as in the ELISA tests or in sandwich assays), which can complicate the biochemical interaction and can cause sensor cross-sensitivities. In con-
5. Optical �ber gratings for physical and biochemical sensing
176
trast, the label-free approach does not have this inconvenience and o�ers the possibility to measure the interaction between the BRE and the analyte directly and in real time, providing the possibility of also investigating dynamic interactions. In biochemical sensors, the biological recognition element capable to bind with the analyte can be used and, in this case, also high selectivity can be also reached, as in all biosensors, depending on the a�nity between the BRE and the investigated analyte. In the last years optical �ber gratings (OFGs) have been proposed as tools for chemical and biochemical sensing [36] and many examples are described in the literature of the last years. The use of OFGs can o�er some advantages compared to other ones thanks to the typical properties of optical �bers such as compactness, lightweight and, from a technological point of view, to the fact that they are highly compatible with optoelectronic components/devices used for standard optical �bers, since the working wavelengths are generally in correspondence of the telecommunication windows around 1.3
µm.
µm
and 1.5
Moreover, the combination of the use of optical �bers with the fact that
the signal modulation is spectrally encoded o�ers multiplexing and remote measurement capabilities which the other technology platforms are not able to or hardly can o�er. Among all the existing technology platforms measuring the RI of a surrounding medium, those based on surface plasmon resonance (SPR) are the most di�used ones [32].
Other well-known and fascinating
technology platforms are based on the use of interferometers, implemented both on optical �bers and planar waveguides and optical resonators, which in terms of resolution can be comparable with SPR [31]. In recent years, optical �ber gratings based on both LPGs and FBGs have been proposed as tools for chemical and biochemical sensing and many examples are described in the recent literature [36, 65]. Subsection 5.3.1 describes the use of FBGs in the �eld of biochemical sensing, whereas subsection 5.3.2 of this section talks about the use of LPGs in the same �eld.
5.3.1 Fiber Bragg gratings Although �ber Bragg gratings are unquestionably an attractive sensing platform, these are limited by either sensitivity to strain and temperature, and they are also characterized by expensive demodulation schemes [14]. This
5.3. Theory of optical �ber gratings for biochemical sensing
177
type of grating is useless for the measurement of the surrounding RI (SRI) and hence for the use in the biochemical �eld, since the optical radiation is strongly con�ned within the �ber core and only a small amount of the radiation is transferred to the �ber cladding and, in any case, never reaches the external environment.
The interaction of the optical radiation, which
travels along the �ber core, with the external environment can be achieved by suitable modi�cation of the FBG structure. Therefore, surrounding refractive index sensors using FBGs need either to etch or to taper the �ber cladding, or to tilt the grating planes at a certain angle in order to gain access to the evanescent �eld of the guided counter-propagating core mode. These two types of modi�ed FBGs, the transmission properties of which are modulated by SRI changes, are illustrated in �gure 5.13: the tilted FBG (TFBG) and the etched FBG (EFBG). The red arrows in �gure 5.13 show how the interaction with the
Figure 5.13: Basic con�gurations of modi�ed �ber Bragg grating to be used as surrounding refractive index sensor: tilted �ber Bragg grating (a) and etched �ber Bragg grating (b) [17]
surrounding medium occurs. The graph on the right of each FBG delineates the transmission spectrum in the presence of a broadband source.
The red
178
5. Optical �ber gratings for physical and biochemical sensing
curves in these graphs provide an indication of the e�ect of an increase of the SRI in the �ber transmission spectrum. Figure 5.13(a) shows the TFBG, where the index modulation pattern is constituted by grating planes tilted by a certain angle
θ
with respect to the �ber axis. Typical tilt angles are in
the range from 2° to 20°. Such tilt angles allow the coupling of the light from the fundamental guided core mode to the counter-propagating cladding modes, which are sensitive to changes of the surrounding RI [38]. Figure 5.13(b) shows the EFBG in which a partial etching or tapering of the �ber cladding allows the evanescent �eld to extend e�ectively into the surrounding medium [39]. It is clear that the maximum SRI sensitivity of EFBGs can be achieved when the �ber cladding is totally etched, that is to say, when the evanescent wave interacts more with the surrounding medium.
It is worthy of noticing that
an SRI increase gives rise to a red shift of the resonance wavelength in both TFBGs and EFBGs, whereas a blue shift of the loss peaks (opposite trend) is observed for LPGs, as exactly expected from the literature. Furthermore, for all modi�ed FBGs, the maximum sensitivity is approached when the SRI is close to that of the �ber cladding, as for LPGs.
On the other hand, the
closer is the SRI to the RI of the �ber cladding, the less de�nite is the shape of the attenuation band, with its complete disappearance for
nsur = nclad ,
which
practically corresponds to a cladding with an in�nite thickness. This �attening of the loss peak leads to greater di�culty in the evaluation of the resonance wavelength and, consequently, to worse accuracy of the measurement [26]. Finally, it is worthy of highlighting that, among the technological platforms using optical �ber gratings, the EFBGs are surely the least promising, since higher sensitivities can be achieved only with larger and larger etching of the �ber cladding, which implies a very high fragility of the structure.
5.3.2 Long period gratings Di�erent from FBGs, standard bare LPGs can be used for sensing purposes in both the chemical and biochemical �eld.
The sensing mechanism relies
upon the measurement of a change of refractive index associated with a chemical/biochemical reaction that takes place over the grating region. Therefore, a direct detection of molecular interactions can be carried out, while avoiding the use of auxiliary chemical components (
label-free approach ).
DeLisa et
5.3. Theory of optical �ber gratings for biochemical sensing
179
al [65] �rstly demonstrated the feasibility of using LPGs to develop a �ber optic biosensor.
By means of a bio−functionalization of the �ber portion
in which the grating has been inscribed, with amino, carboxylate or biotin groups, it allows to immobilize antibodies on the �ber surface with a covalent bond. This in turn permits to measure the bioreaction between bound antibodies (receptor) and free antigens (ligand) as a change in refractive index that further results in a spectral shift of the LPG resonance wavelengths. The selectivity and RI sensitivity of LPG immunosensors render them ideal tools for use in medical diagnosis, environmental monitoring, bioprocessing and other applications (see section 5.4). It is quite easy to understand that the refractive index value of most chemical/biochemical solutions ranges from 1.33 RIU (refractive index of distilled water) up to about 1.4 RIU. This RI range corresponds to the minimum slope of the RI response curve of LPGs and hence the minimum SRI sensitivity of LPGs, as can be observed in �gures 5.6 and 5.7. It was demonstrated that all the attenuation bands within the LPG transmission spectrum exhibit the same shape of the RI response, but the magnitude of the shift of resonance wavelength is dependent on the order
p of the corresponding coupled cladding
mode [27]. Although higher order cladding modes exhibit a greater shift of resonance wavelength than lower order cladding modes, the obtained best RI resolution in the above-mentioned RI range does not reach a value of about
−5 RIU or lower, which is necessary to develop a credible biochemical sensor
10
with performance comparable to other existing techniques (ie surface plasmon resonance). Moreover, LPGs are not chemical/biochemical species-speci�c and are limited to work with solutions characterized by refractive indices less than or equal to the RI of the �ber cladding. Therefore, a new class of OFGs based on coated LPGs has been studied widely. Of more interest was the potential for deposition of overlay materials that exhibited variations of the their refractive index in response to changes in refractive index of the local environment. In this case, the �ber cladding of an LPG is coated by a nm-thick thin-�lm whose refractive index is higher than that of the cladding glass. It was observed that, for �lms of RI higher than that of the cladding glass, the resonance wavelength and transmission value of the attenuation bands exhibited a very high sensitivity to the optical thickness
5. Optical �ber gratings for physical and biochemical sensing
180
of the deposited overlay, when the thickness of the �lms was of the order of a few hundred nanometers [18�22, 154, 155]. For materials characterized by a RI lower than that of the cladding glass, the sensitivity to the thickness of the overlay material is considerably reduced [16]. This is quite distinct from the behavior under bulk immersion of solutions in which the highest sensitivity is observed for refractive indices lower than that of the �ber cladding, as shown in �gure 5.7(a). The illustrative schematic of a thin-�lm coated LPG structure is shown in �gure 5.14(a).
Figure 5.14(b) depicts the refractive index pro�le
Figure 5.14: Schematic of a thin-�lm coated LPG structure (a) and the corresponding refractive index pro�le (b) [18]
of the coated LPG structure correspondingly. overlay,
acoat
ncoat
is the RI of the deposited
is the total radius of the coated LPG structure and
nsur
is the
RI of the surrounding medium, depicted in the �gure as the RI of the air
5.3. Theory of optical �ber gratings for biochemical sensing (nsur
= 1).
The thickness of the thin-�lm
d
is thus
d = acoat − aclad .
181
Even if
the �gure 5.14(b) is not perfectly in scale, it can be seen that the less thickness is that of the �lm, whereas the largest value of the refractive index is again that of the �lm (ncoat
> ncore > nclad > nsur ).
It was �rstly demonstrated by Rees et al [19] that both the resonance wavelength and minimum transmission of the LPG attenuation bands exhibit a dependence on both the thickness and refractive index of an overlay material, even when the coating has a RI higher than that of the cladding glass. So the coatings may be engineered to change their optical properties in response to an external perturbation. A lot of con�gurations have been discussed [21], which facilitate the interaction between modes of the optical �ber and the coatings, o�ering techniques for monitoring changes in optical properties of the coating. The two major nano−coating techniques that have been reported in the literature are unquestionably the electrostatic self−assembly (ESA) and the LangmuirBlodgett (LB) deposition. Each facilitates the deposition of a surface coating, one molecular layer at a time, providing a control over the layer thickness at nanometer scale.
Both techniques allow the formation of thin
�lms at room temperature and pressure. Moreover, both techniques require careful cleaning of the �ber surface having previously removed the its jacket. The LB technique is based on the fabrication of monolayer �lms, which are �rst oriented on a sub−phase and subsequently transferred, layer by layer, onto a solid surface (ie optical �ber) at room temperature and molecule speci�c surface pressure. It was proved that this technique o�ers high resolution control over the �lm thickness of about 1-3 nm per layer and hence results ideal for optical �ber applications. On the other hand, the ESA technique allows the deposition of multilayered �lms of magnetic, electrically conductive and nonlinear optical materials onto a substrate. This technique is based on the alternate dipping of a charged substrate into solutions of cationic and anionic polymers. The growth of the �lm occurs by means of the electrostatic attraction between the opposite charges of molecules in alternate monolayers. It is clear that these two techniques o�er a number of di�erent features. LB �lms consist of a single chemical species. This homogeneity is not available using the ESA method, because it requires alternate layers of oppositely charged materials. On the contrary, the ESA technique makes possible to incorporate
5. Optical �ber gratings for physical and biochemical sensing
182
more than two molecules into the multilayer due to the attraction of opposite charges.
Therefore, aperiodic multilayer assemblies may be prepared, o�er-
ing more versatility than the LB technique. Finally, �lms constructed using the ESA technique have been shown to have good thermal and mechanical properties, whereas those constructed using the LB technique su�er from the applied stress which may compromise the integrity of the LB multilayers. Reference [19] dates, for the �rst time, the e�ect of the overlay thickness on the transmission spectrum of a LPG. Rees et al used the LB technique for controlling the overlay thickness of the deposited thin-�lm.
ω−tricosenoic
The LB �lm of
acid, which has a refractive index of 1.57 RIU and a molecu-
lar length of 2.6 nm, was deposited onto an optical �ber containing an LPG. Figure 5.15 shows the experimental shift of the resonance wavelengths of two di�erent cladding modes as a function of the overlay thickness, when the surrounding medium is air (ie
nsur = 1).
correspond to the coupling to the tively.
p=
The �lled circles and �lled squares 9 and
p=
11 cladding modes, respec-
From the �gure some interesting features can be extracted.
Firstly,
the trend of the two resonance wavelengths is the same, but the magnitude of the shift is dependent on the order
p
of the corresponding cladding mode.
In addition, three di�erent regions from A to C can be observed, which are characterized by three distinct trends of both the resonance wavelengths. For an overlay thickness lower than 250 nm (region A), the resonance wavelengths exhibited a blue shift of about 5 nm. For an overlay thickness ranging from 250 nm to 380 nm (region B), the amplitude of the attenuation bands in the �ber transmission spectrum approached to zero showing that no couplings occurred, and thus no resonance wavelengths could be recorded. This range of overlay thickness de�nes the so-called cut-o� thickness
dcut-o� .
For an overlay
thickness greater than 380 nm (region C), �nally, the resonance wavelengths were recorded again and exhibited a blue shift once again, but the their values were higher than originally observed in absence of the overlay material. As the �lm thickness was increased further, the resonance wavelengths returned toward their original values.
The authors developed a numerical model in
order to explain the dependence of the resonance wavelengths on both the thickness and refractive index of the coating. The e�ective refractive indices of the cladding modes were calculated as a function of wavelength and overlay
5.3. Theory of optical �ber gratings for biochemical sensing
Figure 5.15: Experimental shift of the resonance wavelengths of the (�lled circles) and
183
p =
9
p = 11 (�lled squares) cladding modes, plotted as a function
of the overlay thickness [19]
thickness by considering the cladding/overlay system as a stack of thin �lms and employing the transfer matrix method (see section 3.3) [19], whereas the e�ective RI of the fundamental core mode was calculated by means of the Gloge's approach [80]. Afterwards, using the LPG characteristic equation, it was possible to obtain the value of the resonance wavelengths as a function of the overlay thickness. Some discrepancies, which arose from the approximations made and from the not-so-complete knowledge of the �ber and overlay material parameters, came out but the experimental behavior was explained qualitatively, anyway. Initially, only the surrounding air in�uences the e�ective RI of the cladding mode. As the �lm thickness increases (region A), both the LB �lm and the air in�uence the cladding mode, increasing the average external refractive index and thus the e�ective RI of the cladding mode. As the average external refractive index experienced by the cladding modes increases, a blue shift in resonance wavelength occurs, as would be expected
184
5. Optical �ber gratings for physical and biochemical sensing
from the classical theory of SRI sensitivity. In region B, the average external refractive index is approximately equal to that of the �ber cladding. In this case the structure does not support guided modes and hence no attenuation bands can be observed in the �ber transmission spectrum. In region C, �nally, a more complex structure exists. The existence of cladding modes, when the surrounding RI is higher than that of the cladding glass, was just explained by the presence of leaky modes. As the thickness of the LB �lm increases further, the resonance wavelengths would be expected to approach the value observed for an overlay of in�nite extent. Later, more rigorous theoretical treatments, where the high RI (HRI) coated LPGs have been modeled as four layer structure and have been treated using the CMT, con�rmed the previous experimental results but provided a new interesting explanation of the physical and optical principle, which allowed to understand how the coupling between modes occurs in coated LPGs and hence how the shift of the resonance wavelengths can be evaluated. The �rst comprehensive theoretical and numerical analysis was reported by Del Villar et al [20, 22, 154, 156]. Cusano et al [55, 155] studied theoretically and experimentally the responses and sensitivities of coated LPGs for chemical and biochemical applications. Using a linearly polarized (LP), weakly guiding approximation, it was demonstrated that, as the thickness of an overlay of refractive index higher than that of the �ber cladding is increased, the thin overlay becomes capable of guiding one of the cladding modes. During the transition to guidance, the e�ective RI of the considered cladding mode varies rapidly, as evidenced by the rapid change in resonance wavelength of the attenuation bands (see �gure 5.16).
The curves depicted in �gure 5.16
were obtained by means of a coated LPG inscribed in a SMF-28 optical �ber.
µm, cladding diameter of 125 µm, core RI of 1.5362 RIU, cladding RI of 1.5306 RIU, overlay RI of 1.67 RIU + − ([P DDA /P olyS − 119 ]), grating period of 276 µm and grating length of 25 mm. Because the RI modulation is considered sinusoidal, σ (z) = s0 = s1 = 1 The LPG parameters are: core diameter of 8.3
and the amplitude of the modulation is about 3 x 10
−4 RIU.
In the absence of losses (the imaginary part of refractive index) in the overlay, it is the cladding mode with the highest e�ective RI, or rather the lowest order cladding mode that is guided by the overlay. The transition is
5.3. Theory of optical �ber gratings for biochemical sensing
185
Figure 5.16: E�ective refractive index of cladding modes as a function of the overlay thickness [20]
also characterized by a strong reorganization of the cladding modes, as can be seen from �gure 5.16. Moreover, the e�ective refractive indices of the cladding modes are then increased to that of their nearest lower order cladding mode in the absence of the overlay in order to cover the energy state left by their predecessors, as illustrated in the same �gure.
Further increases in overlay
thickness cause this process to repeat, thus more cladding modes are guided by the overlay and a new reorganization of cladding modes takes place. The LP approximation does not predict the disappearance of the attenuation bands unless the overlay material exhibits a complex refractive index. In this case, the attenuation of the cladding modes is predicted to increase rapidly in the transition region, which reduces the coupling coe�cient between the core and cladding modes and, as a result, causes the extinction of the attenuation bands [156]. The attenuation bands corresponding to the coupling
186
5. Optical �ber gratings for physical and biochemical sensing
to higher order cladding modes than those guided by the overlay, recover the PMC of the immediate lower order cladding mode.
The attenuation bands
corresponding to the coupling to cladding modes of order lower than those guided initially, su�er a blue shift before recovering their original resonance wavelength. It is worthy of highlighting that, when coated LPGs are taken into account, the LPG characteristic equation can not be used to calculate accurately the value of the resonance wavelengths. However, if the modi�ed �rst-order Bragg condition (see equation (3.101)) is applied, errors are lower than 0.1% [103]. This is because the self-coupling coe�cients are more related to changes in the resonance wavelength of the attenuation bands, whereas the cross-coupling coe�cients modify the minimum transmission value of the attenuation bands. Following the above-discussed analysis, the response of the resonance wavelengths to the deposition of thin �lms of di�erent RI can be obtained. example is shown in �gure 5.17.
An
The �gure show the in�uence of the overlay
Figure 5.17: Shift of the resonance wavelength as a function of the overlay thickness for di�erent value of the refractive index of overlay material: �lled triangles 2 RIU, �lled rhombuses 1.7 RIU and �lled squares 1.57 RIU [21]
5.3. Theory of optical �ber gratings for biochemical sensing
187
refractive index on the sensitivity of the LPG. The �lled triangles trend is obtained with a RI of the overlay of 2 RIU, the �lled rhombuses of 1.7 RIU and, �nally, the �lled squares of 1.57 RIU. It can be seen that, as the RI of overlay material increases, the region of high sensitivity moves to lower thickness and the wavelength shift is lower. Therefore, it is also possible to predict the sensitivity of the attenuation bands to changes in the refractive index of the overlay, assuming a constant overlay thickness.
This indicates undoubtedly
the potential for developing sensors based on nanometer−scale coatings that change their refractive index in response to an external perturbation. As can be easily understood remembering the LPG characteristic equation, the immediate consequence of the shift in e�ective RI (see �gure 5.16) is that it leads to a displacement in all the attenuation bands. Furthermore, Del Villar et al [20, 22] found that there are an optimal deposition thickness value for each cladding mode where the shift of the resonance wavelength as a function of the surrounding RI is highest. This value is known in the literature as optimum overlay thickness (OOT). Figure 5.18 shows OOT for the
p=
15 cladding mode (high order cladding mode) as a function of the overlay
refractive index.
For higher values of overlay RI, the OOT tends to lower
values because the guidance in the overlay starts sooner for the higher contrast of refractive indices between the cladding and the overlay.
The OOT
value depends not only on the overlay RI, but also on the surrounding RI. Consequently, a good choice for a high sensitive device to the surrounding RI is to stop the deposition when the ERI value of a mode is located between the ERI of the mode itself before the deposition and that of the next lower order cladding mode before the deposition. To calculate a more exact value, the modi�ed �rst-order Bragg condition (see equation (3.101)) has to be used.
By considering three di�erent RI overlay materials, 1.57 RIU for
ω−tricosenoic acid, 1.62 RIU for [P DDA+ /P olyR − 47− ] and 1.67 RIU for [P DDA+ /P SS − ], Del Villar et al [20] showed that, if the overlay RI is higher, the guidance of a cladding mode starts faster, or rather the transition happens earlier, as illustrated in �gure 5.19.
It was proved that there are two
important advantages for using a higher RI coating. Firstly, a lower amount of material is needed for the deposition and thus this saves much time. Secondly, the transition to guidance of a cladding mode in the overlay is faster,
188
5. Optical �ber gratings for physical and biochemical sensing
Figure 5.18: Optimum overlay thickness for the
p=
15 cladding mode as a
function of the overlay refractive index [22]
which implies a higher variation of the e�ective RI of the cladding modes as a function of the surrounding refractive index and hence a higher shift of the resonance wavelengths. It is clear that, even if the OOT is not exactly �xed for a cladding mode, there is a range of values that also allows high sensitivities as a function of the surrounding RI. Therefore, once the refractive index of the overlay has been determined, the versatility of this phenomenon is proved by the dependence of the OOT on a second parameter, namely,
nsur .
This allows
to design refractometers sensitive to speci�c ranges of surrounding refractive indices. In fact, �gure 5.19 shows the design of a coated LPG to be used as a gas sensor. The OOT for the third cladding mode (p
=
5) is 278.5 nm and
the three curves have been obtained for a SRI equal to 1 RIU (RI of air and so of gases). The choice of using the third cladding mode in this analysis is to demonstrate that, even for low order cladding modes, the phenomenon is appreciable and hence the RI sensitivity can be greatly enhanced. Del Villar et al [20] found experimentally that the decrease in the optimum overlay thickness, as the SRI increases, can be explained by means of the slab waveguide theory. A second example shows how a suitably coated LPG can
5.3. Theory of optical �ber gratings for biochemical sensing
Figure 5.19: Shift of the resonance wavelength in the
189
p = 5 cladding mode as
a function of the overlay thickness for di�erent overlay refractive index when the coated LPG is placed in air (nsur
= 1)
[20]
be used as RI sensor with high sensitivity for the detection of oils, which are characterized by a RI around 1.468 RIU. After having calculated the OOT of 159 nm, optimized around a SRI of 1.468 RIU, the evolution of the resonance wavelength of the �fth (p
= 9) cladding mode cause by a change in surrounding
RI of di�erent oils is shown in �gure 5.20.
Figure 5.20(a) illustrates the shift
of resonance wavelength of the �fth cladding mode for an LPG where no overlay is added. Three di�erent oils with refractive indices 1.461 RIU (tee), 1.481 RIU (cod) and 1.518 RIU(tung) are considered. In �gure 5.20(b), the same is done for an LPG with OOT optimized for surrounding refractive index around 1.468 RIU. It can be clearly observed that the LPG with the overlay
190
5. Optical �ber gratings for physical and biochemical sensing
Figure 5.20: LPG transmission spectra of the
p=
9 cladding mode for three
di�erent surrounding refractive indices without the overlay (a) and with an overlay characterized by a thickness of 159 nm and a refractive index of 1.67 RIU [20]
5.4. Applications of optical �ber gratings for biochemical sensing
191
is also highly more sensitive than the other one, in this case, where the SRI is close to that of the cladding glass.
Moreover, there is an unquestionable
improvement in the RI sensitivity of the device. In fact, between the �rst and the third refractive index, there is a shift of the resonance wavelength of 22.98 nm, whereas for the LPG without overlay it is of 1.77 nm. Thus, a factor 12.98 of improvement has been obtained. In addition, a factor of 70.5 is obtained, if we only consider tee and cod oils, because their refractive indices are closer to that of the OOT has been calculated for. It is worthy of noticing that the key feature of the HRI coated LPGs relies on the possibility to tune the maximum value of the RI sensitivity over the desired SRI range by acting on both the RI and thickness of the overlay material. Moreover, the region with the highest SRI sensitivity moves towards lower surrounding refractive indices as the overlay thickness increases [155].
5.4 Applications of optical �ber gratings for biochemical sensing
Ta compact analytical device incorporating a biological or biologically derived he
de�nition of a biosensor has been decided on by IUPAC [157] and also
published by Prof. Turner and Newman [158] who referred to a biosensor
−
as:
sensing element either integrated within or intimately associated with a physiochemical transducer.
Biosensors can be classi�ed either on the base of the biological receptor or depending on the transducer. An electrochemical biosensor is a biosensor with an electrochemical transducer, such as ion selective, glass or gas electrodes for potentiometric measurements and metal or carbon electrodes for amperometric measurements [157].
Other types of biosensors are based on
mass sensitive transduction (piezoelectric shear and surface acoustic waves) and optical transduction (such as planar waveguide, optical �ber and surface plasmon resonance) [157] (see �gure 5.21). The research and technological development of optical biosensors have experienced an exponential growth during the last decade due to the potential of this technology for real time and direct detection of biomolecules or chemical substances [159�161]. As stated in a review by Marazuela et al [162], the vast
192
5. Optical �ber gratings for physical and biochemical sensing
Figure 5.21: Schematic representation of a biosensor.
The di�erent bio-
recognition elements and transducers are depicted in the �gure [23]
range of applications of optical biosensors partially arises from the possible use of optical �bers which enable the scientist
the sample.
to bring the spectrometer to
This is further demonstrated by the huge quantity of published
works on �ber optic biosensors (FOBs) which have been extensively reviewed in the last decade [161�169]. Actually, several advantages of FOBs have been presented, among which the high �exibility and the possibility of performing measurements in non-conventional, con�ned or dangerous environments: these has led to a vast area of applications in �elds like environmental surveillance, chemical process analysis, food manufacturing and storage, clinical monitoring, space and aeronautics [169]. In the clinical and veterinarian �eld many enzyme-based FOBs have been developed for the detection of blood glucose, some of which with a needle-type con�guration [24, 170, 171] (see �gure 5.22).
5.4. Applications of optical �ber gratings for biochemical sensing
193
Figure 5.22: Schematic representation of (A) hybrid sensor and (B) implanted hybrid sensor [24]
Other enzyme-based FOBs have been presented for environmental applications in the detection of heavy metals or pollutants such as organophospates [172] or carbamate pesticides. FOBs based on the use of antibodies have been published as evanescent wave immunosensors, Fabry-Perot interferometric immunosensors, surface plasmon resonance immunosensors and chemiluminescencebased immunosensors for the detection of pesticides [173], viruses [174] or for the diagnosis of speci�c diseases [175]. Optical �bers have been also coupled to nucleic acids or whole cells in the development of biosensors for the detection of mutations [176], bacteria [177], and environmental pollutants such as herbicides [178].
5. Optical �ber gratings for physical and biochemical sensing
194
All the possible bioreceptors used in biosensors have been exploited in the most recent (2009-2011) published works on FOBs: nucleic acids, enzymes, antibodies, whole cells and biomimetic receptors.
The application of these
biosensors ranges from the biomedical �eld, to the environmental or food control areas with transduction based on localized surface plasmon coupled �uorescence (LSPCF), surface plasmon resonance (SPR) or evanescent wave absorbance. Very recent nucleic acids FOBs have been proposed for application for quality control in food and beverages industries [179] with chemiluminescent detection. LSPCF FOBs have been reported for application in the biomedical �eld for the detection of prostate speci�c antigen [180], swine-origin in�uenza A (H1N1) virus [181], severe acute respiratory syndrome (SARS) coronavirus [182] and alpha-fetoprotein [183]. All these biosensors were based on sandwich immunoassays and gold nanoparticles signal enhancement and could detect the target molecule at high sensitivity in complex samples such as human serum and nasal mucosa. Nanoparticles, in particular super-paramagnetic nanoparticles, were also used as signal ampli�cation tool in a �ber optic SPR biosensor for the detection of food allergens [25] (see �gure 5.23). Innovative bioreceptors such as aptamers have been also coupled to optical �bers for the development of
aptasensors :
in particular, a �ber optic
surface plasmon resonance aptasensor have been reported for the detection of immunoglobulin E (IgE), a protein which plays an important role in many allergic reactions [184].
5.4.1 Fiber Bragg gratings Among the modi�ed FBG structure, an interesting example has been reported for the detection of deoxyribonucleic acid (DNA) hybridization by means of an etched FBG [185]. The proposed sensor was developed by etching away the �ber cladding and part of the �ber core. The physical mechanism is based on detecting the change of resonance Bragg wavelength due to the changes in RI of the surrounding medium. The maximum sensitivity of about 1394 nm RIU
−1 was achieved, when the diameter of the �ber core was reduced
to about 3.4
µm
and the RI of the surrounding medium was close to that of
−6 RIU.
the �ber core. Moreover, the sensor achieves a RI resolution of 7.2 x 10
5.4. Applications of optical �ber gratings for biochemical sensing
195
Figure 5.23: (A) Fiber optic SPR probe; (B) schematic representation of the system setup; (C) overview of the immunoassay strategies on the �ber optic SPR biosensor; (D) the spectrum dips in PBS bu�er after 10 min incubation of the SPR �ber in: a negative control sample (blue dip), a sample containing the antigen (red dip), a sample containing the antigen subsequently labeled with antibody linked nanobeads (black dip) [25]
The sensitivity at lower surrounding RI was achieved by using higher order
−1
modes excited in the Bragg grating region and a value of about 404 nm RIU
was obtained by the authors around 1.4098 RIU. Having said that, the etched core FBG sensor was further investigated to detect hybridization of DNA. Single stranded DNA oligonucleotide probes of 20 bases were immobilized on the surface of the grating using a common glutarahyldehyde chemistry. Hy-
196
5. Optical �ber gratings for physical and biochemical sensing
bridization of the complimentary target single strand DNA oligonucleotide was monitored in situ and successfully detected.
5.4.2 Long period gratings Most of the literature about LPGs used as refractive index sensors has concentrated upon the bulk immersion of the LPG into a solution. It is attractive to consider the prospect of depositing overlay materials that exhibit changes in their refractive index and/or in their thickness in response to local environment variations.
In this way, the LPG may be also used to form a
species-speci�c chemical/biochemical sensor.
In practical LPG-based sensor
applications, the deposited �lm serves as the sensing element by incorporating sensing chemical/biological molecules into it, whereas the LPG serves as the optical transducer for signaling the occurrence of a chemical/biological interaction event of interest. The demonstration that OFGs can be used as biosensors was given by Wang et al [65] which showed that ionic self-assembled multilayers adsorbed on LPGs work e�ectively as biosensors, in which the biotinstreptavidin system serves as the bioconjugate pair.
The same authors [18]
reported a guideline for building e�cient LPG−based sensors for practical use. Reference [19] shows that the coupled cladding mode cuts o� and turns into a leaky mode, when the LPG is coated with a thin-�lm whose refractive index is higher than that of the cladding glass and its thickness is larger than a cut−o� thickness
dcut-o� .
This is because a leaky mode is not guided due
to the total internal re�ection, but exists because of Fresnel re�ections at the �ber cladding/thin−�lm interface. In such case, weak attenuation bands are obtained and the coated LPG structure is not suited for sensing purposes. Therefore, the key condition is to guarantee the existence of guided cladding modes and this can be achieved by coating the LPG with a thin−�lm of a thickness smaller than
dcut-o� .
LPG-based biosensors have been investigated by immobilizing antibodies on the surface of the �ber and monitoring the change in refractive index that occurs when an antigen binds with the antibody [65]. This is the �rst reported example of the use of an LPG to form a species-speci�c biochemical sensor, offering a good performance not again comparable with other techniques, which include both the surface plasmon resonance (SPR) and interferometric con�g-
5.4. Applications of optical �ber gratings for biochemical sensing
197
urations (ICs), but with the prospect for on-line monitoring. Moreover, the deposition of thin-�lm overlays by means of the Langmuir-Blodgett technique has been proposed to develop chemically sensitive sensors based on coated LPGs [19], o�ering the prospect for the development of a range of new speciesspeci�c chemical sensors. Moreover, LPGs applied for label-free detection of speci�c bacteria using physically adsorbed bacteriophages were presented for the �rst time by Smietana et al [62]. LPGs were used also for the measurement of DNA hybridization [63, 64] and for antibody/antigen interaction [40, 65�68]. OFG and SPR can be combined, by depositing a thin gold layer on the grating surface [48]. A high sensitive biosensor based on a 20 nm gold coating applied on a TFBG has been recently proposed for real-time and label-free monitoring of both the formation of DNA monolayer in aqueous environment and complementary DNA binding [69]. Tang et al [70] proposed a new class of biosensor using an antibody-antigen binding model for dinitrophenol (DNP), relying on the modi�cation of the grating portion of a long period �ber grating with self-assembled Au colloids, which is sensitive to the RI of the colloidal gold surface and, hence, is suitable for label-free detection of biomolecular binding at the surface of Au colloids. It was widely demonstrated that, if a �lm of appropriate thickness is deposited, then a small change in the surrounding refractive index causes a large shift of the resonance wavelength, giving the chance to develop highly sensitive sensors. This has been exploited by dip-coating the nanoporous crystalline from syndiotactic polystyrene (sPS) onto an LPG [186].
δ
sPS reversibly ad-
sorbs analytes of suitable size and shape, with a concomitant change in refractive index of the deposited layer. The sensor was shown to be capable of sub−ppm (parts per million) detection of chloroform in water. The authors demonstrated that an appropriate choice of the overlay thickness allows the optimization of both the response time and sensitivity of the device. Furthermore, the deposition of nanostructured �lm onto concatenated or in-series LPGs has been reported [187].
The authors proved that, if these
�lms are deposited on the length of the optical �ber that separates the two LPGs, then they a�ect only the interference fringes produced by means of the interferometric mechanism, while, if these �lms are deposited along the entire length of the device, then they in�uence both the interference fringes and the
198
5. Optical �ber gratings for physical and biochemical sensing
attenuation band envelope.
Part II
Flow cell for refractive index measurements: design, development and test
Chapter 6
Experimental setup for refractive index measurements The most beautiful thing we can experience is the mysterious. It is the source of all true art and science. Albert Einstein
6.1 Basic concepts about the refractive index measurements
R
efractive index (RI) measurements in liquids have been used for many years in the quantitative measurements of both optical parameters in the
physical �eld and analytes in the biochemical �eld.
Within the optical ap-
proach, optical �ber long period gratings (LPGs) have been extensively proposed for physical, chemical and biochemical sensing. These sensors have high sensitivity to the surrounding RI (SRI), in addition to all the other bene�ts o�ered by optical �ber sensors. For these reasons, a number of refractometric measurement systems that make use of LPGs have been proposed in the literature [16, 27, 40�43].
However, LPGs show great sensitivity not only to
the SRI, but also at the same time to temperature, strain and �ber bending. The in�uence of these parameters can be essential when the refractometric measurement is carried out with the investigated sample �owing within a �ow cell, as generally occurs whenever the measurement of the RI is carried out for chemical/biochemical sensing. The literature about LPGs shows that these devices can be used as a sensitive measure of chemical/biochemical concentration for liquids in the range of refractive index from 1.33 RIU to 1.43 RIU. Patrick et al [27] dealt �rstly
202
6. Experimental setup for refractive index measurements
with a remaining technical challenge in order to realize practical and credible RI sensors for liquid samples.
This technical challenge was related to both
strain and temperature cross-sensitivities. Strain sensitivity can be addressed by mounting the LPG under tension to a material with the same coe�cient of thermal expansion as the optical �ber, so that strain is held constant during the measurements. Moreover, by �xing the optical �ber upon a suitable framework, the �ber bending which represents another LPG cross-sensitivity, is also avoided. In addition, it was extensively demonstrated that any changes in temperature cause also the shift of the resonance wavelengths of the LPG attenuation bands in the transmission spectrum of the �ber [73,132,152] due to both the intrinsic temperature sensitivity of the LPGs and the temperaturedependent refractive index changes of the liquids, which is ascribed to the thermo-optic e�ect acting on the di�erent solutions [26, 188]. The �rst e�ect is most easily addressed using a simultaneous measurement technique, such as employing another optical �ber grating written in series with the LPG. The best choice is unquestionably a �ber Bragg grating, which is insensitive to the surrounding refractive index and can also be employed as a temperature monitor and correcting for the intrinsic temperature sensitivity of the LPG. The second e�ect is inherent to any RI-based sensor and thus it is required the calibration of the liquid's
d nsur /d T
(evaluation of the thermo-optic coe�cient
of the investigated liquid), as well as limiting the range of operating temperatures of the sensor if the mixtures have very di�erent values of
d nsur /d T .
As
explained in subsection 5.1.2, because the value of the temperature sensitivity of LPGs is also dependent on thermo-optic e�ect acting on the di�erent solutions/liquids, the temperature sensitivities of the used LPG for all the solutions, or rather the temperature sensitivities
STLPG (p)
for all the used RI values
is di�erent and hence they have to be determined.
Said that, the chapter starts with the description of the proposed methodology in order to get rid of the variations coming from the sensor crosssensitivities and also shows a comprehensive block diagram of the entire system for refractometric measurements (section 6.2). The chapter carries on with an exhaustive description of the manufactured thermo-stabilized �ow cell (section 6.3), which has been used for both physical and biochemical measurements. Moreover, the chapter talks about the developed system for the fabrication
6.2. Methodology of the proposed refractive index sensor
203
of the gratings (section 6.4) and the reason of our choices will be discussed. Certainly, the most attractive feature of the proposed manufacturing system is that it makes possible both the fabrication of FBGs and LPGs using the same laser source and the entire customization of the grating parameters. Finally, the used interrogation system and data processing are also explained (section 6.5) together with the �uidics system and chemicals (section 6.6) used for carrying out the RI measurements.
6.2 Methodology of the proposed refractive index sensor
S
tarting from the above-mentioned technical challenge, we describe the complete design, development and test of the thermo−stabilized �ow cell of
relatively low volume (tens of
µL)
for accurate RI measurements using a long
period grating. Moreover, a methodology for measuring and hence correcting all the LPG cross−sensitivity is proposed. A �ber Bragg grating written on the same �ber in series with the LPG and an accurate temperature measurement system are used to introduce feedback signals to eliminate or, in any case, to reduce to a minimum the interferences coming from changes in temperature and strain. In detail, the FBG is used for measuring small changes in strain and thus �nely correcting them, whereas a thermocouple is used for measuring and �nely correcting small changes in temperature. In fact, the in�uence of the above-mentioned parameters can be essential when the refractometric measurement is carried out with the investigated sample �owing within a �ow cell, as generally occurs whenever the measurement of the RI is carried out in the �eld of chemical/biochemical sensing. It is worthy of highlighting that the entire system is thermally stabilized as it should be done in the case of accurate RI measurements. To do this, starting from the LPG and FBG characteristic equations (see equation (3.58) and (3.57), respectively) and by making some simple mathematical manipulations, we are able to isolate the contribution of the shift of the LPG resonance wavelength only due to changes in the surrounding RI. For the FBG, we sum the two linear relations that bind the measured resonance wavelength shift (∆
λFBG res )
to a change in both the strain (∆ �), given
6. Experimental setup for refractive index measurements
204
in equation (5.2), and temperature (∆
T ),
given in equation (5.6):
FBG ∆ � + S FBG ∆ T ∆ λFBG res = g (∆ �, ∆ T ) = S� T where
S�FBG
and
STFBG
(6.1)
are the constants associated with the changes in strain
and temperature, respectively (hereafter denoted as strain and temperature coe�cients), which can be determined experimentally. For the LPG, a di�erent relation is valid.
In fact, we sum the three contributions that bind the
λLPG res (p) ) to a change in strain (∆ �), (∆ T ), given in equation (5.23), and
measured resonance wavelength shift (∆ given in equation (5.21), temperature
surrounding RI (nsur ), given in equation (5.24):
LPG LPG ∆ λLPG res (p) = g (∆ �, ∆ T, nsur ) = S� (p) ∆ � + ST (p) ∆ T + f (nsur ) 0
where
S�LPG (p)
and
STLPG (p)
(6.2)
are the LPG strain and temperature coe�cients, re-
spectively, of the coupled cladding mode, which can also be determined experimentally, and
f (nsur )
is the nonlinear function that expresses the in�uence
of changes in the RI of the medium surrounding the �ber, which is what we want to estimate. As above-mentioned, in the last equation, the e�ects which arise from the �ber bending are disregarded, since the optical �ber is suitably �xed in the �ow cell. After the experimental evaluation of the four coe�cients and by measuring both the temperature variations by means of the thermocouple and the shift of the resonance wavelengths of FBG and LPG by means of an optical spectrum analyzer (OSA), the �rst term on the right side of equation (6.1) (strain dependence) can be determined and, consequently, both the two terms on the right side of equation (6.2) (strain and temperature dependences) can
f (nsur ) can be attained. It is clear f (nsur ) gives us information about only the shift of the LPG
be determined and hence the value of that the value of
resonance wavelength induced by a change in the surrounding RI. In order to obtain the value of the surrounding RI, as occurs in the case of a classical refractometer, we have �rst to extrapolate the nonlinear response curve
f (nsur )
and its best �tting curve. All the needed steps will be described in
the experimental section about the RI measurements (see section 7.2).
6.3. Thermo-stabilized �ow cell
205
6.3 Thermo-stabilized �ow cell
T
he
most attractive part of the experimental setup for refractive index
measurements is unquestionably the thermo-stabilized �ow cell.
The
sketch of the �ow cell and its picture are shown in �gures 6.1 and 6.2, respectively.
The cell itself consists of two parts: the upper one is a 4 mm thick
Figure 6.1: Sketch of the manufactured �ow cell: longitudinal cross−section (a) and top view (b) [26]
PMMA transparent layer that makes a visual inspection of the �ow cell possible, and the bottom one is a 6 mm thick aluminum layer placed in thermal
206
6. Experimental setup for refractive index measurements
Figure 6.2: A picture of the developed �ow cell [26]
contact with a thermo-electric cooler (TEC) element that is composed of a series of three Peltier cells. A second aluminum bar is mounted on the bottom of the Peltier cells in order to increase their e�ciency. The whole system is mounted on an extruded aluminum heat sink. The �ow cell is 80 mm long, 15 mm wide and 10 mm high. The �ow channel is realized by means of a 1 mm wide, 0.5 mm deep and 50 mm long rectangular section groove that is built on the PMMA and aluminum pieces.
A gasket
obtained from a specially shaped Para�lm® sheet is interposed between the two parts in order to assure the water-proo�ng of the �ow cell. The resulting volume of the �ow channel is 50
µL. In addition, a deep v−groove of about 0.4
mm is engraved on the ends of the PMMA layer in order to locate the optical
6.3. Thermo-stabilized �ow cell
207
�ber. The �ber with its jacket is glued to the v−groove edges using an UV optical �exible adhesive (Norland 65), which, after the UV polymerization, guarantees a safe sealing of the �ow cell. In this way, the bare portion of the optical �ber, where the two gratings have been inscribed, is exactly placed at the middle of the �ow channel.
In fact, the micro�uidic theory states
that the liquids �owing inside a micro�uidic system travel by means of a laminar �ow. This means that there will be more friction along the walls of the channel, whereas the liquids will travel more regularly at the middle of the �ow channel, where the optical �ber is placed. Two stainless−steel tubes (1.6 mm outer diameter and 1 mm inner diameter) located on the upper part of the PMMA layer serve as the inlet and outlet of the �ow cell. The temperature stabilization section of the �ow cell makes use of a thermistor, inserted into the aluminum bottom part as close as possible to the �ow channel (the green wire in �gure 6.3), which acts as a feedback element on the Peltier elements that are driven by a suitable controller (ILX Lightwave LDC−3722B TEC controller).
The temperature of the �ow cell is
measured by a thermocouple connected to a thermometric measuring unit (Lutron TM−917) and placed inside the PMMA layer as close as possible to the �ow channel (the blue wire in �gure 6.3). The raw temperature data are acquired by a PC via the RS−232 serial interface, with a resolution of
±0.01
and sampling time of 2 s. The stabilization e�ect due to the use of the Peltier cells can be observed in �gure 6.4.
In order to prove the stabilization e�ect
due to the use of the Peltier cells, we measured the shift of the LPG resonance wavelength when the optical �ber was placed inside the �ow cell and the environmental temperature was about 20. The �ow channel was empty, or rather in air. The interrogation system, which allows us to measure the shift of the resonance wavelengths of both the gratings, will be described in section 6.5. Moreover, we test the thermal stabilization using an LPG instead of an FBG because an LPG is more sensitive to temperature changes (see �gure 5.5). From the �gure 6.4, it can clearly be seen that the LPG resonance wavelength exhibited a large blueshift until the stabilization system was switched on (after about 20 minutes). By setting the controller at 23 , the LPG resonance wavelength does not shown a visible shift or thermal drifts. This was further demonstrated by means of long-term measurements, when the �ow cell was
208
6. Experimental setup for refractive index measurements
Figure 6.3: A side-view picture of the �ow cell
�lled with distilled water (see subsection 7.1.3).
Notwithstanding the fact that the TEC control system makes it possible to work at constant temperature, the continuous measurement of the temperature of the �ow cell is necessary both to control possible drifts induced by environmental temperature changes during long−term measurements and to take into account the e�ects induced by pumping �uids at di�erent temperatures within the �ow channel. Moreover, the continuous measurement of the temperature is also necessary for the described methodology in order to allow the �ne temperature correction of the sensor response.
6.4. Manufacturing of the gratings
209
Figure 6.4: Stabilization e�ect on the LPG resonance wavelength by means of the Peltier cells
6.4 Manufacturing of the gratings
A
s introduced in section 1, we studied and developed during my PhD time a sensor made up of a hybrid con�guration of optical �ber gratings which
consisted of two di�erent in-line OFGs. The former was a long period grating, which was able to sense changes in surrounding refractive index, whereas the latter was a �ber Bragg grating, which was used to compensate the e�ects on the sensor response due to possible changes in strain and temperature induced on the �ber. That we had in mind, it is the development of a system for grating fabrication that could allow us to use it for both types of gratings (FBGs and LPGs) with simply small changes only. This features together with the pos-
6. Experimental setup for refractive index measurements
210
sibility of customizing both the optical and physical properties of the grating represents unquestionably an important issue, thus one of the contributions. So the developed manufacturing system makes it possible to write both FBGs and LPGs with the same facilities. Having said that and looking at the differences of the manufacturing techniques about FBGs (see the last paragraph of subsection 4.2.3) and LPGs (see the last paragraph of subsection 4.3.2), we made some observations and decided to use the following manufactur-
phase mask technique for �ber Bragg gratings, whereas the point-to-point technique with excimer KrF laser for long period gratings. ing techniques: the
The reason of these choices are a lot. Regarding the FBGs, the phase mask technique is unquestionably the most full-grown and suitable method to the current state of the art. It is also true that the equipment needed is expensive and the phase masks at our disposal were limited, but it was exactly what we needed in any case.
In fact, we already had an ultraviolet laser source and
phase masks at our disposal made possible to write FBGs, which the values of resonance wavelengths belonged to the wavelength range of the optical source used. Regarding the LPGs, the point-to-point technique with an excimer KrF (λ
=
248 nm) laser was the best choice because it allowed us to use the same
laser source for LPGs inscription by means of the use of the classical physical mechanism based on the excitation of the singlet-singlet transition band (near 242 nm) of the germanium-oxygen-vacancy defects. This method is suitable as well, because it also allowed us to customize greatly the LPGs.
More-
over, using a photochemical technique, we were su�ciently sure not to change the geometrical and optical characteristics of the �ber cladding and hence to avoid couplings to antisymmetric cladding modes. The main reason was that we wanted a transmission spectrum as clean as possible in order to avoid the interference problem of the loss peaks during measurements. Therefore, we had to use a photosensitive optical �ber. We used the BGe co-doped step-index single-mode Fibercore PS1250/1500 �ber, which is characterized by the following parameters
1:
refractive index of the �ber core (λ
refractive index of the �ber cladding (λ
=
1550 nm): 1.4508 RIU;
=
1550 nm): 1.4441 RIU;
1 Data available on line at the following website www.fibercore.com/LinkClick.aspx?
fileticket=DyYyL9DYexEid=506
6.4. Manufacturing of the gratings
211
numerical aperture (λ
diameter of the �ber core: 6.5
diameter of the �ber: 125.94
cut-o� wavelength: 1194 nm;
attenuation (λ
composition of the �ber core: pure fused silica (SiO2 ), germanium oxide
GeO2
=
=
1550 nm): 0.14;
µm;
µm;
1550 nm): 121.11 dB km
and boron oxide
B2 O3
−1 ;
in di�erent unknown percentage ratios;
composition of the �ber cladding: pure fused silica (SiO2 );
composition of the �ber jacket: acrylic polymer coating.
The Fibercore Company provided also the curve of the RI pro�le of the �ber used, which is reported in the �gure 6.5. The shown RI pro�le is the typical
Figure 6.5: Refractive index pro�le of B-Ge co-doped step-index single-mode Fibercore PS1250/1500 �ber
6. Experimental setup for refractive index measurements
212
RIP of a B-Ge co-doped step-index single-mode optical �ber, that is to say, it is characterized by a dip centered along the �ber axis (position of 0
µm).
This
characteristic shape results from the use of double doping with germanium and boron. It is worthy of noticing that the values along the y-axes, the refractive index di�erence on the left and the refractive index on the right, are the values at the wavelength of 653.7 nm (visible spectrum). The schematic of the manufacturing setup for FBGs is shown in �gure 6.6. The laser source used is the Lambda Physik Compex 110 excimer laser.
It
Figure 6.6: Schematic of the manufacturing setup for FBGs. SLD, superluminescent light diode
is a gas laser operating with a mixture of two gases, which do not bound chemically in normal condition. But if the two gases are appropriately excited, they bind to form a dimer (hence the term English
excimer
excited dimer, or rather excited dimers).
that comes from the
The mixtures used to obtain
6.4. Manufacturing of the gratings di�erent emission wavelengths are:
ArF
(193 nm), Krypton-Fluorine
nm) and Xenon-Fluorine
XeF
213
Fluorine
KrF
F2
(157 nm), Argon-Fluorine
(248 nm), Xenon-Chlorine
XeCl
(308
(351 nm). Since it was chosen for the gratings
manufacturing to use B-Ge co-doped step-index single-mode �bers, which have the maximum absorbance (see �gure 4.11) at a wavelength around 242 nm, we chose the KrF mixture. Here are the technical speci�cations of the KrF excimer laser:
peak wavelength: 248 nm;
maximum energy per pulse: 300 mJ;
maximum pulse repetition frequency: 100 Hz;
duration of pulses: 30 ns;
beam spot size: 24 x 10 mm ;
beam spot divergence: 3 mrad in vertical direction, 1mrad in horizontal
2
direction. The laser was set to operate at constant high-voltage mode (ie 21-24 kV) with a maximum value of energy per pulse of about 250 mJ. As can be also seen in the picture 6.7, which depicts our manufacturing setup for FBGs, the UV beam after undergoing a double re�ection in two mirrors passes through a square
2 and is focused by a cylindrical lens on the
slit of dimensions 10 x 10 mm
rectangular phase mask, which is �xed on a suitable aluminum framework. The photosensitive optical �ber, on which the grating will be inscribed, is placed behind the framework (see �gure 6.7). Before placing the �ber in the suitable framework in physical contact with the phase mask, it is necessary to remove the protective coating (or simply jacket) because is not transparent to UV light. The jacket removal, which has to be made only on the portion of the �ber where the grating will be formed (in our case, about 3 cm), is made manually with a special mechanical device or by immersing the �ber portion in trichlorethylene, which after a few minutes softens the jacket and allows us to remove it with a simple shift of the �ngers. The necessary condition to write a FBG e�ciently is the correct positioning of �ber with respect to the phase mask: the optical �ber must be perfectly in contact with the phase mask. To
214
6. Experimental setup for refractive index measurements
Figure 6.7: Photograph of our manufacturing setup for FBGs
make it easier, we have recourse to the use of a manual translation stage. One end of the �ber is initially blocked by means of a �xed clamping point on the framework, while the other end is blocked by means of a moving clamping point on a second framework above of which is placed the manual translation
6.4. Manufacturing of the gratings
215
stage. In order to satisfy the above-mentioned condition, the optical �ber has to be set at the right axial strain. This is obtained by means of the manual translation stage together with a force sensor, placed in physical contact with the manual translation stage itself, which measures the applied axial strain as a voltage value. At this point, the �ber is stretched by means of the manual translation stage, until it is behind the phase mask. When the force sensor gives a voltage value of about 10 mV, we are sure that the optical �ber is set at a su�cient axial strain to write the FBG e�ciently.
Therefore, the
uncoated portion of the �ber is perfectly placed in front of the phase mask and thus in contact with it. The �ber clamping points and the �ber positioning mechanism are shown in the photograph 6.8.
During the process of FBGs
inscription, the laser was set to operate at a pulse repetition frequency of 50 Hz. Furthermore, by varying the distance between the focusing lens and the phase mask is possible to change the intensity of radiation incident on the �ber. Typically, we used a distance of 11 cm in order to obtain a �uence per
−2 . We used a phase mask manufactured by Lasiris
pulse of about 450 mJ cm
Inc. and designed to work at a wavelength of 248 nm, which is characterized by a grating pitch period
Λpm
of 1059.9 nm that, in turn, corresponds to a grating
ΛF BG of about 530 nm.
The total time, which is used for writing a FBG
with re�ectivity of about 90%, is about 1 minute that, in turn, corresponds to a total number of about 3000 laser shots. The very short time for FBGs writing is certainly to be ascribed to the very high photosensitivity of the used optical �ber. All the manufacturing process of FBGs inscription is monitored in realtime by means of both an optical source and an optical spectrum analyzer (OSA). Remembering that a FBG can be also interrogated in re�ection mode as depicted in �gure 6.6, the FBG is interrogated in transmission mode because we are interested in the monitoring of the value of loss peak and hence of the FBG re�ectivity. In this way, we can know both the value of the resonance wavelength and the intensity of loss peak in every moment and hence we can stop the writing process when we want to do it. Otherwise, it is dif�cult to evaluate the loss peak and hence the re�ectivity. The used optical source is a broadband SLD-1550-DIP pigtailed. It is a superluminescent light emitting diode (LED), or rather superluminescent diode (SLD) manufactured
6. Experimental setup for refractive index measurements
216
Figure 6.8: Detail of the �ber clamping points and the �ber positioning mechanism of our manufacturing setup for FBGs
by Fermionics Lasertech, which has the following characteristics:
peak wavelength: 1550 nm;
bandwidth (FWHM): 44.4 nm;
maximum output optical power: 0.5 mW.
The used OSA is an Anritsu MS9030A/MS9701B. It is made up of two distinct units, the former is the control and display electronic unit (MS9030A),
6.4. Manufacturing of the gratings
217
whereas the latter is the optical unit (MS9701B). The most important component of the optical unit is certainly the monochromator, which is made up of a di�ractive optic component (D in �gure 6.9), that divides the di�erent spectral components of the incident radiation, and several mirrors (C and E in �gure 6.9), that carry on the light of interest wavelength to the photodetector. A schematic of a typical monochromator is shown in �gure 6.9. The used OSA
Figure 6.9: Schematic of a typical monochromator placed inside an optical spectrum analyzer for the spectral analysis of an optical signal has the following characteristics:
input wavelength range: 350 nm - 1750 nm;
input optical power range: -80 dBm - +10 dBm;
optical power accuracy:
maximum optical resolution: 0.1 nm.
±1.5
dB;
By using the same photosensitive Fibercore PS1250/1500 optical �ber, the same broadband optical source, the same OSA and the same KrF excimer
218
6. Experimental setup for refractive index measurements
laser previously described, we have to make some little changes to the FBGs manufacturing setup in order to write LPGs. Compared to the FBGs manufacturing setup depicted in �gure 6.6, the schematic of the manufacturing setup for LPGs includes both an adjustable micrometric slit to insert after the cylindrical lens and a di�erent framework for the optical �ber without any phase mask. In fact, we replace the framework used for FBGs clamping and positioning mechanism of the �ber (see �gure 6.8) with another framework speci�cally designed for LPGs clamping mechanism. This detail is shown in �gure 6.10. Moreover, the KrF excimer laser was set to operate at constant energy mode, namely, a value of energy per pulse of about 170 mJ. As for FBGs fabrication, the UV beam after undergoing a double re�ection in two mirrors passes through the same square slit and is focused by a cylindrical lens on the adjustable micrometric slit. Behind the micrometric slit, the photosensitive optical �ber is �xed on two clamping points placed on a bar of aluminum, which is connected to a computer-controlled motorized translation stage Burleigh 6000 (see �gure 6.10).
Both the motorized translation stage
and the laser action are controlled and synchronized by a personal computer with an ad hoc developed NI CVI program and a digital input/output board (Eagle period
µ-DAQ USB-96C), which makes it possible to choose ΛLP G and the number of laser shots for each step.
both the grating This is a point-
to-point technique because the optical �ber is moved of the desired period step-by-step. Thus the uncoated portion of the �ber is placed in front of the adjustable micrometric slit. The length of the micrometric slit is set to the half of the desired grating period in order to obtain a square wave modulation of the core RI with a duty cycle of 50%. The schematic of the manufacturing setup for LPGs is shown in �gure 6.11.
Referring to �gure 6.11, the UV laser
beam lights the optical �ber changing the core RI to a width of motorized translation stage is moved by a pitch equal to a grating with a period of
ΛLP G = Lb = 2 w.
2 w,
w.
Then the
thus obtaining
As for FBGs, the grating in-
scription is monitored throughout the writing process: one end of the �ber is connected to the broadband laser source and the transmission spectrum of the �ber is real-time displayed on the OSA. This methodology makes it possible to see step-by-step the formation of the grating attenuation bands in the desired wavelength range belonging to the input wavelength range of the
6.4. Manufacturing of the gratings
219
Figure 6.10: Detail of the �ber clamping points and the �ber positioning mechanism of our manufacturing setup for LPGs
OSA. During the process of LPGs inscription, the laser was set to operate at a pulse repetition frequency of 50 Hz. For LPGs, we used a distance between the focusing cylindrical lens and the optical �ber of 9 cm in order to obtain a
−2 . We set the length of the micrometric
�uence per pulse of about 300 mJ cm slit at a value of about 307.5 riod
ΛLP G
of about 615
µm.
µm
that, in turn, corresponds to a grating pe-
The total time, which is used for writing a LPG
with a transmission value of the loss peak of about -15 dB and a length of
6. Experimental setup for refractive index measurements
220
Figure 6.11: Detail of the schematic of the manufacturing setup for LPGs
about 2.46 cm, is about 20 minutes. We set 1500 laser shots for each step and, considering a total number of 40 grating planes, we achieve a total number of laser shots of about 60000. It is worthy of noting that the value of �uence is lower than that reported in table 4.1, regarding the same technique at the same wavelength (λ
= 248 nm),
due to the higher photosensitivity of the used
optical �ber. An advantage of this method with respect to non-UV method is that gratings show changes in the refractive index of the �ber core only. In fact, the �ber cladding, made up of of
SiO2 ,
is not sensitive to the UV wavelength of
the laser source and, most of all, the �ber itself does not undergo a geometric and/or structural deformation as can be seen in �gure 6.12. In order to prove the feasibility and e�ectiveness of the developed manufacturing system of LPGs, two di�erent tests have been performed and the
6.4. Manufacturing of the gratings
221
Figure 6.12: Photograph taken with transmission optic microscope Nikon Optiphot of a LPG written by means of the point-to-point technique with KrF excimer laser
�nal comparison is shown. The tests included the real-time recording of the �ber transmission spectrum by means of an OSA during the manufacture of the LPG and hence the real-time monitoring of the LPG attenuation bands in the wavelength range of interest from 1450 nm to 1650 nm. In both tests, we used the above-mentioned point-to-point technique with the grating period �xed at a value of 615
µm,
whereas the optical resolution of the used OSA
was set at a value of 0.5 nm. In the �rst test, the length of the grating was set at 30.75 mm, thus the number of steps was 50. The test was to perform multiple scans along the entire length of the grating for a total number of scans of 22. Moreover, the laser shots for each step was set at 100, except for the last two scans in which the value was 250. Therefore, the total number of laser shots was about 125000. Figure 6.13 shows the recorded transmission spectra of the manufactured LPG at di�erent scans. All the spectra have been
222
6. Experimental setup for refractive index measurements
normalized with respect to the source spectrum (not shown).
In the �gure,
Figure 6.13: Transmission spectra of the manufactured LPG at di�erent scans. Each curve is labeled with a di�erent color (see the label in the graph)
two distinct attenuation bands can be observed, the former around 1500 nm and the latter beyond 1550 nm. The �rst attenuation band is characterized by a resonance wavelength of 1507.6 nm and a transmission value of -12.65 dB that were obtained during the last laser scan (black curve). The second attenuation band is characterized by a resonance wavelength of 1565.2 nm and a transmission value of -22.66 dB that were obtained during the twelfth
6.4. Manufacturing of the gratings
223
laser scan (violet curve). It is clear that the second attenuation band reaches its maximum transmission value, or rather its maximum coupling e�ciency at the twelfth laser scan and follows a rapid decrease after this condition, as expected from the theory. On the contrary, the �rst attenuation band does not reach its maximum coupling e�ciency. Remembering equations (3.78) and (3.79), both the maximum transmission value and coupling e�ciency depend on the grating length and the coupling factor of the cladding mode. In this test, the grating length was kept at a �xed value, thus the trend showed in the �gure is explained by means of a change of the coupling factor of the cladding mode, which is di�erent for each mode. Because the test have been performed by means of multiple scans, the change in the induced-RI of the �ber core
DC
spatially averaged over the grating length (ncore ) is surely the main contribution to the shift of the LPG resonance wavelength showed in �gure 6.13 (see section 4.1). This value, in turn, a�ects the induced modulation of the �ber core RI (∆ncore ) that increases during each scan. In general, both the shift of the LPG resonance wavelength and the variation of the transmission value during the manufacturing process are explained by an increase of
∆ncore ,
as
discussed in section 4.1. In the second test, instead, the length of the grating was variable, thus the number of steps is variable too. The test was to perform a single scans increasing the grating length at each step. The value of these steps was equal to the grating period for a total number of steps of 95, which in turn corresponds to a grating length of 58.425 mm. Moreover, the number of laser shots for each step has been increased up to 1500. Figure 6.14 shows the recorded transmission spectra of the manufactured LPG at di�erent steps. As before, all the spectra have been normalized with respect to the source spectrum.
In the �gure,
we have taken into account the two attenuation bands that are relate to the same two cladding modes. The �rst attenuation band is now characterized by a resonance wavelength of 1499.6 nm and a transmission value of -17.84 dB that were obtained in the 65−th step, or rather for a grating length of 39.975 mm (violet curve). The second attenuation band is now characterized by a resonance wavelength of 1570 nm and a transmission value of -20.77 dB that were obtained in the 45−th step, or rather for a grating length of 27.675 mm (red curve). Moreover, the �rst attenuation band, which is related to a lower
224
6. Experimental setup for refractive index measurements
Figure 6.14: Transmission spectra of the manufactured LPG at di�erent steps. Each curve is labeled with a di�erent color (see the label in the graph)
order cladding mode than the second attenuation band, reaches its maximum transmission value (or the maximum coupling e�ciency) for a grating length greater than the second attenuation band, as expected from the theory. Therefore, it is clear that the second attenuation band at its maximum transmission value (or at its maximum coupling e�ciency) is achieved with a total number of laser shots (67500) lower than the �rst attenuation band at its maximum transmission value (97500). On the contrary, in this second measure, the shift
6.4. Manufacturing of the gratings
225
of the LPG resonance wavelength is not clearly visible, whereas the maximum transmission value follows the same previously-discussed trend. This means that, when the grating length is a variable parameter, the maximum coupling e�ciency follows the same above-mentioned laws, whereas the simultaneous variation of both
nDC core
AC
and the induced-RI modulation of the �ber core (ncore )
produces a not-so-appreciable change of the resonance wavelength. In fact, the term
nAC core
depends strongly on the length of the grating, as detailed in equa-
tion (3.39). In any case, the main contribution to the grating inscription is related to an average change of
∆ncore
that increases during each incremental
step (see again section 4.1). In order to give a sensible comparison between the two distinct approaches, it is obvious that the manufactured LPGs must have the same parameters, such as the length of the grating (and thus the number of steps) and the total number of laser shots for each steps (and thus the total number of laser shots). In this way, the value of
∆ncore
will be the same.
To do this, we �xed the
following grating parameters:
grating period: 615
grating length: 30.75 mm;
total number of steps: 50;
total number of laser shots: 75000.
µm;
This means that the �rst approach has been characterized by 15 scans of 100 laser shots for each step, whereas the second approach by a one scan of 1500 laser shots for each step. �rst test as
shots.
For the sake of simplicity, we refer to the
many scans-few shots, whereas the second test as one scan-many
The results are detailed in �gure 6.15.
Figure 6.15 shows the obtained
transmission spectra by means of the two distinct manufacturing processes. As regards the �rst attenuation band, the obtained results are the following:
di�erence of the resonance wavelength: 1.2 nm;
di�erence of the transmission value: -0.43 dB.
As regards the second attenuation band, we obtained:
6. Experimental setup for refractive index measurements
226
Figure 6.15: Comparison between the two distinct manufacturing approaches. The red curve refers to the �rst approach (many scans-few shots), whereas the blue curve refers to the second approach (one scan-many shots)
di�erence of the resonance wavelength: 0.4 nm;
di�erence of the transmission value: 2.2 dB.
As can be seen, the small di�erence in these two parameter for both the attenuation bands proves the quality and feasibility of the developed manufacturing system of OFGs.
6.4. Manufacturing of the gratings
227
As above-mentioned, we developed a hybrid cascaded con�guration of OFGs made up of a LPG in series with a FBG [26].
By using the two
previously-described manufacturing techniques about the two di�erent gratings, we obtain the transmission spectrum of the �ber measured by means of the same OSA used during the gratings fabrication. The fabrication parameters used for the two gratings are the following:
Fiber Bragg grating
�
grating period
ΛFBG :
�
grating length
L:
529.95 nm;
1 cm.
Long period grating
�
grating period
�
number of grating planes: 40;
�
grating length
ΛLPG : L:
615
µm;
2.46 cm.
The transmission spectrum of the �ber is shown in �gure 6.16. It is worthy of noticing that transmission spectrum of the �ber has been normalized with respect to the source spectrum. From the transmission spectrum showed in �gure 6.16, some interesting optical parameters about the two gratings can be achieved:
Fiber Bragg grating
λFBG res :
�
resonance wavelength
�
e�ective RI of �ber core
�
bandwidth (FWHM): 0.26 nm;
�
transmission: about -10 dB;
�
re�ectivity
R:
1534.2 nm;
ne� core :
1.4475 RIU (see equation (2.7));
about 90%.
Long period grating
λLPG res (p) :
�
resonance wavelength
�
order of coupled cladding mode
1567 nm;
p:
7 (see �gure 3.9);
6. Experimental setup for refractive index measurements
228
Figure 6.16: Transmission spectrum of the �ber with the FBG loss peak on the left and the LPG loss peak on the right. The green-highlighted distance between the two resonance bands is about 33 nm
�
bandwidth (FWHM): 6.5 nm;
�
transmission: about -15 dB.
The LPG optical parameters can also be prior estimated by means of the theoretical phase-matching curves, once the grating period has been chosen. Therefore, using the curves depicted in �gure 3.9, the red line takes into account the selected grating period (ie 615
µm) and intersects �ve curves that
are related to �ve di�erent PMCs of the cladding modes. Among these curves, the one whose value of the resonance wavelength (ie about 1570 nm) belongs to the wavelength range of the used optical source, is that corresponds to the fourth cladding mode (p
=
7) as highlighted by the green line.
Thus,
�gure 6.17 demonstrated the feasibility and accuracy of the proposed manu-
6.4. Manufacturing of the gratings
229
Figure 6.17: Theoretical prediction of the LPG optical parameters
facturing technique of LPGs. Moreover, it is very important to note that the proposed grating manufacturing setup makes it possible to avoid any pre- and post-manufacturing operation, for example hydrogen loading of the �ber, grating annealing, or more because of the high photosensitivity of the used optical �ber. Finally, a key point of the properties of the transmission spectrum of the �ber is given by the fact that the attenuation bands of both the FBG and LPG must be su�ciently separated, in order to avoid any interference problem during the RI measurements, assuming a decreasing of the LPG resonance wavelength, or rather a blueshift of the LPG resonance wavelength up to about 20 nm following a RI increase as it is reasonable to expect [27].
The achievement
of the FBG and LPG resonance wavelengths centered at 1534.2 nm and 1567 nm, respectively, assure that this point is satis�ed (see �gure 6.16).
6. Experimental setup for refractive index measurements
230
6.5 Interrogation system and data processing
T
o complete the description of the experimental setup, the last part pertains to the system for both the grating interrogation and processing of
the data. In particular, the section that concerns the data processing, which is a key feature in the case of wavelength-based measurement, was totally designed and developed during my research. The optical �ber containing the gratings is �rstly spliced and then connectorized on both ends with FC/PC connectors. A broadband superluminescent diode (SLD, INPHENIX IPSDD1503) is used as the optical source and the transmission spectrum of the �ber in the wavelength range of interest of both the FBG and LPG attenuation bands is recorded by means of an optical spectrum analyzer (OSA) with an optical resolution of 0.1 nm (Anritsu MS9030A and MS9701B). The OSA is connected to the computer via a GPIB interface and is controlled by means of an ad hoc developed NI CVI program. In order to measure the shift of the resonance wavelength of both the gratings, the developed software routine for each measurement step, �rst for the LPG and then for the FBG, performs the following steps:
it centers at the corresponding resonance wavelength that is 1533−1534 nm for the FBG and 15601570 nm for the LPG;
it �xes the wavelength range of interest, or rather the the
λ−span
that
is 2 nm for the FBG and 20 nm for the LPG;
it records the transmission spectrum of the �ber;
it extrapolates and saves the minimum value of the resonance wavelength by means of a suitable data �tting.
The total acquisition time of each measurement step is about 23 s.
This
not-so-small value could be represent a constraint in the case of biochemical sensing, where the dynamics of the reaction are usually very quick (tens of seconds). Therefore, this feature is certainly an issue to solve in the future. In order to obtain the best performance in terms of �tting goodness, two di�erent �tting functions for the attenuation bands of the two gratings were used: a
Lorentzian �tting function hLor (λ) for the LPG and a Gaussian �tting
function
hGau (λ)
for the FBG. Their expressions are the following:
6.5. Interrogation system and data processing hLor (λ) = a0 +
231
a1 (λ − a2 )2 + a23
(λ − a2 )2 2 a23 hGau (λ) = a0 + a1 e
for LPGs
(6.3)
for FBGs
(6.4)
−
where
aj
(for
j = 0, 1, 2, 3)
are the four �tting parameters. It is worth notic-
ing that the �tting parameter
a2
corresponding grating, ie
or
λLPG res
is simply the resonance wavelength of the
λFBG res .
At the beginning, the initial value of
the four �tting parameters must be entered, or rather the starting conditions must be speci�ed into the developed program. Therefore, we found the initial values of the �tting parameters, which are di�erent between the two gratings, and these values are gathered in table 6.1.
Table 6.1: Used initial values of the �tting parameters of the two gratings.
a0
a1
a2
a3
LPG
-3.53
-296
1576.28
31.5
FBG
-28.3
-10
1533.16
-200
For the sake of completeness, �gure 6.18 shows the front panel of the developed NI CVI program.
It consists of some indicators, controls and graphs.
First of all, we have to enter the �tting parameters for both the gratings. Then we can chosen the
λ−span,
the optical resolution of the OSA and the
number of averages for each measurement step. Lastly, it is possible to start the continuous recording of the transmission spectrum of both the gratings by pushing the green button �saving�. At this stage, following the above-discussed software routine, the two upper graphs account for the transmission spectrum of both the gratings (FBG on the left and LPG on the right) in the selected wavelength range. The yellow curves are the acquired raw data, whereas the
232
6. Experimental setup for refractive index measurements
Figure 6.18: Front panel of the developed NI CVI program for the real time monitoring of the attenuation bands of the two gratings
green curves are the corresponding �tting curves of FBG and LPG (see equations (6.4) and (6.3)).
By glancing at these two graphs, it can clearly be
observed that the two �tting functions work properly. The two graphs at the bottom account for the time evolution of the resonance wavelength of both the gratings (FBG on the left and LPG on the right, again), which is simply
6.6. Fluidics system and chemicals the plot of the �tting parameter
233
a2 ,
as explained previously. In this way, it
is possible to see in real-time the changes of both the resonance wavelengths. Moreover, at the top right of �gure 6.18, the last four numbers in the box give the measured value of temperature of the �ow cell. This last value together with the resonance wavelengths of FBG and LPG are saved into a single text �le (.txt), which is used for further post-processing of the data. Finally, the experimental setup consists also of a peristaltic pump (Gilson MINIPULS 3). The �ow cell is connected to the peristaltic pump by means of F117938 polyvinyl chloride (PVC) tubing (internal diameter: 1.02 mm), which makes it possible to pump the appropriate solution into the �ow cell. The peristaltic pump allows us to vary the �ow rate at the desired value. So the description of each device that belongs to the entire experimental setup for refractive index measurements has been completed.
Figure 6.19 shows
a comprehensive block diagram of the developed experimental setup for RI measurements.
6.6 Fluidics system and chemicals n order to characterized the proposed RI sensor, the solutions at di�erent
I
refractive indices were prepared by mixing glycerol (RPE-ACS Carlo Erba
AnalytiCals®) and water in di�erent volumetric ratios. The RI changed from the 1.334 RIU of pure distilled water up to 1.467 RIU of the last test solution. The RI of each solution has been measured prior by means of a hand−held refractometer (Atago R-5000) which works at the sodium D line (nD or
λ=
−3 refractive index unit (RIU). During 589.29 nm) with a resolution of 10 these measurements, the room temperature was monitored and kept constant at 23.0
±0.1.
During the refractive index measurements, the �ow rate of
−1 .
the liquid pumped into the �ow cell is kept constant at 0.5 mL min
The protocol followed for measuring the resonance wavelengths of the two gratings in the di�erent solutions is summarized here as follows:
�ow rate of about 0.5 mL min
halting of the peristaltic pump and acquisition of FBG and LPG minima
−1 for approximately 4 min;
extrapolated by the properly data �tting functions for about 10 min.
234
6. Experimental setup for refractive index measurements
Figure 6.19: Comprehensive block diagram of the refractive index measurements
It is worth observing that the value of the �ow rate, when the liquids were pumped into the �ow cell, was greater than that discussed above as long as the �ow channel was completely �lled with the investigated sample. In this way, it has been reduced to a minimum the problem of air bubbles that were formed along the �ow channel.
Chapter 7
Compensated refractive index measurement for mixtures It is a miracle that curiosity survives formal education. Albert Einstein
the measurement of the RI of di�erent glycerolwater mixtures is reported in order to both con�rm the correct functioning and obtain the metrological parameters of the proposed system, including the RI sensitivity and resolution
7.1 Characterization of the sensor's cross-sensitivities 7.1.1 Strain characterization 7.1.2 Temperature characterization 7.1.3 Long-term stability of the sensor
7.2 Refractive index measurement (Sensorgram) (Response curve) (Sensitivity and Resolution)
Chapter 8
Preliminary biochemical measurement on antibody-antigen bioassay Knowledge is limited. Albert Einstein
8.1 An overview about antibody-antigen bioassay 8.2 Materials and methods 8.2.1 Reagents All the following chemicals were purchased from Sigma (Sigma-Aldrich S.r.l., Milan, Italy): ethanol (EtOH), bovine serum albumin (BSA), phosphatebu�ered saline (40 mM PBS, pH 7.4).
The methacrylic acid/methacrylate
copolymer (Eudragit L100) was purchased from Degussa, Röhm Pharma Polymers, Evonik Degussa GmbH, Düsseldorf, Germany.
The mouse IgG, goat
anti-mouse IgG and Cy5-labelled goat anti-mouse-IgG were purchased from Zymed Laboratories, Invitrogen Immunodetection, Milan, Italy. 1-Ethyl-3-[3dimethylaminopropyl] carbodiimide hydrochloride (EDC) and N-hydroxysuccinimide (NHS) were purchased from Pierce, Rockford, Illinois, USA. Mouse monoclonal antibody, anti-PSA (prostate-speci�c antigen), clone A67-B/E3, was kindly furnished by EXBIO Praha, Czech Republic.
8.2.2 Chemical treatment of the sensor and immunoassay LPG surfaces were functionalized by immersion in 2 mM Eudragit L100 in ethanol for 1 minute and then waiting about 15 minutes in air, until the complete solvent evaporation occurred. The polymeric deposition gives carboxylic
8. Preliminary biochemical measurement on antibody-antigen bioassay
238
functional groups (-COOH) to the surfaces, useful for antibody immobilization. Once the LPGs were functionalized, �bers were collocated into the �ow cell and all the following steps were performed in �uidic condition at di�er-
−1 for cross-linkers activation with EDC+NHS, −1 surface passivation with BSA and all the washings in PBS, and 25 µL min
ent �ow rate of 250
µL
min
for mouse IgG antibody, anti-PSA antibody and all the concentration of goat anti-mouse IgG antigen. The activation of -COOH groups was carried out by means of EDC (2 mM) and NHS (5 mM) for 30 minutes. Immediately after, 1 mg L
−1 mouse IgG in PBS was used for covalent immobilization of antibodies
on the LPG. After 1 hour a washing step with PBS bu�er was performed. The surface passivation was carried out with 3% BSA in PBS for 15 minutes. The speci�city of the sensor was tested introducing in the �ow cell a solution of
−1 of anti-PSA antibody (a non-speci�c antigen for
PBS containing 10 mg L
the immobilized antibody). Immunoassays were then performed with di�erent concentrations of goat anti-mouse IgG (from 0.1 mg L
−1 to 500 mg L−1 )
following the developed protocol, with 15 minutes of incubation time for the antigen and 5 minutes for PBS washing step. In order to demonstrate the e�cacy of the novel functionalization chemistry using Eudragit L100 besides the commonly used silanization procedure [189], 1 mg L
−1 mouse IgG in PBS was
let �ow directly on the LPG without any previous treatment. The established immunoassay protocol was then performed using 10 mg L
−1 goat anti-mouse
IgG in PBS as antigen solution. Although the LPGs are used for label-free applications, an immunoassay using labeled goat anti-mouse IgG was performed in order to verify the antibody/antigen interaction occurred along the �ber.
The immobilization of
mouse IgG was obtained using the previously described protocol and 10 mg
−1 goat anti-mouse IgG labeled with Cy5, in PBS bu�er, was let �ow for 15
L
minutes. After a washing step of 5 minutes in PBS a �uorescence intensity measurement was performed.
8.3 Biochemical measurement on an antibody-antigen bioassay (Sensorgram) (Response curve) (Sensitivity and LOD)
Part III
Conclusions
Chapter 9
Conclusions
Anyone who has never made a mistake has never tried anything new. Albert Einstein
9.1 Summary and contributions 9.2 Tracks for future works
Bibliography
[1] K. Hill and G. Meltz, �Fiber bragg grating technology fundamentals and overview,� J. Lightwave Technol., vol. 15, no. 8, pp. 1263 � 1276, aug 1997. [Online]. Available: http://ieeexplore.ieee.org/xpl/freeabs_all.jsp?arnumber= 618320 xiii, 88, 89, 100, 141, 142, 144, 145, 146, 166, 168 [2] G.
Meltz,
gratings
Lett.,
in
vol.
W.
W.
optical 14,
no.
Morey, �bers 15,
and by
pp.
W.
a
H.
Glenn,
transverse
823�825,
�Formation
holographic
Aug
1989.
of
bragg
method,�
[Online].
Opt.
Available:
http://ol.osa.org/abstract.cfm?URI=ol-14-15-823 xiii, 91, 92, 96 [3] Y.
J.
Rao,
Technology,
�In-�bre
bragg
vol.
no.
8,
grating
4,
pp.
sensors,� 355�375,
http://iopscience.iop.org/0957-0233/8/4/002
Measurement 1997.
Science
[Online].
and
Available:
xiii, 93, 95, 99, 139, 140, 142,
144, 146 [4] D. N. Nikogosyan, �Long-period gratings in a standard telecom �bre fabricated by high-intensity femtosecond uv and near-uv laser pulses,�
Measurement
Science and Technology, vol. 17, no. 5, p. 960, 2006. [Online]. Available: http://stacks.iop.org/0957-0233/17/i=5/a=S04 xiv, 101, 102, 109, 110, 113 [5] A.
M.
Vengsarkar,
J.
R.
Pedrazzani,
J.
B.
Judkins,
P.
J.
Lemaire,
N. S. Bergano, and C. R. Davidson, �Long-period �ber-grating-based gain equalizers,�
Opt. Lett., vol. 21, no. 5, pp. 336�338, Mar 1996. [Online].
Available: http://ol.osa.org/abstract.cfm?URI=ol-21-5-336 xiv, xvi, 100, 104, 106, 170 [6] E. M. Dianov, D. S. Stardubov, S. A. Vasiliev, A. A. Frolov, and O. I. Medvedkov, �Refractive-index gratings written by near-ultraviolet radiation,�
Opt. Lett.,
vol.
22,
no.
4,
pp.
221�223,
Feb
1997.
[Online].
http://ol.osa.org/abstract.cfm?URI=ol-22-4-221 xiv, 107, 108, 109
Available:
244
BIBLIOGRAPHY
[7] Y. Kondo, K. Nouchi, T. Mitsuyu, M. Watanabe, P. G. Kazansky, and K. Hirao, �Fabrication of long-period �ber gratings by focused irradiation of infrared femtosecond laser pulses,� Opt. Lett., vol. 24, no. 10, pp. 646�648, May 1999. [Online]. Available:
http://ol.osa.org/abstract.cfm?URI=ol-24-10-646
xiv, 114, 115, 117 [8] D. Davis, T. Gaylord, E. Glytsis, S. Kosinski, S. Mettler, and A. Vengsarkar, �Long-period
�bre
grating
fabrication
with
focused
co2
laser
pulses,�
Electronics Letters, vol. 34, no. 3, pp. 302 � 303, feb 1998. [Online]. Available: http://ieeexplore.ieee.org/xpl/freeabs_all.jsp?arnumber=677395 xiv, 118, 119 [9] M. I. Braiwish, B. L. Bachim, and T. K. Gaylord, �Prototype co2 laser-induced long-period �ber grating variable optical attenuators and optical tunable
Appl. Opt.,
�lters,�
vol. 43,
no. 9,
pp. 1789�1793,
Mar 2004. [Online].
Available: http://ao.osa.org/abstract.cfm?URI=ao-43-9-1789 xiv, 119, 120 [10] G. Rego, O. Okhotnikov, E. Dianov, and V. Sulimov, �High-temperature stability of long-period �ber gratings produced using an electric arc,�
J.
Lightwave Technol., vol. 19, no. 10, pp. 1574 � 1579, Oct 2001. [Online]. Available:
http://ieeexplore.ieee.org/xpl/freeabs_all.jsp?arnumber=956145
xiv, xv, 114, 122, 123, 124, 125 [11] O. V. Ivanov and G. Rego, �Origin of coupling to antisymmetric modes in
Opt. Express, vol. 15, no. 21, pp.
arc-induced long-period �ber gratings,�
13 936�13 941, Oct 2007. [Online]. Available:
http://www.opticsexpress.org/
abstract.cfm?URI=oe-15-21-13936 xv, 125, 126, 127, 129, 147 [12] M. of
Fujimaki, long-period
Lett.,
vol.
Y.
Ohki,
optical
25,
no.
2,
J.
�ber pp.
L.
Brebner,
gratings 88�89,
by
Jan
and use
2000.
S.
of
Roorda,
ion
�Fabrication
implantation,�
[Online].
Available:
Opt. http:
//ol.osa.org/abstract.cfm?URI=ol-25-2-88 xv, 130, 131, 132, 133 [13] S. Savin, M. F. Digonnet, G. S. Kino, and H. J. Shaw, �Tunable mechanically induced long-period �ber gratings,� Opt. Lett., vol. 25, no. 10, pp. 710�712, May 2000. [Online]. Available:
http://ol.osa.org/abstract.cfm?URI=ol-25-10-710
xv, 133, 134, 136 [14] V. Bhatia, �Applications of long-period gratings to single andmulti-parameter sensing,�
Opt. Express, vol. 4, no. 11, pp. 457�466, May 1999. [Online].
Available: http://www.opticsexpress.org/abstract.cfm?URI=oe-4-11-457 xvi, 3, 140, 147, 153, 154, 155, 157, 158, 159, 160, 161, 162, 173, 174, 176 [15] S.
Khaliq,
S.
W.
James,
and
R.
P.
Tatam,
�bre optic long period grating temperature sensor,�
�Enhanced
sensitivity
Measurement Science
BIBLIOGRAPHY
and
245
Technology,
vol.
13,
no.
5,
p.
792,
2002.
[Online].
Available:
http://stacks.iop.org/0957-0233/13/5/318 xvi, 159, 162, 163, 172 [16] S.
W.
James
sensors:
and
R.
P.
characteristics
Technology,
vol.
14,
Tatam,
and
no.
5,
�Optical
pp.
R49
�
�bre
long-period
Measurement
application,�
R61,
2003.
grating
Science
[Online].
and
Available:
http://m.iopscience.iop.org/0957-0233/14/5/201 xvi, 147, 155, 156, 164, 171, 180, 201 [17] F. Baldini, M. Brenci, F. Chiavaioli, A. Giannetti, and C. Trono, �Optical �bre gratings as tools for chemical and biochemical sensing,� Analytical and
Bioanalytical Chemistry, vol. 402, pp. 109�116, 2012, 10.1007/s00216-0115492-3. [Online]. Available: http://dx.doi.org/10.1007/s00216-011-5492-3 xvi, 140, 162, 177 [18] Z. Wang, J. He�in, R. Stolen, and S. Ramachandran, �Analysis of optical response of long period �ber gratings to nm-thick thin-�lm coating,� Opt.
Express,
vol.
13,
no.
8,
pp.
2808�2813,
Apr
2005.
[Online].
Available:
http://www.opticsexpress.org/abstract.cfm?URI=oe-13-8-2808 xvi, 180, 196 [19] N. D. Rees,
S. W. James,
R. P. Tatam,
and G. J. Ashwell,
�Optical
�bre long-period gratings with langmuir-blodgett thin-�lm overlays,�
Lett.,
vol.
27,
no.
9,
pp.
686�688,
May
2002.
[Online].
Opt.
Available:
http://ol.osa.org/abstract.cfm?URI=ol-27-9-686 xvii, 180, 181, 182, 183, 196, 197 [20] I. of
D.
Villar,
I.
Matías,
sensitivity
in
long
Opt. Express,
vol.
13,
F.
Arregui,
period no.
1,
�ber pp.
and
P.
gratings
56�69,
Jan
Lalanne,
with 2005.
�Optimization
overlay
deposition,�
[Online].
http://www.opticsexpress.org/abstract.cfm?URI=oe-13-1-56
Available:
xvii, 180, 184,
185, 187, 188, 189, 190 [21] S. W. James and R. P. Tatam, �Fibre optic sensors with nano-structured coatings,� Journal of Optics A: Pure and Applied Optics, vol. 8, no. 7, p. S430, 2006. [Online]. Available: http://stacks.iop.org/1464-4258/8/i=7/a=S19 xvii, 180, 181, 186 [22] I. D. Villar, I. R. Matias, and F. J. Arregui, �Long-period �ber gratings with
overlay
IEEE,
vol.
of variable 17,
no.
9,
refractive pp.
index,�
1893�1895,
Photonics Technology Letters,
sept.
2005.
[Online].
http://ieeexplore.ieee.org/xpl/freeabs_all.jsp?arnumber=1498894 184, 187, 188
Available: xvii, 180,
246
BIBLIOGRAPHY
[23] M.
Mascini
and
Tombelli,
Biomarkers,
diagnostics,� 19061054.
S.
[Online].
vol.
�Biosensors 13,
Available:
no.
7-8,
for
biomarkers
pp.
637�657,
in
medical
2008,
pMID:
http://informahealthcare.com/doi/abs/10.
1080/13547500802645905 xvii, 192 [24] A. Pasic, H. Koehler, I. Klimant, and L. Schaupp, �Miniaturized �ber-optic hybrid sensor for continuous glucose monitoring in subcutaneous tissue,�
Sensors
and
Actuators
B:
2007. [Online]. Available:
Chemical,
vol.
122,
no.
1,
pp.
60
�
68,
http://www.sciencedirect.com/science/article/pii/
S0925400506003844 xvii, 192, 193 [25] J. Pollet, F. Delport, K. Janssen, D. Tran, J. Wouters, T. Verbiest, and J. Lammertyn, �Fast and accurate peanut allergen detection with nanobead enhanced optical �ber spr biosensor,� Talanta, vol. 83, no. 5, pp. 1436 � 1441, 2011. [Online]. Available:
http://www.sciencedirect.com/science/article/pii/
S0039914010009094 xvii, 194, 195 [26] C. Trono, F. Baldini, M. Brenci, F. Chiavaioli, and M. Mugnaini, �Flow cell for strain- and temperature-compensated refractive index measurements by means of cascaded optical �bre long period and bragg gratings,� Measurement
Science and Technology, vol. 22, no. 7, p. 075204, 2011. [Online]. Available: http://stacks.iop.org/0957-0233/22/i=7/a=075204 xvii, 5, 160, 178, 202, 205, 206, 227 [27] H.
J.
Patrick,
A.
D.
Kersey,
and
F.
Bucholtz,
�Analysis
of
response of long period �ber gratings to external index of refraction,�
the
J.
Lightwave Technol., vol. 16, no. 9, p. 1606, Sep 1998. [Online]. Available: http://jlt.osa.org/abstract.cfm?URI=jlt-16-9-1606 1, 2, 4, 148, 160, 162, 164, 173, 179, 201, 229 [28] R. Falciai, A. Mignani, and A. Vannini, �Long period gratings as solution concentration sensors,� Sensors and Actuators B: Chemical, vol. 74, no. 1-3, pp. 74 � 77, 2001, Proceedings of the 5th European Conference on Optical Chemical Sensors and Biosensors. [Online]. Available: http: //www.sciencedirect.com/science/article/pii/S0925400500007140
1, 4, 165,
173 [29] T.
Allsop,
L.
Zhang,
and
I.
Bennion,
�Detection
of
organic
aromatic
compounds in para�n by a long-period �ber grating optical sensor with optimized sensitivity,� Optics Communications, vol. 191, no. 3-6, pp. 181 � 190, 2001. [Online]. Available: http://www.sciencedirect.com/science/article/ pii/S0030401801011312 1, 4, 165, 173
BIBLIOGRAPHY
247
[30] M. Cooper, �Label-free screening of bio-molecular interactions,�
Analytical
and Bioanalytical Chemistry, vol. 377, pp. 834�842, 2003. [Online]. Available: http://dx.doi.org/10.1007/s00216-003-2111-y 1 [31] X. Fan, I. M. White, S. I. Shopova, H. Zhu, J. D. Suter, and Y. Sun, �Sensitive optical biosensors for unlabeled targets:
A review,�
Analytica
Chimica Acta, vol. 620, no. 1-2, pp. 8 � 26, 2008. [Online]. Available: http: //www.sciencedirect.com/science/article/pii/S0003267008009343 1, 2, 176 [32] J. Homola, �Surface plasmon resonance sensors for detection of chemical and biological species,� Chemical Reviews, vol. 108, no. 2, pp. 462�493, 2008, pMID: 18229953. [Online]. Available: http://pubs.acs.org/doi/abs/10.1021/cr068107d 1, 176 [33] G. Gauglitz, �Interferometry in bio- and chemosensing,� in Optical Chemical
Sensors, ser. NATO Science Series, F. Baldini, A. Chester, J. Homola, and S. Martellucci, Eds.
Springer Netherlands, 2006, vol. 224, pp. 217�237.
[Online]. Available: http://dx.doi.org/10.1007/1-4020-4611-1_11 2 [34] F. Vollmer and S. Arnold, �Whispering-gallery-mode biosensing:
label-free
detection down to single molecules,� Nat Meth, vol. 5, no. 7, pp. 591�596, 2008. [Online]. Available: http://dx.doi.org/10.1038/nmeth.1221 2 [35] I. M. White, sensors,�
H. Oveys,
and X. Fan,
�Liquid-core optical ring-resonator
Opt. Lett., vol. 31, no. 9, pp. 1319�1321, May 2006. [Online].
Available: http://ol.osa.org/abstract.cfm?URI=ol-31-9-1319 2 [36] T. Eftimov,
�Applications of �ber gratings in chemical and biochemical
sensing,� in Optical Guided-wave Chemical and Biosensors II, ser. Springer Series on Chemical Sensors and Biosensors, M. Zourob, A. Lakhtakia, and O. S. Wolfbeis, Eds.
Springer Berlin Heidelberg, 2010, vol. 8, pp. 151�176.
[Online]. Available: http://dx.doi.org/10.1007/978-3-642-02827-4_6 2, 176 [37] K. Grattan and T. Sun, �Fiber optic sensor technology: an overview,� Sensors
and Actuators A: Physical, vol. 82, no. 1-3, pp. 40 � 61, 2000. [Online]. Available: http://www.sciencedirect.com/science/article/pii/S0924424799003684 2 [38] C.
Chen,
C.
Caucheteur,
P.
Mégret,
and
J.
Albert,
�The
sensitivity
characteristics of tilted �bre bragg grating sensors with di�erent cladding thicknesses,� Measurement Science and Technology, vol. 18, no. 10, p. 3117, 2007. [Online]. Available: http://stacks.iop.org/0957-0233/18/i=10/a=S11 2, 178
248
BIBLIOGRAPHY
[39] A. Iadicicco, A. Cusano, A. Cutolo, R. Bernini, and M. Giordano, �Thinned �ber bragg gratings as high sensitivity refractive index sensor,� Photonics Tech-
nology Letters, IEEE, vol. 16, no. 4, pp. 1149�1151, april 2004. 2, 178 [40] P. Pilla, P. F. Manzillo, V. Malachovska, A. Buosciolo, S. Campopiano, A. Cutolo, L. Ambrosio, M. Giordano, and A. Cusano, �Long period grating working in transition mode as promising technological platform for label-free biosensing,� Opt. Express, vol. 17, no. 22, pp. 20 039�20 050, Oct 2009. [Online]. Available:
http://www.opticsexpress.org/abstract.cfm?URI=oe-17-22-20039
2, 165, 197, 201 [41] B. H. Lee, Y. Liu, S. B. Lee, S. S. Choi, and J. N. Jang, �Displacements of the resonant peaks of a long-period �ber grating induced by a change of ambient refractive index,� Opt. Lett., vol. 22, no. 23, pp. 1769�1771, Dec 1997. [Online]. Available: http://ol.osa.org/abstract.cfm?URI=ol-22-23-1769 2, 52, 164, 201 [42] J. H. Chong, Y.
Zhu,
P. Shum,
�Measurements
H. Haryono, of
A. Yohana,
refractive
index
M. Rao,
sensitivity
C. Lu,
using
and
long-period
grating refractometer,� Optics Communications, vol. 229, no. 1-6, pp. 65 � 69, 2004. [Online]. Available:
http://www.sciencedirect.com/science/article/
pii/S0030401803021710 2, 160, 201 [43] C. Jesus, P. Caldas, O. Frazão, J. L. Santos, P. A. S. Jorge, and J. M. Baptista, �Simultaneous measurement of refractive index and temperature using a hybrid �ber bragg grating/long-period �ber grating con�guration,�
Fiber and Integrated Optics, vol. 28, no. 6, pp. 440�449, 2009. [Online]. Available:
http://www.tandfonline.com/doi/abs/10.1080/01468030903290039
2, 3, 174, 201 [44] V. Bhatia, D. Campbell, R. O. Claus, and A. M. Vengsarkar, �Simultaneous strain
and
temperature
Lett.,
vol.
22,
no.
9,
measurement pp.
with
648�650,
long-period
May
1997.
gratings,�
[Online].
Opt.
Available:
http://ol.osa.org/abstract.cfm?URI=ol-22-9-648 3, 100, 105, 140, 174 [45] G. of
Barillaro,
S.
Merlo,
alcohol-in�ltrated
Lett.,
vol.
34,
no.
and
L.
M.
one-dimensional 12,
pp.
Strambini, silicon
1912�1914,
Jun
�Optical photonic 2009.
characterization crystals,�
[Online].
Opt.
Available:
http://ol.osa.org/abstract.cfm?URI=ol-34-12-1912 3 [46] W.
Liang,
sensitive
Lett.,
Y.
�ber
vol.
86,
Huang, bragg no.
Y.
Xu,
grating
15,
pp.
R.
K.
refractive
Lee,
and
index
151 122�151 124,
http://dx.doi.org/doi/10.1063/1.1904716 4, 173
A.
sensors,�
2005.
Yariv,
Appl.
[Online].
�Highly
Phys.
Available:
BIBLIOGRAPHY
[47] A. Cusano, �Thinned �bre
249
A. Iadicicco,
and
micro-structured
high-sensitivity
Applied
S. Campopiano,
Optics,
chemical
vol.
7,
�bre
bragg
sensors,�
no.
12,
M. Giordano, gratings:
and A. Cutolo,
towards
new
all-
Journal of Optics A: Pure and
p.
734,
2005.
[Online].
Available:
http://stacks.iop.org/1464-4258/7/i=12/a=005 4, 173 [48] Y. Y. Shevchenko and J. Albert, �Plasmon resonances in gold-coated tilted �ber bragg gratings,�
Opt. Lett., vol. 32, no. 3, pp. 211�213, Feb 2007.
[Online]. Available: http://ol.osa.org/abstract.cfm?URI=ol-32-3-211 4, 197 [49] S. Korposh, S.-W. Lee, S. W. James, and R. P. Tatam, �Refractive index sensitivity of �bre-optic long period gratings coated with sio 2 nanoparticle mesoporous thin �lms,� Measurement Science and Technology, vol. 22, no. 7, p. 075208, 2011. [Online]. Available: http://stacks.iop.org/0957-0233/22/i=7/ a=075208 4, 173 [50] X.
Shu
and
D.
Huang,
�Highly
sensitive
chemical
sensor
based
on
the
measurement of the separation of dual resonant peaks in a 100-µm-period �ber grating,�
Optics Communications,
1999. [Online]. Available:
vol. 171,
no. 1-3,
pp. 65 � 69,
http://www.sciencedirect.com/science/article/pii/
S0030401899005222 4, 165, 173 [51] S. K. A. K. Bey, C. C. C. Lam, T. Sun, and K. T. Grattan, �Chloride ion optical sensing using a long period grating pair,� Sensors and Actuators
A: Physical,
vol.
141,
no.
2,
pp.
390
�
395,
2008.
[Online].
Available:
http://www.sciencedirect.com/science/article/pii/S0924424707007406 4, 173 [52] J.-L. Tang and J.-N. Wang, �Measurement of chloride-ion concentration with long-period grating technology,�
Smart Materials and Structures, vol. 16,
no. 3, p. 665, 2007. [Online]. Available: http://stacks.iop.org/0964-1726/16/ i=3/a=013 4, 173 [53] Z. Gu and Y. Xu, �Design optimization of a long-period �ber grating with sol-gel coating for a gas sensor,� Measurement Science and Technology, vol. 18, no. 11, p. 3530, 2007. [Online]. Available: http://stacks.iop.org/0957-0233/18/ i=11/a=037 4 [54] J. M. Corres, I. del Villar, I. R. Matias, and F. J. Arregui, �Fiber-optic ph-sensors in long-period �ber gratings using electrostatic self-assembly,�
Opt.
Lett.,
vol.
32,
no.
1,
pp.
29�31,
Jan
http://ol.osa.org/abstract.cfm?URI=ol-32-1-29 4
2007.
[Online].
Available:
250
BIBLIOGRAPHY
[55] A. Cusano, A. Iadicicco, P. Pilla, L. Contessa, S. Campopiano, A. Cutolo, M. Giordano, and G. Guerra, �Coated long-period �ber gratings as highsensitivity optochemical sensors,� J. Lightwave Technol., vol. 24, no. 4, p. 1776,
Apr 2006. [Online]. Available:
http://jlt.osa.org/abstract.cfm?URI=
jlt-24-4-1776 4, 184 [56] R. R. J. Maier, B. J. S. Jones, J. S. Barton, S. McCulloch, T. Allsop, J. D. C. Jones, and I. Bennion, �Fibre optics in palladium-based hydrogen sensing,�
Journal of Optics A: Pure and Applied Optics, vol. 9, no. 6, p. S45, 2007. [Online]. Available: http://stacks.iop.org/1464-4258/9/i=6/a=S08 4 [57] X. Wei,
T. Wei,
H. Xiao,
and Y. Lin,
�Nano-structured pd-long period
�ber gratings integrated optical sensor for hydrogen detection,� Sensors and
Actuators B: Chemical, vol. 134, no. 2, pp. 687 � 693, 2008. [Online]. Available: http://www.sciencedirect.com/science/article/pii/S0925400508004188 4 [58] X. Tang, K. Remmel, X. Lan, J. Deng, H. Xiao, and J. Dong, �Perovskite-type oxide thin �lm integrated �ber optic sensor for high-temperature hydrogen measurement,� Analytical Chemistry, vol. 81, no. 18, pp. 7844�7848, 2009, pMID: 19681577. [Online]. Available:
http://pubs.acs.org/doi/abs/10.1021/
ac9012754 4 [59] J.
Barnes,
P.
R.
Loock,
grating
Brown,
�Chemical
interrogated
A.
Cheung,
sensing by
using
ring-down
M. a
Dreher,
polymer
G.
Mackey,
coated
spectroscopy,�
and
long-period
H.�ber
Sensors and Actuators
B: Chemical, vol. 148, no. 1, pp. 221 � 226, 2010. [Online]. Available: http://www.sciencedirect.com/science/article/pii/S0925400510003266 4 [60] Z. and
Wang, S.
J.
He�in,
Ghalmi,
adsorbed
Chemical,
on
K.
V.
�Biosensors
long-period
vol.
139,
no.
Cott,
�ber 2,
R.
employing
pp.
H.
gratings,� 618
Stolen,
ionic
�
Sensors
623,
S.
Ramachandran,
self-assembled
2009.
and
multilayers
Actuators
[Online].
B:
Available:
http://www.sciencedirect.com/science/article/pii/S0925400509002354 5 [61] Z. Wang and H. Xiao, �Optical intensity-based long-period �ber grating biosensors and biomedical applications [life sciences],� Signal Processing Magazine,
IEEE, vol. 26, no. 2, pp. 121 �122, 124�127, march 2009. 5 [62] M. M.
Smietana, Zourob,
W.
J.
Bock,
�Detection
of
P.
Mikulic,
bacteria
using
A.
Ng,
R.
Chinnappan,
bacteriophages
as
and
recognition
elements immobilized on long-period �ber gratings,� Opt. Express, vol. 19, no. 9, pp. 7971�7978, Apr 2011. [Online]. Available: http://www.opticsexpress. org/abstract.cfm?URI=oe-19-9-7971 5, 197
BIBLIOGRAPHY
251
[63] X. Chen, L. Zhang, K. Zhou, E. Davies, K. Sugden, I. Bennion, M. Hughes, and
A.
Hine,
�Real-time
detection
of
dna
interactions
with
long-period
�ber-grating-based biosensor,� Opt. Lett., vol. 32, no. 17, pp. 2541�2543, Sep 2007. [Online]. Available:
http://ol.osa.org/abstract.cfm?URI=ol-32-17-2541
5, 197 [64] A. V. Hine, X. Chen, M. D. Hughes, K. Zhou, E. Davies, K. Sugden, I. Bennion, and L. Zhang, �Optical �bre-based detection of dna hybridization,� Biochemical
Society Transactions, vol. 37, no. 2, pp. 445�449, April 2009. [Online]. Available: http://www.biochemsoctrans.org/bst/037/bst0370445.htm#CitedBy 5, 197 [65] M.
P.
DeLisa,
Sirkis,
and
grating vol.
W.
as
72,
Z.
an no.
Zhang,
E.
M.
Bentley,
immobilized 13,
pp.
Shiloach,
S.
Pilevar,
�Evanescent antibody
2895�2900,
wave
C.
Davis,
long-period
biosensor,� 2000.
C.
�ber
Analytical
[Online].
J.
S.
bragg
Chemistry,
Available:
http:
//pubs.acs.org/doi/abs/10.1021/ac9912395 5, 165, 176, 179, 196, 197 [66] J. Yang, P. Sandhu, W. Liang, C.-Q. Xu, and Y. Li, �Label-free �ber optic biosensors with enhanced sensitivity,� Selected Topics in Quantum Electronics,
IEEE Journal of, vol. 13, no. 6, pp. 1691 �1696, nov.-dec. 2007. 5, 197 [67] D. Kim, Y. Zhang, K. Cooper, and A. Wang, �Fibre-optic interferometric immuno-sensor using long period grating,� Electronics Letters, vol. 42, no. 6, pp. 324 � 325, march 2006. [Online]. Available: http://ieeexplore.ieee.org/xpl/ freeabs_all.jsp?arnumber=1610409 5, 197 [68] V. Mishra, N. Singh, U. Tiwari, and P. Kapur, �Fiber grating sensors in medicine:
Current and emerging applications,�
Sensors and Actuators A:
Physical, vol. 167, no. 2, pp. 279 � 290, 2011, Solid-State Sensors, Actuators
and
Microsystems
Workshop.
[Online].
Available:
http://www.sciencedirect.com/science/article/pii/S092442471100118X 5, 197 [69] Y.
Y.
�Dna
Shevchenko,
target
aqueous
D.
detection
media,�
in
A.
using
Blair,
M.
gold-coated
Conference
on
C.
Derosa,
tilted
Lasers
and
�ber
and bragg
J.
Albert,
gratings
in
Electro-Optics/Quantum
Electronics and Laser Science Conference and Photonic Applications Systems Technologies.
Optical Society of America, 2008, p. CMJ4. [Online]. Available:
http://www.opticsinfobase.org/abstract.cfm?URI=CLEO-2008-CMJ4 5, 197 [70] J.-L.
Tang,
S.-F.
Cheng,
W.-T.
Hsu,
T.-Y.
Chiang,
and
L.-K.
Chau,
�Fiber-optic biochemical sensing with a colloidal gold-modi�ed long period �ber grating,� Sensors and Actuators B: Chemical, vol. 119, no. 1, pp. 105 � 109, 2006. [Online]. Available: http://www.sciencedirect.com/science/article/ pii/S0925400505009445 5, 197
252
BIBLIOGRAPHY
[71] I. Andonovic and D. Uttamchandani, Principles of modern optical systems
vol.1.
Artech House INC, Norwood, MA 02062, 1989. 12
[72] K. O. Hill, Y. Fujii, D. C. Johnson, and B. S. Kawasaki, �Photosensitivity in optical �ber waveguides: Application to re�ection �lter fabrication,� Applied
Physics Letters,
vol. 32,
no. 10,
pp. 647�649,
1978. [Online]. Available:
http://link.aip.org/link/?APL/32/647/1 13, 88, 90, 133 [73] A.
Vengsarkar,
P.
Lemaire,
J.
Judkins,
V.
Bhatia,
T.
Erdogan,
and
J. Sipe, �Long-period �ber gratings as band-rejection �lters,� J. Lightwave
Technol.,
vol.
14,
no.
1,
pp.
58
�65,
jan
1996.
[Online].
http://ieeexplore.ieee.org/xpl/freeabs_all.jsp?arnumber=476137
Available:
15, 29, 153,
170, 202 [74] C. R. Doerr and H. Kogelnik, �Dielectric waveguide theory,� J. Lightwave
Technol.,
vol. 26,
no. 9,
pp. 1176�1187,
May 2008. [Online]. Available:
http://jlt.osa.org/abstract.cfm?URI=jlt-26-9-1176 16 [75] C.
Palmer
and
E.
Loewen,
Di�raction
Corporation, 2005. [Online]. Available:
grating
handbook.
Newport
http://books.google.com/books?id=
SWl-PAAACAAJ 16, 18 [76] T. Erdogan, �Fiber grating spectra,� J. Lightwave Technol., vol. 15, no. 8, pp. 1277 �1294, aug 1997. [Online]. Available: http://ieeexplore.ieee.org/xpl/ freeabs_all.jsp?arnumber=618322 20, 21, 58, 59, 62, 63, 64, 65, 86, 166 [77] M. Born and E. Wolf, Principles of Optics. [78] D. Marcuse, Light transmission optics.
New York: Pergamon, 1987. 20
New York: Van Nostrand Reinhold
Company, 1972. 27 [79] A. Snyder, �Asymptotic expressions for eigenfunctions and eigenvalues of a dielectric or optical waveguide,� Microwave Theory and Techniques, IEEE Trans-
actions on, vol. 17, no. 12, pp. 1130 � 1138, dec 1969. 27 [80] D.
Gloge,
2252�2258,
�Weakly
guiding
�bers,�
Appl.
Oct 1971. [Online]. Available:
Opt.,
vol.
10,
no.
10,
pp.
http://ao.osa.org/abstract.cfm?
URI=ao-10-10-2252 27, 28, 69, 183 [81] T. Erdogan, �Cladding-mode resonances in short- and long-period �ber grating �lters,� J. Opt. Soc. Am. A, vol. 14, no. 8, pp. 1760�1773, Aug 1997. [Online]. Available: http://josaa.osa.org/abstract.cfm?URI=josaa-14-8-1760 28, 30, 33, 35, 38, 41, 162
BIBLIOGRAPHY
253
[82] C. de Sterke, N. Broderick, B. J. Eggleton, and M. Steel, �Nonlinear optics
Optical Fiber Technology, vol. 2, no. 3, pp. 253 � 268,
in �ber gratings,�
1996. [Online]. Available:
http://www.sciencedirect.com/science/article/pii/
S1068520096900322 29, 168 [83] D. Marcuse, �Coupled mode theory of round optical �bers,� The Bell System
Technical Journal, vol. 52, no. 6, pp. 817�842, July - August 1973. 31 [84] D. Marcuse, Theory of dielectric optical waveguides, 1974. 31, 32 [85] C. Tsao, Optical Fibre Waveguide Analysis, 1992. 32, 33 [86] T. Erdogan, �Cladding-mode resonances in short- and long-period �ber grating �lters: errata,� J. Opt. Soc. Am. A, vol. 17, no. 11, pp. 2113�2113, Nov 2000. [Online]. Available:
http://josaa.osa.org/abstract.cfm?URI=josaa-17-11-2113
33, 60, 64, 162 [87] A. Bjarklev, �Microdeformation losses of single-mode �bers with step-index pro�les,� J. Lightwave Technol., vol. 4, no. 3, pp. 341 � 346, mar 1986. [Online]. Available:
http://ieeexplore.ieee.org/xpl/freeabs_all.jsp?arnumber=1074708
36 [88] H. Kogelnik, Theory of optical waveguides, T. T. in "Guided-Wave Optoelectronics", Ed.
Springer-Verlag, Berlin, 1990. 39, 43, 44
[89] Y. Koyamada, �Analysis of core-mode to radiation-mode coupling in �ber bragg gratings with �nite cladding radius,� J. Lightwave Technol., vol. 18, no. 9, p. 1220, Sep 2000. [Online]. Available: http://jlt.osa.org/abstract.cfm? URI=jlt-18-9-1220 46 [90] Y. Koyamada, �Numerical analysis of core-mode to radiation-mode coupling in vol.
long-period 13,
no.
4,
�ber pp.
Photonics
gratings,� 308
�
310,
apr
Technology
Letters,
[Online].
Available:
2001.
IEEE, http:
//ieeexplore.ieee.org/xpl/freeabs_all.jsp?arnumber=917834 46 [91] T.
MacDougall,
S.
Pilevar,
C.
Haggans,
and
M.
expression for the growth of long period gratings,�
Jackson,
�Generalized
Photonics Technology
Letters, IEEE, vol. 10, no. 10, pp. 1449 � 1451, oct 1998. [Online]. Available: http://ieeexplore.ieee.org/xpl/freeabs_all.jsp?arnumber=720290 52, 55, 149 [92] X. Shu, L. Zhang, and I. Bennion, �Sensitivity characteristics of long-period �ber gratings,�
J. Lightwave Technol., vol. 20, no. 2, p. 255, Feb 2002.
[Online]. Available: http://jlt.osa.org/abstract.cfm?URI=jlt-20-2-255 52, 55, 147, 148, 149, 151, 152, 153 [93] M. Adams, An introduction to optical waveguides.
New York: Wiley, 1981. 53
254
BIBLIOGRAPHY
[94] C.
Poole,
J.
Wiesenfeld,
D.
DiGiovanni,
and
A.
Vengsarkar,
�Optical
�ber-based dispersion compensation using higher order modes near cuto�,�
J. Lightwave Technol., vol. 12, no. 10, pp. 1746 � 1758, Oct 1994. [Online]. Available: http://jlt.osa.org/abstract.cfm?URI=jlt-12-10-1746 56 [95] Z. Wang and S. Ramachandran, �Ultrasensitive long-period �ber gratings
Opt. Lett., vol. 28, no. 24, pp.
for broadband modulators and sensors,� 2458�2460,
Dec 2003. [Online]. Available:
http://ol.osa.org/abstract.cfm?
URI=ol-28-24-2458 56 [96] P.
S.
J.
Physics
Russel,
World,
J.-L.
vol.
Archambault,
6,
pp.
41
�
and
46,
L.
1993.
Reekie, [Online].
�Fibre
gratings,�
Available:
http:
//holly.orc.soton.ac.uk/publications/07xx/780.pdf 60 [97] M. N. Ng and K. S. Chiang, �Thermal e�ects on the transmission spectra of long-period �ber gratings,� Optics Communications, vol. 208, no. 4-6, pp. 321 � 327, 2002. [Online]. Available:
http://www.sciencedirect.com/science/
article/pii/S0030401802015973 64, 159 [98] M. Hammer, �Hybrid analytical/numerical coupled-mode modeling of guidedwave devices,� J. Lightwave Technol., vol. 25, no. 9, pp. 2287�2298, Sep 2007. [Online]. Available: http://jlt.osa.org/abstract.cfm?URI=jlt-25-9-2287 66, 67 [99] N.
Song,
J.
coupled-mode
Technol.,
vol.
Mu,
and
theory
to
28,
no.
W.-P.
Huang,
optical 5,
pp.
�ber
�Application
grating
761�767,
Mar
of
2010.
the
complex
J.
Lightwave
[Online].
Available:
structures,�
http://jlt.osa.org/abstract.cfm?URI=jlt-28-5-761 67, 68 [100] D.
Stegall
and
T.
long-period
�ber
grating
vol.
11,
no.
3,
pp.
Erdogan,
343
�Leaky
�
345,
cladding
Photonics
devices,�
mar
1999.
mode
propagation
Technology [Online].
in
Letters,
IEEE,
Available:
http:
//ieeexplore.ieee.org/xpl/freeabs_all.jsp?arnumber=748229 68, 164 [101] Y.-C. Lu, L. Yang, W.-P. Huang, and S.-S. Jian, �Improved full-vector �nitedi�erence complex mode solver for optical waveguidesof circular symmetry,�
J. Lightwave Technol., vol. 26, no. 13, pp. 1868�1876, Jul 2008. [Online]. Available: http://jlt.osa.org/abstract.cfm?URI=jlt-26-13-1868 68 [102] D. Davis, long-period
T. Gaylord, �bre
E. Glytsis,
gratings:
spectral
and S. Mettler, characteristics,
�Co 2 laser-induced cladding
modes
and
polarisation independence,� Electronics Letters, vol. 34, no. 14, pp. 1416 � 1417, jul 1998. [Online]. Available: http://ieeexplore.ieee.org/xpl/freeabs_all. jsp?arnumber=706111 69
BIBLIOGRAPHY
[103] E.
255
Anemogiannis,
E.
N.
Glytsis,
and
T.
K.
Gaylord,
�Transmission
characteristics of long-period �ber gratings having arbitrary azimuthal/radial refractive index variations,� J. Lightwave Technol., vol. 21, no. 1, p. 218, Jan 2003. [Online]. Available:
http://jlt.osa.org/abstract.cfm?URI=jlt-21-1-218
69, 70, 75, 77, 78, 79, 186 [104] K. Morishita, �Numerical analysis of pulse broadening in graded index optical �bers,� IEEE Transactions on Microwave Theory and Techniques, vol. 29, no. 4, pp. 348 � 352, apr 1981. 70 [105] A. Householder, The Numerical Treatment of a Single Nonlinear Equation, 1970. 73 [106] T.
Fujisawa
gratings
Opt.,
and
with
vol.
M.
Koshiba,
coupled-mode
45,
no.
17,
�Analysis
theory
pp.
and
4114�4121,
of a
photonic
crystal
�nite-element Jun
2006.
waveguide
method,�
[Online].
Appl.
Available:
http://ao.osa.org/abstract.cfm?URI=ao-45-17-4114 80 [107] T.
Fujisawa
and
M.
Koshiba,
�Finite-element
mode-solver
for
nonlinear
periodic optical waveguides and its application to photonic crystal circuits,�
J. Lightwave Technol., vol. 23, no. 1, p. 382, Jan 2005. [Online]. Available: http://jlt.osa.org/abstract.cfm?URI=jlt-23-1-382 80, 81 [108] F. Ouellette, P. Krug, T. Stephens, G. Dhosi, and B. Eggleton, �Broadband and wdm dispersion compensation using chirped sampled �bre bragg gratings,�
Electronics Letters, vol. 31, no. 11, pp. 899 �901, may 1995. [Online]. Available: http://ieeexplore.ieee.org/xpl/freeabs_all.jsp?arnumber=390916 88 [109] D. K. W. Lam and B. K. Garside, �Characterization of single-mode optical �ber �lters,�
Appl. Opt., vol. 20, no. 3, pp. 440�445, Feb 1981. [Online].
Available: http://ao.osa.org/abstract.cfm?URI=ao-20-3-440 91, 96 [110] H.
Hosono,
H. Kawazoe,
Y.
Abe,
D.
L.
Kinser,
R.
A.
Weeks,
�Nature and origin of the 5-ev band in
K.
Muta,
sio2 :geo2
and
glasses,�
Phys. Rev. B, vol. 46, pp. 11 445�11 451, Nov 1992. [Online]. Available: http://link.aps.org/doi/10.1103/PhysRevB.46.11445 91 [111] M. L. Dockney,
S. W. James,
and R. P. Tatam,
�Fibre bragg gratings
fabricated using a wavelength tuneable laser source and a phase mask based interferometer,� Measurement Science and Technology, vol. 7, no. 4, p. 445, 1996. [Online]. Available: http://iopscience.iop.org/0957-0233/7/4/001 94 [112] K. O. Hill, B. Malo, F. Bilodeau, D. C. Johnson, and A. J, �Bragg gratings fabricated in monomode photosensitive optical �ber by uv exposure through a
256
BIBLIOGRAPHY
phase mask,� Appl. Phys. Lett., vol. 62, pp. 1035�1037, Mar 1993. [Online]. Available: http://link.aip.org/link/doi/10.1063/1.108786 96 [113] J. Prohaska, E. Snitzer, S. Rishton, and V. Boegli, �Magni�cation of mask fabricated �bre bragg gratings,� Electronics Letters, vol. 29, no. 18, pp. 1614 � 1615, sept 1993. [Online]. Available: http://ieeexplore.ieee.org/xpl/freeabs_ all.jsp?arnumber=233075 98 [114] R. Kashyap,
P. McKee,
R. Campbell,
and D. Williams,
of producing all �bre photoinduced chirped gratings,� vol.
30,
no.
12,
pp.
996
�
998,
jun
1994.
�Novel method
Electronics Letters,
[Online].
Available:
http:
//ieeexplore.ieee.org/xpl/freeabs_all.jsp?arnumber=293091 99 [115] J. Martin and F. Ouellette, �Novel writing technique of long and highly re�ective in-�bre gratings,� Electronics Letters, vol. 30, no. 10, pp. 811 � 812, may 1994. [Online]. Available: http://ieeexplore.ieee.org/xpl/freeabs_all.jsp? arnumber=289240 99 [116] H. Rourke, S. Baker, K. Byron, R. Baulcomb, S. Ojha, and S. Clements, �Fabrication and characterisation of long, narrowband �bre gratings by phase mask scanning,� Electronics Letters, vol. 30, no. 16, pp. 1341 � 1342, aug 1994. [Online]. Available: http://ieeexplore.ieee.org/xpl/freeabs_all.jsp?arnumber= 311949 99 [117] D.
Williams,
�Enhanced
B.
uv
Ainslie,
J.
Armitage,
photosensitivity
in
boron
R.
Kashyap,
codoped
and
R.
Campbell,
germanosilicate
�bres,�
Electronics Letters, vol. 26, no. 1, pp. 45 � 47, jan 1993. [Online]. Available: http://ieeexplore.ieee.org/xpl/freeabs_all.jsp?arnumber=256174 103, 104 [118] T. Mizunami, T. Fukuda, and A. Hayashi, �Fabrication and characterization of long-period-grating temperature sensors using geâb-co-doped photosensitive �bre and single-mode �bre,� Measurement Science and Technology, vol. 15, no. 8, p. 1467, 2004. [Online]. Available: http://stacks.iop.org/0957-0233/15/ i=8/a=006 103 [119] V. B. Neustruev, �Colour centres in germanosilicate glass and optical �bres,�
Journal of Physics: Condensed Matter, vol. 6, no. 35, p. 6901, 1994. [Online]. Available: http://stacks.iop.org/0953-8984/6/i=35/a=003 107 [120] K. Miura, J. Qiu, H. Inouye, T. Mitsuyu, and K. Hirao, �Photowritten optical
Phys.
waveguides
Lett.,
vol.
in
various
71,
pp.
glasses
with
3329�3331,
ultrashort
Dec
1997.
http://link.aip.org/link/doi/10.1063/1.120327 114, 116
pulse
lase,�
[Online].
Appl.
Available:
BIBLIOGRAPHY
257
[121] N. Godbout, X. Daxhelet, A. Maurier, and S. Lacroix, �Long-period �ber grating by electrical discharge,� in Proc. ECOC'98, 1998, pp. 397 � 398. 121, 122 [122] S. Kosinski and A. M. Vengsarkar, �Splice-based long-period �ber gratings,� in
Proc. OFC'98 Tech. Dig., no. paper ThG3, 1998, pp. 278 � 279. 121, 122 [123] M. Smietana, W. J. Bock, and P. Mikulic, �Comparative study of long-period gratings
written
in
a
boron
co-doped
�ber
by
an
electric
arc
and
uv
irradiation,� Measurement Science and Technology, vol. 21, no. 2, p. 025309, 2010. [Online]. Available:
http://stacks.iop.org/0957-0233/21/2/025309 129,
130 [124] D. N. Nikogosyan, �Multi-photon high-excitation-energy approach to �bre grating inscription,� Measurement Science and Technology, vol. 18, no. 1, p. R1, 2007. [Online]. Available: http://stacks.iop.org/0957-0233/18/i=1/a=R01 130 [125] A. I. Kalachev, V. Pureur, and D. N. Nikogosyan, �Investigation of long-period �ber gratings induced by high-intensity femtosecond uv laser pulses,� Optics
Communications, vol. 246, no. 1-3, pp. 107 � 115, 2005. [Online]. Available: http://www.sciencedirect.com/science/article/pii/S0030401804010818 130 [126] J. Albert, B. Malo, K. O. Hill, D. C. Johnson, J. L. Brebner, and R. Leonelli, �Refractive-index changes in fused silica produced by heavy-ion implantation followed by photobleaching,� Opt. Lett., vol. 17, no. 23, pp. 1652�1654, Dec 1992. [Online]. Available:
http://ol.osa.org/abstract.cfm?URI=ol-17-23-1652
130 [127] A.
D.
Kersey,
technology,�
�A
review
of
recent
developments
in
�ber
optic
sensor
Optical Fiber Technology, vol. 2, no. 3, pp. 291 � 317, July
1996. [Online]. Available:
http://www.sciencedirect.com/science/article/pii/
S106852009690036X 139, 168 [128] V. Bhatia, D. K. Campbell, D. Sherr, T. G. D'Alberto, N. A. Zabaronick, G. A. Ten Eyck, K. A. Murphy, and R. O. Claus, �Temparature-insensitive and
Opt.
strain-insensitive
Eng.,
vol.
36,
long-period
grating
no.
1872,
7,
p.
sensors July
for
1997.
smart
structures,�
[Online].
Available:
http://dx.doi.org/10.1117/1.601379 154, 156, 157 [129] X. Shu, T. Allsop, B. Gwandu, L. Zhang, and I. Bennion, �High temperature sensitivity of long-period gratings in b-ge codoped �bre,� Photonics Technology
Letters, IEEE, vol. 13, no. 8, pp. 818�820, august 2001. 159 [130] S.
Yin,
grating
K.
W.
based
Chung, tuneable
and
X.
�lter
Zhu,
using
�A a
highly unique
sensitivity double
long
cladding
period layer
258
BIBLIOGRAPHY
Optics
structure,�
Communications,
2001. [Online]. Available:
vol.
188,
no.
5-6,
pp.
301
�
305,
http://www.sciencedirect.com/science/article/pii/
S003040180001172X 159, 172 [131] J. N. Jang, S. Y. Kim, S. W. Kim, and M. S. Kim, �Temperature insensitive long-period �bre gratings,� Electronics Letters, vol. 35, no. 24, pp. 2134 � 2136, nov 1999. [Online]. Available:
http://ieeexplore.ieee.org/xpl/freeabs_
all.jsp?arnumber=815941 159, 172, 173 [132] V. Bhatia and A. M. Vengsarkar, �Optical �ber long-period grating sensors,�
Opt. Lett.,
vol.
21,
no.
9,
pp.
692�694,
May
1996.
[Online].
Available:
http://ol.osa.org/abstract.cfm?URI=ol-21-9-692 164, 202 [133] R.
Hou,
Z.
�Modelling higher vol.
than
12,
Ghassemlooy,
A.
long-period
�bre
of
that
no.
of
10,
Hassan,
1709
�
Lu,
1713,
and
response
Measurement
cladding,�
pp.
C.
grating
2001.
to
K.
P.
Dowker,
refractive
Science
[Online].
and
index
Technology,
Available:
http:
//m.iopscience.iop.org/0957-0233/12/10/314 164, 165 [134] S. Khaliq, S. W. James, and R. P. Tatam, �Fibre-optic liquid-level sensor using a long-period grating,� Opt. Lett., vol. 26, no. 16, pp. 1224�1226, Aug 2001. [Online]. Available:
http://ol.osa.org/abstract.cfm?URI=ol-26-16-1224
165, 171 [135] B. H. Lee and J. Nishii, �Cladding surrounding interface insensitive long-period grating,� Electronics Letters, vol. 34, no. 11, pp. 1129 � 1130, may 1998. [Online]. Available: http://ieeexplore.ieee.org/xpl/freeabs_all.jsp?arnumber= 684594 165 [136] A.
Kersey,
M.
M.
Putnam,
Davis,
and
E.
H.
Patrick,
Friebele,
M.
�Fiber
LeBlanc, grating
K.
Koo,
sensors,�
C.
J.
Askins,
Lightwave
Technol., vol. 15, no. 8, pp. 1442 � 1463, Aug 1997. [Online]. Available: http://jlt.osa.org/abstract.cfm?URI=jlt-15-8-1442 166, 168 [137] K.
O.
Hill,
bandwidth vol.
23,
D.
C.
optical
no.
9,
Johnson, waveguide
pp.
465
�
F.
Bilodeau,
transmission
466,
april
and
S.
1987.
Faucher,
�Narrow-
Electronics
�lters,�
[Online].
Available:
Letters, http:
//ieeexplore.ieee.org/xpl/freeabs_all.jsp?arnumber=4257665 166 [138] I.
Baumann,
J.
Seifert,
add-drop-multiplexer
W.
using
Nowak,
�ber
and
bragg
M.
Sauer,
gratings,�
�Compact
Photonics
all-�ber
Technology
Letters, IEEE, vol. 8, no. 10, pp. 1331�1333, oct 1996. [Online]. Available: http://ieeexplore.ieee.org/xpl/freeabs_all.jsp?arnumber=536645 166
BIBLIOGRAPHY
[139] F.
Bilodeau,
259
D.
C.
Johnson,
S.
Thériault,
B.
Malo,
J.
Albert,
and
K. O. Hill, �An all-�ber dense-wavelength-division multiplexer/demultiplexer using
photoimprinted
IEEE,
vol.
7,
no.
bragg 4,
Photonics
gratings,�
pp.
388�390,
apr
1995.
Technology [Online].
Letters, Available:
http://ieeexplore.ieee.org/xpl/freeabs_all.jsp?arnumber=376811 167 [140] J.
A.
R.
Williams,
I.
Bennion,
K.
Sugden,
and
N.
J.
Doran,
�Fiber
dispersion compensation using a chirped in-�re bragg grating,� Electronics
Letters,
vol. 30,
no. 12,
pp. 985 � 987,
june 1994. [Online]. Available:
http://ieeexplore.ieee.org/xpl/freeabs_all.jsp?arnumber=293084 167 [141] K. O. Hill, F. Bilodeau, B. Malo, T. Kitagawa, S. Thériault, D. C. Johnson, J. Albert, and K. Takiguchi, �Chirped in-�ber bragg grating for compensation of optical-�ber dispersion,� Opt. Lett., vol. 19, no. 17, pp. 1314�1316, Sept 1994. [Online]. Available:
http://ol.osa.org/abstract.cfm?uri=ol-19-17-1314
167 [142] G. A. Ball, W. W. Morey, and J. P. Waters, �Nd3+ �ber laser utilizing intra-core bragg re�ectors,� Electronics Letters, vol. 26, no. 21, pp. 1829 � 1830, oct 1990. [Online]. Available: http://ieeexplore.ieee.org/xpl/freeabs_all. jsp?arnumber=83137 168 [143] K. O. Hill, B. Malo, K. A. Vineberg, F. Bilodeau, D. C. Johnson, and I.
Skinner,
�E�cient
mode
conversion
in
telecommunication
�ber
using
externally written gratings,� Electronics Letters, vol. 26, no. 16, pp. 1270 � 1272, aug 1990. [Online]. Available:
http://ieeexplore.ieee.org/xpl/freeabs_
all.jsp?arnumber=130928 168 [144] B. Glisic and D. Inaudi, Fibre optic methods for structural health monitoring. Wiley and Sons, 2007. 169 [145] R. Falciai, C. Trono, G. Lanterna, and C. Castelli, �Continuous monitoring of
wooden
works
of
art
using
�ber
bragg
grating
sensors,�
Journal of
Cultural Heritage, vol. 4, no. 4, pp. 285 � 290, 2003. [Online]. Available: http://www.sciencedirect.com/science/article/pii/S1296207403000724 169 [146] E. Friebele, C. Askins, M. Putnam, A. Fosha, J. Florio, R. Donti, and R.
Blosser,
�Distributed
strain
sensing
with
�bre
bragg
grating
arrays
embedded in crtm composites,� Electronics Letters, vol. 30, no. 21, pp. 1783 � 1784, Oct 1994. [Online]. Available: http://ieeexplore.ieee.org/xpl/freeabs_ all.jsp?arnumber=328562 169
260
BIBLIOGRAPHY
[147] P.
E.
F.
Bagnoli,
N.
Sorrentino,
F.
Beverini,
Stefani,
R.
and
Falciai,
C.
Trono,
E.
Applied
Optics,
vol.
8,
no.
7,
p.
M.
�Development
of
Morganti,
an
erbium-
Journal of Optics A: Pure
doped �bre laser as a deep-sea hydrophone,�
and
Maccioni,
S535,
2006.
[Online].
Available:
http://stacks.iop.org/1464-4258/8/i=7/a=S36 169 [148] Y.-J.
Rao,
D.
bragg-grating
Webb,
D.
Jackson,
temperature
sensor
L.
Zhang,
system
for
and
I.
Bennion,
medical
�In-�ber
applications,�
J.
Lightwave Technol., vol. 15, no. 5, pp. 779�785, May 1997. [Online]. Available: http://ieeexplore.ieee.org/xpl/freeabs_all.jsp?arnumber=580812 169 [149] Z. Zhou, J. He, M. Huang, J. He, and G. Chen, �Casing pipe damage detection with optical �ber sensors: A case study in oil well constructions,� Advances
in Civil Engineering, vol. 2010 Article ID 638967, 2010. [Online]. Available: http://www.hindawi.com/journals/ace/2010/638967/cta/ 169 [150] J. P. Dunkers, J. L. Lenhart, S. R. Kueh, J. H. van Zanten, S. G. Advani, and R. S. Parnas, �Fiber optic �ow and cure sensing for liquid composite molding,� Optics and Lasers in Engineering, vol. 35, no. 2, pp. 91 � 104, 2001. [Online]. Available:
http://www.sciencedirect.com/science/article/pii/
S014381660000110X 171 [151] B. A. L. Gwandu, X. Shu, T. D. P. Allsop, W. Zhang, L. Zhang, D. J. Webb,
and
I.
Bennion,
�Simultaneous
refractive
index
and
temperature
measurement using cascaded long-period grating in double-cladding �bre,�
Electronics Letters, vol. 38, no. 14, pp. 695 � 696, Jul 2002. [Online]. Available: http://ieeexplore.ieee.org/xpl/freeabs_all.jsp?arnumber=1019816 173 [152] H.
J.
Patrick,
G.
A. M. Vengsarkar,
M.
Williams,
A.
D.
Kersey,
J.
R.
Pedrazzani,
and
�Hybrid �ber bragg grating/long period �ber grating
sensor for strain/temperature discrimination,� Photonics Technology Letters,
IEEE,
vol.
8,
no.
9,
pp.
1223�1225,
sept
1996.
[Online].
Available:
http://ieeexplore.ieee.org/xpl/freeabs_all.jsp?arnumber=531843 174, 202 [153] G. Anderson, J. Golden, L. Cao, D. Wijesuriya, L. Shriver-Lake, and F. Ligler, �Development of an evanescent wave �ber optic biosensor,� Engineering in
Medicine and Biology Magazine,
IEEE, vol. 13,
no. 3,
pp. 358 � 363,
Jun/Jul 1994. [Online]. Available: http://ieeexplore.ieee.org/xpl/freeabs_all. jsp?arnumber=294007 175 [154] I. D. Villar, M. Achaerandio, I. R. Matías, and F. J. Arregui, �Deposition of
overlays
Opt. Lett.,
by vol.
electrostatic 30,
no.
7,
self-assembly
in
pp.
Apr
720�722,
long-period 2005.
http://ol.osa.org/abstract.cfm?URI=ol-30-7-720 180, 184
�ber
gratings,�
[Online].
Available:
BIBLIOGRAPHY
261
[155] A. Cusano, A. Iadicicco, P. Pilla, L. Contessa, S. Campopiano, A. Cutolo, and M. Giordano, �Mode transition in high refractive index coated long period gratings,� Opt. Express, vol. 14, no. 1, pp. 19�34, Jan 2006. [Online]. Available: http://www.opticsexpress.org/abstract.cfm?URI=oe-14-1-19 180, 184, 191 [156] I. D. Villar, I. R. Matias, F. J. Arregui, and M. Achaerandio, �Nanodeposition of materials with complex refractive index in long-period �ber gratings,� J.
Lightwave Technol., vol. 23, no. 12, p. 4192, Dec 2005. [Online]. Available: http://jlt.osa.org/abstract.cfm?URI=jlt-23-12-4192 184, 185 [157] D. R. Thévenot, K. Toth, R. A. Durst, and G. S. Wilson, �Electrochemical biosensors:
recommended
de�nitions
and
classi�cation,�
Biosensors and
Bioelectronics, vol. 16, no. 1-2, pp. 121 � 131, 2001. [Online]. Available: http://www.sciencedirect.com/science/article/pii/S0956566301001154 191 [158] J. Newman, P. Warner, A. Turner, and L. Tigwell, �Biosensors: A clearer view,�
Cran�eld Biotechnology Centre, p. 216, 2004. 191 [159] M.N. and Velasco-Garcia, level:
in 33, of
A
Cell
review
&
2009,
of
recent
progress
Developmental
A
Pigment
�Optical biosensors for probing at the cellular
Cells
and
Special
and
Biology, Edition
Pigment
future vol.
on
prospects,�
20,
no.
Biosensors
Patterns.
1,
and
Seminars pp.
27
�
Development
[Online].
Available:
http://www.sciencedirect.com/science/article/pii/S1084952109000172 191 [160] D. Dey and T. Goswami, �Optical biosensors: a revolution towards quantum nanoscale electronics device fabrication.� J Biomed Biotechnol, vol. 2011, 2011. 191 [161] S. M. Borisov and O. S. Wolfbeis, �Optical biosensors,� Chemical Reviews, vol. 108, no. 2, pp. 423�461, 2008, pMID: 18229952. [Online]. Available: http://pubs.acs.org/doi/abs/10.1021/cr068105t 191, 192 [162] M. Marazuela and M. Moreno-Bondi, �Fiber-optic biosensors - an overview,�
Analytical
and
Bioanalytical
10.1007/s00216-002-1235-9.
Chemistry,
[Online].
vol.
Available:
372,
pp.
664�682,
2002,
http://dx.doi.org/10.1007/
s00216-002-1235-9 191, 192 [163] O. S. Wolfbeis,
Chemistry,
vol.
�Fiber-optic chemical sensors and biosensors,�
Analytical
74,
[Online].
Available:
�Fiber-optic chemical sensors and biosensors,�
Analytical
no.
12,
pp.
2663�2678,
2002.
http://pubs.acs.org/doi/abs/10.1021/ac020176e 192 [164] O. S. Wolfbeis,
Chemistry, vol. 76, no. 12, pp. 3269�3284, 2004, pMID: 15193108. [Online]. Available: http://pubs.acs.org/doi/abs/10.1021/ac040049d 192
262
BIBLIOGRAPHY
[165] O. S. Wolfbeis,
�Fiber-optic chemical sensors and biosensors,�
Analytical
Chemistry, vol. 78, no. 12, pp. 3859�3874, 2006, pMID: 16771528. [Online]. Available: http://pubs.acs.org/doi/abs/10.1021/ac060490z 192 [166] O. S. Wolfbeis,
�Fiber-optic chemical sensors and biosensors,�
Analytical
Chemistry, vol. 80, no. 12, pp. 4269�4283, 2008, pMID: 18462008. [Online]. Available: http://pubs.acs.org/doi/abs/10.1021/ac800473b 192 [167] M. E. Bosch, A. J. R. Sánchez, F. S. Rojas, and C. B. Ojeda, �Recent development in optical �ber biosensors,� Sensors, vol. 7, no. 6, pp. 797�859, 2007. [Online]. Available: http://www.mdpi.com/1424-8220/7/6/797/ 192 [168] A. Leung,
P. M. Shankar,
and R. Mutharasan,
�A review of �ber-optic
biosensors,� Sensors and Actuators B: Chemical, vol. 125, no. 2, pp. 688 � 703, 2007. [Online]. Available: http://www.sciencedirect.com/science/article/ pii/S0925400507001931 192 [169] G. Orellana and D. Haigh, �New trends in �ber-optic chemical and biological sensors,� Current Analytical Chemistry, vol. 4, no. 4, pp. 273�295, 2008. 192 [170] H.
Endo,
Y.
T. Hayashi, system
Acta,
for
Yonemori,
determining
vol. 573-574,
Methods
of
K.
Musiya,
and K. Mitsubayashi, glucose
no. 0,
Analysis
M.
Maita,
levels
in
�sh
pp. 117 � 124,
-IMA
T.
Shibuya,
H.
Ren,
�A needle-type optical enzyme sensor
2006,
2005.
Analytica Chimica
blood,�
Instrumental
[Online].
Available:
http:
//www.sciencedirect.com/science/article/pii/S0003267006008981 192 [171] K.-C. Liao, S.-C. Chang, C.-Y. Chiu, and Y.-H. Chou, �Acute response in vivo of a �ber-optic sensor for continuous glucose monitoring from canine studies on point accuracy,� Sensors, vol. 10, no. 8, pp. 7789�7802, 2010. [Online]. Available: http://www.mdpi.com/1424-8220/10/8/7789/ 192 [172] L. �A
Viveros,
S.
Paliwal,
�uorescence-based
pesticides
and
Chemical,
vol.
McCrae,
biosensor
chemical 115,
D.
no.
warfare 1,
pp.
for
J.
the
detection
agents,� 150
�
Wild,
Sensors
157,
2006.
and of
A.
Simonian,
organophosphate
and
Actuators
[Online].
B:
Available:
http://www.sciencedirect.com/science/article/pii/S092540050500780X 193 [173] F. Long, H. Shi, M. He, and A. Zhu, �Sensitive and rapid detection of 2,4-dicholorophenoxyacetic acid in water samples by using evanescent wave all-�ber immunosensor,� Biosensors and Bioelectronics, vol. 23, no. 9, pp. 1361 � 1366, 2008. [Online]. Available: http://www.sciencedirect.com/science/ article/pii/S0956566307004952 193
BIBLIOGRAPHY
[174] D.
Atias,
Y.
263
Liebes,
V.
Chalifa-Caspi,
L.
Bremand,
L.
Lobel,
R.
S.
Marks, and P. Dussart, �Chemiluminescent optical �ber immunosensor for the detection of igm antibody to dengue virus in humans,� Sensors and Actuators
B: Chemical, vol. 140, no. 1, pp. 206 � 215, 2009. [Online]. Available: http://www.sciencedirect.com/science/article/pii/S092540050900272X 193 [175] J.
Corres,
I.
Matias,
J.
Bravo,
and
F.
Arregui,
�Tapered
optical
�ber
biosensor for the detection of anti-gliadin antibodies,� Sensors and Actuators
B: Chemical, vol. 135, no. 1, pp. 166 � 171, 2008. [Online]. Available: http://www.sciencedirect.com/science/article/pii/S0925400508005583 193 [176] J. H. Watterson,
S. Raha,
C. C. Kotoris,
C. C. Wust,
F. Gharabaghi,
S. C. Jantzi, N. K. Haynes, N. H. Gendron, U. J. Krull, A. E. Mackenzie, and P. A. E. Piunno, �Rapid detection of single nucleotide polymorphisms associated with spinal muscular atrophy by use of a reusable �bre?optic
Nucleic Acids Research, vol. 32, no. 2, p. e18, 2004. [Online].
biosensor,�
Available: http://nar.oxfordjournals.org/content/32/2/e18.abstract 193 [177] A. Almadidy, J. Watterson, P. A. Piunno, I. V. Foulds, P. A. Horgen, and U. Krull, �A �bre-optic biosensor for detection of microbial contamination,�
Canadian Journal of Chemistry, vol. 81, no. 5, pp. 339�349, 2003. [Online]. Available: http://www.nrcresearchpress.com/doi/abs/10.1139/v03-070 193 [178] H.
Nguyen-Ngoc
cells
in
vol.
583,
an no.
and
C.
inorganic 1,
Tran-Minh, translucent
pp.
161
�
�Fluorescent
Analytica
matrix,�
165,
2007.
biosensor
[Online].
using
whole
Chimica
Acta,
Available:
http:
//www.sciencedirect.com/science/article/pii/S0003267006020186 193 [179] F. Cecchini, M. Manzano, Y. Mandabi, E. Perelman, and R. S. Marks, �Chemiluminescent dna optical �bre sensor for brettanomyces bruxellensis detection,�
Journal
of
Biotechnology,
2012. [Online]. Available:
vol.
157,
no.
1,
pp.
25
�
30,
http://www.sciencedirect.com/science/article/pii/
S0168165611006092 194 [180] Y.-F. Lai,
Chang, and
C.
S.-H.
Hung,
Chou,
Y.-J.
Lee,
�Discrimination
R.-C.
of
Chen,
breast
cancer
prostate-speci�c antigen levels in women's serum,� vol.
83,
no.
13,
pp.
5324�5328,
2011.
L.-C. by
Su,
C.-S.
measuring
Analytical Chemistry,
[Online].
Available:
http:
//pubs.acs.org/doi/abs/10.1021/ac200754x 194 [181] Y.-F. S.-C.
Chang, Wu,
S.-F.
Y.-M.
Wang,
A.
Chen,
J.
C.
Huang,
J.-P.
Hsieh,
L.-C. and
Su, C.
L.
Yao,
Chou,
Y.-C.
�Detection
Li, of
swine-origin in�uenza a (h1n1) viruses using a localized surface plasmon
264
BIBLIOGRAPHY
coupled �uorescence �ber-optic biosensor,� vol.
26,
no.
3,
pp.
1068
�
1073,
Biosensors and Bioelectronics,
2010.
[Online].
Available:
http:
//www.sciencedirect.com/science/article/pii/S0956566310005762 194 [182] J. C. Huang, Y.-F. Chang, K.-H. Chen, L.-C. Su, C.-W. Lee, C.-C. Chen, Y.-M. A. Chen, and C. Chou, �Detection of severe acute respiratory syndrome (sars) coronavirus nucleocapsid protein in human serum using a localized surface plasmon coupled �uorescence �ber-optic biosensor,� Biosensors and
Bioelectronics,
vol. 25,
no. 2,
pp. 320 � 325,
2009. [Online]. Available:
http://www.sciencedirect.com/science/article/pii/S0956566309003832 194 [183] Y.-F.
Chang,
R.-C.
Chen,
Y.-J.
Lee,
S.-C.
Chao,
L.-C.
Su,
Y.-C.
Li,
and C. Chou, �Localized surface plasmon coupled �uorescence �ber-optic biosensor for alpha-fetoprotein detection in human serum,� Biosensors and
Bioelectronics, vol. 24, no. 6, pp. 1610 � 1614, 2009. [Online]. Available: http://www.sciencedirect.com/science/article/pii/S0956566308004831 194 [184] J.
Pollet,
M.
F.
Wevers,
Delport, and
J.
K.
P.
Janssen,
Lammertyn,
K.
�Fiber
Jans, optic
G. spr
Maes,
H.
biosensing
Pfei�er, of
dna
hybridization and dnaprotein interactions,� Biosensors and Bioelectronics, vol.
25,
no.
4,
pp.
864
�
869,
2009.
[Online].
Available:
http:
//www.sciencedirect.com/science/article/pii/S0956566309004692 194 [185] A. N. Chryssis, S. S. Saini, S. M. Lee, Y. Hyunmin, W. E. Bentley, and M. Dagenais, �Detecting hybridization of dna by highly sensitive evanescent �eld etched core �ber bragg grating sensors,� Selected Topics in Quantum
Electronics, IEEE Journal of, vol. 11, no. 4, pp. 864 � 872, july-aug. 2005. [Online]. Available: http://ieeexplore.ieee.org/xpl/freeabs_all.jsp?arnumber= 1545988 194 [186] A. Cusano, P. Pilla, L. Contessa, A. Iadicicco, S. Campopiano, A. Cutolo, M. Giordano, and G. Guerra, �High-sensitivity optical chemosensor based on coated long-period gratings for sub-ppm chemical detection in water,�
Appl. Phys. Lett., vol. 87, pp. 234 105�234 107, Dec 2005. [Online]. Available: http://link.aip.org/link/doi/10.1063/1.2136437 197 [187] S. W. James, I. Ishaq, G. J. Ashwell, and R. P. Tatam, �Cascaded long-period gratings with nanostructured coatings,� 2197�2199,
Sep
2005.
[Online].
Opt. Lett.,
Available:
vol. 30,
no. 17,
pp.
http://ol.osa.org/abstract.cfm?
URI=ol-30-17-2197 197 [188] R. C. Kamikawachi, I. Abe, A. S. Paterno, H. J. Kalinowski, M. Muller, J.
L.
Pinto,
and
J.
L.
Fabris,
�Determination
of
the
thermo-optic
BIBLIOGRAPHY
coe�cient
in
265
liquids
with
�ber
bragg
grating
refractometer,�
Optics
Communications, vol. 281, no. 4, pp. 621 � 625, 2008. [Online]. Available: http://www.sciencedirect.com/science/article/pii/S0030401807010255 202 [189] J. Cordek,
X. Wang,
and W. Tan,
�Direct immobilization of glutamate
dehydrogenase on optical �ber probes for ultrasensitive glutamate detection,�
Analytical Chemistry, vol. 71, no. 8, pp. 1529�1533, 1999. [Online]. Available: http://pubs.acs.org/doi/abs/10.1021/ac980850l 238
Index
β -plot, 21 ω−tricosenoic
Bacteriophage, 5 acid, 182
Band-rejection �lter, 170 Benzene, 173
Abbe number, 52 Abbe refractometer, 173 Absorption-based measurement, 175 Accurate refractive index measurement, 203 Acquisition time, 230 Acrylate-based polymer, 172 Aerospace application, 169 Air-clad optical �ber, 172 Amino group, 179 Amperometric measurement, 191 Amplitude mask, 104 Amplitude mask technique, 101 Antibody, 5, 179 Antibody detection, 175 Antibody-antigen interaction, 175 Antifreeze, 4, 173 Antigen, 5, 179 Antigen detection, 175 Aptamer, 194 Argon ion laser, 88 Atomic-force microscope, 116 Azimuthal order, 31
Bessel function, 31 Bio-functionalization, 179 Bioassay, 5 Biochemical sensing, 176 Biological recognition element, 4, 175 Biological sensing, 2 Biological sensing element, 191 Biomedical �eld, 194 Bioprocessing, 179 Bioreceptor, 194 Biosensor, 191 Biotin, 5 Biotin group, 179 Birefringence, 128 Blazed FBG, 86 Blood glucose detection, 192 Boundary condition, 57
Calcium chloride, 4 Cane sugar, 4, 173 Carboxylate group, 179 Cargille oil, 172 Cascaded Raman ampli�cation, 168
Bacteria, 5
Chemical process analysis, 192
Bacteria detection, 193
Chemical sensing, 2, 176
268
INDEX
Chemiluminescence, 175
DNA oligonucleotide, 196
Chemiluminescence-based immunosensor,
Drug recognition, 175
193 Chirped FBG, 86
Dual resonant peaks, 56 Dual shaped core, 165
Chloride ion, 4, 173 Chloroform, 4, 197 Cladding mode coupling, 29 Clinical monitoring, 192 CO2 laser, 118 Coated OFG, 4 Colloidal gold nanoparticle, 5 Complex coupled mode theory, 67 Complimentary target, 196 Constructive interference, 17 Cooling rate, 123 Core-mode core-mode coupling constant, 40 Counter-propagating mode, 13 Coupled mode theory, 28 Coupling coe�cient, 30 Coupling constant, 39 Coupling factor, 64 Covalent bond, 179 Cross-sensitivity, 2, 202 Cultural heritage, 169
E�ective refractive index, 21 Electric �eld, 16 Electric �eld vector, 30 Electrochemical micromachining, 3 Electromagnetic interference, 2 Electromagnetic wave, 16 Electrostatic self−assembly, 181 Energy band-gap, 102 Environmental monitoring, 179 Environmental surveillance, 192 Enzyme-Linked Immuno-Sorbent Assay, 175 Etched �ber Bragg grating, 177 Ethanol, 4 Ethylene glycol, 4 Evanescent wave, 15, 178 Evanescent wave immunosensor, 193 Extrinsic optical �ber sensor, 12 Fabry-Perot interferometric immunosensor, 193
Cut-o� thickness, 182
FBG characteristic equation, 23
Cut-o� wavelength, 107
FBG detuning parameter, 44 FC/PC connector, 230
Deoxyribonucleic acid, 194
Fiber bending, 2
Di�erential e�ective refractive index, 65
Fiber Bragg grating, 5
Di�raction grating, 16
Fiber cladding, 15
Di�raction order, 19
Fiber core, 14
Dinitrophenol, 5
Fiber glass densi�cation, 118
Dip-coating, 197
Fiber optic biosensor, 192
Dispersion compensation, 166
Fiber tapering, 125
Dispersion relation, 30
Fictive temperature, 123
Distributed Bragg re�ector, 169
Finite di�erence, 68
DNA, 5
Finite element, 67
DNA hybridization, 194
Finite element method, 28, 79
INDEX
269
�tting function, 230
Induced-index change, 84
Fitting goodness, 230
Intensity, 36
Flow cell, 5
Interferometric con�guration, 2, 197
Flow rate, 233
Internal writing technique, 88
Fluorescence, 175
Intrinsic optical �ber sensor, 11
Food manufacturing and storage, 192
Ion implantation, 130
Forward-propagating mode, 15
Isopropyl alcohol, 4
Fresnel equation, 70
IUPAC, 191
Fresnel re�ection, 164 Front panel, 231
Kerosene, 173
Full width at half maximum, 60
Kramers-Kronig principle, 103 Kronecker delta function, 40
Gain-�attening �lter for erbium doped �ber ampli�ers, 170
Label-based assay, 175
Galerkin procedure, 67
Label-free, 1, 176
Gaussian �tting function, 230
Laminar �ow, 207
Geometrical optics, 13
LangmuirBlodgett, 181
Germanium dioxide, 11
Langmuir-Blodgett technique, 197
Germanium-oxygen-de�cient center, 107
Laser, 11
Glucose, 4, 173
Leaky mode, 68, 164
Glutarahyldehyde chemistry, 195
Ligand, 179
Glycerine, 4
Light emitting diode, 215
gold nanoparticle, 194
Limit of detection, 5
GPIB interface, 230
Linearly polarized, 31
Grating equation, 19
Liquid chromatography, 173
Grating period, 13
Liquid crystal material, 172 Local densi�cation, 116
Heat sink, 206 Heating-cooling process, 123
Localized surface plasmon coupled �uorescence, 194
Heavy metal detection, 193
Long period grating, 5
Heptane, 173
Long−term measurement, 208
Herbicide detection, 193
Longitudinal coupling coe�cient, 39
High refractive index, 184
Lorentzian �tting function, 230
Hill grating, 90
Low volume, 203
Hybrid coupled mode theory, 67
Low-order, 36
Hydrogen, 4
LPG characteristic equation, 24 LPG detuning parameter, 46
Immunoglobulin detection, 194
Luminescence-based measurement, 175
Immunosensor, 179 Index perturbation, 39
Magnetic �eld vector, 30
270
INDEX
Marine application, 169
Overlay refractive index, 181
Material dispersion, 52, 141, 150
Overlay thickness, 181
Maxwell's equation, 30 Medical application, 169
Peltier cell, 206
Medical diagnosis, 179
Perfectly matched layer, 67
Micro�uidic system, 5
Perfectly re�ecting boundary condition, 67
Mode conversion, 27 Mode equation, 51
Peristaltic pump, 233
Modi�ed Bessel function, 31
Pesticide detection, 193
Modi�ed phase mask method, 96
pH, 4
Molecular length, 182
Phase mask, 94
Multi-parameter sensing, 173
Phase mask method, 96
Mutation detection, 193
Phase mask technique, 91 Phase-matching condition, 14
Nano−coating technique, 181
Photochemical approach, 100
Nanostructured �lm, 197
Photoelastic e�ect, 133
Narrow-bandwidth optical waveguide trans- Photonic crystal, 3 mission �lter, 166
Photonic crystal �ber, 79
Neumann function, 34
photosensitivity, 89
NI CVI program, 230
Physical �eld, 140
Non-coated OFG, 4
Physiochemical transducer, 191
Non-photochemical approach, 101
Piezoelectric shear, 191
Non-speci�c adsorption, 175
Pipeline monitoring, 169
Normalized e�ective refractive index, 31
Planar waveguide, 191
Nuclear magnetic resonance, 169
Pockel's coe�cient, 142
Numerical aperture, 31
Point-to-point technique, 101
Oil detection, 189 Oligonucleotide, 195 Optical add/drop multiplexer, 166 Optical �ber, 11 Optical �ber grating, 2 Optical �ber mode converter, 168 Optical �ber sensor, 2, 11 Optical �lter, 166
Pollutant detection, 193 Polymer, 4 Potentiometric measurement, 191 Pressure, 2 Propagation constant, 21, 30 Prostate speci�c antigen, 194 Pulse shaping, 166 PVC tubing, 233
Optical resolution, 217
Quality control in beverage, 194
Optical resonating structure, 2
Quality control in food, 194
Optical spectrum analyzer, 215, 230 Optimum overlay thickness, 187
Radian frequency, 30
Organic aromatic compound, 173
Radiation mode, 164
INDEX
271
Radiation mode coupling, 29
Streptavidin, 5
Radio frequency interference, 2
Structural health monitoring, 169
Rayleigh length, 116
Sucrose, 4
Receptor, 179
Super-paramagnetic nanoparticle, 194
Re�ection grating, 13
Superluminescent diode, 215, 230
Refractive index, 1
Surface acoustic waves, 191
Refractive index pro�le, 84
Surface measurement, 3
Refractive index sensitivity, 179
Surface plasmon resonance, 1, 176, 196
Refractometric measurement, 3
Surrounding refractive index, 2, 148
Residual stress relief, 118
Swine-origin in�uenza A, 194
Resolution, 2
Syndiotactic polystyrene, 197
Resonance wavelength, 29 Root mean square deviation, 174 RS−232 serial interface, 207
Sandwich immunoassay, 194 Selectivity, 4, 179 Sellmeier equation, 52 Semiconductor laser component, 166 Sensitivity, 2 Severe acute respiratory syndrome, 194 Silica, 11 Single mode �ber, 12 Single stranded DNA, 195 Slab waveguide theory, 188 Snell's law, 13 Sodium chloride, 4 Sodium D line, 233 Softening temperature, 123 Sol-gel, 4 Source-tunable interferometer technique, 94 Space and aeronautics, 192 Species-speci�c sensor, 196 Spectral range, 56 Splicing machine, 122
TEC control system, 208 Temperature, 2 Temperature gradient, 125 Temperature measurement system, 203 Thermal expansion coe�cient, 144 Thermistor, 207 Thermo−stabilized �ow cell, 203 Thermo-electric cooler, 206 Thermo-optic coe�cient, 144 Thermocouple, 203 Thermometric measuring unit, 207 Tilted �ber Bragg grating, 177 Total excitation energy, 103 Total internal re�ection, 103 Transfer matrix method, 28 Translation stage, 107 Transmission grating, 15 Transparent in�ux boundary condition, 67 Transverse coupling coe�cient, 39 Transverse distribution, 36 Transverse holographic technique, 92 Turn around point, 55 Two-beam interferometer technique, 91 Two-layer model, 164
SPR immunosensor, 193 Step-index, 27
Uniform FBG, 86
Strain, 2
UV spectroscopy, 173
272
V-number, 31 Vacuum electric permittivity, 30 Vacuum magnetic permeability, 30 Vapor, 4 Virus detection, 193 Volatile organic compound, 4 Volume measurement, 3 Waveguide dispersion, 52, 149, 150 Wavelength division multiplexing, 167 Wavelength selective device, 167 Weakly guiding approximation, 28 Xylene, 4, 173
INDEX
Publications List
Il tutto è maggiore della somma delle parti Aristotele Meta�sica
In press (1)
CHIAVAIOLI F, MUGNAINI M, TRONO C, BALDINI F, and BRENCI M,
� CASCADED LPG AND FBG INTEGRATED IN A MINIATURIZED FLOW CELL FOR COMPENSATED REFRACTOMETRIC MEASUREMENT,� In:
(A. D'Amico et al. Eds.) Lecture Notes in Electrical Engineering: Sensors and Mi-
crosystems: AISEM 2011 Proceedings, vol.
109, NEW YORK: SPRINGER SCI-
ENCE+BUSINESS MEDIA, ISBN: 9781461409342, doi: 10.1007/978-1-4614-09359_41, 2012.
2012 (2)
BALDINI F, BRENCI M, CHIAVAIOLI F, GIANNETTI A, and TRONO C,
� OPTICAL FIBRE GRATINGS AS TOOLS FOR CHEMICAL AND BIO-
274
INDEX
CHEMICAL SENSING,� Analytical and Bioanalytical Chemistry (Springer Berlin
/ Heidelberg), vol. 402 (1), p. 109116, ISSN: 1618-2642, doi: 10.1007/s00216-0115492-3, 2012.
2011 (3)
BALDINI F, BRENCI M, CHIAVAIOLI F, GIANNETTI A, and TRONO C,
� OPTICAL FIBER REFRACTOMETER BASED ON A LONG PERIOD GRATING AND AN ACCURATE CROSS-SENSITIVITIES COMPENSATION SYSTEM INTEGRATED INTO A THERMO-STABILIZED FLOW CELL,� In:
4th EOS Topical Meeting on Optical Microsystems (OµS'11), Capri
(NA) - Italy, September 26 - 28, paper 4555, 2011.
(4) CHIAVAIOLI F, MUGNAINI M, BALDINI F, BRENCI M, GIANNETTI A, and TRONO C, � RIFRATTOMETRO IN FIBRA OTTICA BASATO SU RETICOLO A PASSO LUNGO CON SISTEMA DI AUTOCOMPENSAZIONE DELLE CROSS SENSIBILITA',� In: Atti del XXVIII Congresso Nazionale del
Gruppo Misure Elettriche ed Elettroniche, Palazzo della Borsa - Sala delle Grida Via XX Settembre 44 - Genova (GE), 12 - 14 Settembre, 2011.
(5)
TRONO C, BALDINI F, BRENCI M, CHIAVAIOLI F, and MUGNAINI M,
� FLOW CELL FOR STRAIN- AND TEMPERATURE-COMPENSATED REFRACTIVE INDEX MEASUREMENTS BY MEANS OF CASCADED OPTICAL FIBRE LONG PERIOD AND BRAGG GRATINGS,� Measurement
Science & Technology (IOP Publishing), vol. 22 (7), p. 075204, ISSN: 0957-0233, doi: 10.1088/0957-0233/22/7/075204, 2011.
(6) TRONO C, BALDINI F, BRENCI M, CHIAVAIOLI F and FALCIAI R, � FLOW CELL WITH HYBRID LPG AND FBG OPTICAL FIBER SENSOR FOR REFRACTOMETRIC MEASUREMENTS,� In:
Proceedings of 21st Interna-
INDEX
275
tional Conference on Optical Fiber Sensors, Ottawa - Canada, May 15 - 19, vol. 7753, p. 775392, doi: 10.1117/12.885126, 2011.
(7)
TRONO C, BALDINI F, BRENCI M and CHIAVAIOLI F, � LONG PERIOD
GRATING-BASED OPTICAL FIBRE SENSOR WITH INTERNAL OPTICAL FEEDBACK FOR THE RELIABLE MEASUREMENT OF REFRACTIVE INDEX IN LIQUID SAMPLES,� In:
Atti del XIII Convegno Nazionale
delle Tecnologie Fotoniche, Palazzo Ducale - Genova (GE), 9 - 11 Maggio, 2011.
(8)
TRONO C, BALDINI F, BRENCI M, CHIAVAIOLI F, FALCIAI R, GIAN-
NETTI A and MUGNAINI M, � LONG PERIOD AND FIBER BRAGG GRATINGS WRITTEN WITHIN THE SAME FIBER FOR SENSING PURPOSES,�
In: Proceedings of SPIE Photonics West 2011, Integrated Optics: Devices, Materials,
and Technologies XV, The Moscone Center - San Francisco, California, USA, January 22 - 27, vol. 7941, p. 794112, doi: 10.1117/12.873796, 2011.
2010 (9)
CHIAVAIOLI F, MUGNAINI M, BALDINI F, BRENCI M, GIANNETTI A and
TRONO C, � SENSORE DI INDICE DI RIFRAZIONE IN FIBRA OTTICA BASATO SU RETICOLI A PASSO LUNGO,� In: Atti del XXVII Congresso
Nazionale del Gruppo Misure Elettriche ed Elettroniche, Centro Congressi Hotel Summit - Gaeta (LT), 13 - 15 Settembre, 2010.
2009
276
(10)
INDEX
FORT A, CHIAVAIOLI F, LOTTI C, MUGNAINI M, ROCCHI S and VIG-
NOLI V, � A LABORATORY IMPEDANCE METER FOR ELECTROCHEMICAL SENSORS,� In:
AIP Conference Proceedings, vol.
1137, p.
303-305, doi:
10.1063/1.3156532, 2009.
(11)
FORT A, CHIAVAIOLI F, LOTTI C, MUGNAINI M, ROCCHI S and VIG-
NOLI V, � IMPEDENZIMETRO DA LABORATORIO PER LA CARATTERIZZAZIONE DI SENSORI ELETTROCHIMICI,� In: Atti del XXVI Congresso
�GMEE� Gruppo Misure Elettriche ed Elettroniche, Salerno, 16 - 19 Settembre, 2009.