Entwicklung einer generischen FPGA-Implementierung ... This work presents a
generic neural network hardware implementation which is suit- able for FPGA ...
Faculty of Electrical Engineering and Information Technology Professorship of Circuit and Systems Design
Diplomarbeit Design of a Generic Neural Network FPGA-Implementation Entwicklung einer generischen FPGA-Implementierung Neuronaler Netze
Robert Lange Chemnitz, 2nd November 2005 Supervising Professor: Prof. Dr.-Ing. habil. Dietmar Müller Advisor: Dipl.-Ing. Erik Markert
2
3
Bibliographische Angaben Verfasser: Titel:
Robert Lange Entwicklung einer generischen FPGA-Implementierung Neuronaler Netze Umfang: 143 Seiten, 18 Tabellen, 55 Abbildungen Dokumentenart: Diplomarbeit Hochschule: Technische Universität Chemnitz Fakultät für Elektrotechnik und Informationstechnik Lehrstuhl Schaltungs- und Systementwurf Schlagworte: Neuronales Netz, Backpropagation, Hardwareentwurf, Field Programmable Gate Array, Softwareentwicklung
Kurzreferat Diese Arbeit entwickelt eine generische Hardware-Implementierung für neuronale Netze, die in FPGA eingesetzt werden kann. Sie unterstützt BackpropagationNetzwerke 1. Ordnung mit beliebiger Struktur. Es ist keine Lernmethode in der Hardware integriert. Jede Netzwerkschicht enthält nur ein Neuron, welches alle Ausgaben im Zeitmultiplex bearbeitet. Auf Wunsch kann das Netzwerk mit einem seriellen Interface versehen werden. Zur Unterstützung des Entwurfsprozesses neuronaler Netze wurden zwei Programme entwickelt. CNSIM emuliert die Hardware-Architektur und erlaubt die Festlegung geeigneter Datenbreiten für das Netzwerk. CNCONV erzeugt anschliessend die toplevel VHDL-Dateien für die Simulation bzw. Synthese.
4
Bibliographical Information Author: Title:
Robert Lange Design of a Generic Neural Network FPGA-Implementation Contents: 143 Pages, 18 Tables, 55 Figures Document Type: Diplomarbeit School: Chemnitz University of Technology Faculty of Electrical Engineering and Information Technology Professorship of Circuit and Systems Design Keywords: Neural Network, Backpropagation, Hardware Design, Field Programmable Gate Array, Software Development
Abstract This work presents a generic neural network hardware implementation which is suitable for FPGA design. It supports first order Backpropagation networks of arbitrary structure. No learning method is integrated. Every layer instantiates only one neuron which processes all outputs in multiplex. A serial communication interface can be included as option. To support the neural network design process, two software tools were developed. CNSIM emulates the hardware architecture and allows identification of feasible data widths for the neural network. Subsequently, CNCONV generates the toplevel VHDL files for simulation and synthesis.
5
Selbständigkeitserklärung
Hiermit erkläre ich, dass ich die vorliegende Arbeit selbständig und nur unter Verwendung der angegebenen Hilfsmittel und Literatur angefertigt habe.
Chemnitz, den 2. November 2005
6
Contents Overview
1 Introduction
14
2 Neural Networks
15
3 Implementation Aspects
35
4 Hardware Architecture
57
5 Evaluation
96
6 Conclusion
111
Bibliography
113
A Appendix
118
7
Contents
1 Introduction
14
2 Neural Networks 2.1 Overview . . . . . . . . . . . . . 2.2 Neural Network Fundamentals . 2.2.1 Characteristics . . . . . 2.2.2 Neurons . . . . . . . . . 2.2.3 Network Architecture . . 2.2.4 Learning . . . . . . . . . 2.2.5 Fields of Application . . 2.2.6 Example Applications . 2.3 Neural Network Types . . . . . 2.3.1 Overview . . . . . . . . 2.3.2 Perceptron . . . . . . . . 2.3.3 ADALINE, MADALINE 2.3.4 Backpropagation . . . . 2.3.5 Hopfield . . . . . . . . . 2.3.6 ART . . . . . . . . . . . 2.3.7 Cascade Correlation . . 2.4 Neural Networks in Hardware . 2.5 FPGA Implementations . . . .
. . . . . . . . . . . . . . . . . .
. . . . . . . . . . . . . . . . . .
. . . . . . . . . . . . . . . . . .
. . . . . . . . . . . . . . . . . .
. . . . . . . . . . . . . . . . . .
. . . . . . . . . . . . . . . . . .
. . . . . . . . . . . . . . . . . .
. . . . . . . . . . . . . . . . . .
. . . . . . . . . . . . . . . . . .
. . . . . . . . . . . . . . . . . .
. . . . . . . . . . . . . . . . . .
. . . . . . . . . . . . . . . . . .
. . . . . . . . . . . . . . . . . .
. . . . . . . . . . . . . . . . . .
15 15 17 17 17 18 19 21 22 23 23 23 24 26 27 28 29 29 32
3 Implementation Aspects 3.1 Neural Paradigms . . . . . . . . . . . . . . . . 3.2 Implementation Alternatives . . . . . . . . . . 3.2.1 Overview . . . . . . . . . . . . . . . . 3.2.2 Direct Implementation . . . . . . . . . 3.2.3 Reducing Number of Multipliers . . . . 3.2.4 Reducing Number of Layers . . . . . . 3.2.5 One Neuron each Layer . . . . . . . . . 3.2.6 Reducing again Number of Multipliers
. . . . . . . .
. . . . . . . .
. . . . . . . .
. . . . . . . .
. . . . . . . .
. . . . . . . .
. . . . . . . .
. . . . . . . .
. . . . . . . .
. . . . . . . .
. . . . . . . .
. . . . . . . .
. . . . . . . .
35 35 37 37 40 41 43 44 46
. . . . . . . . . . . . . . . . . .
8
. . . . . . . . . . . . . . . . . .
. . . . . . . . . . . . . . . . . .
. . . . . . . . . . . . . . . . . .
. . . . . . . . . . . . . . . . . .
. . . . . . . . . . . . . . . . . .
. . . . . . . . . . . . . . . . . .
Contents
3.3
3.4
9
3.2.7 Reducing again Number of Layers . . . . . . . . 3.2.8 Selection of the Architecture for Implementation Data Discretisation . . . . . . . . . . . . . . . . . . . . 3.3.1 Overview . . . . . . . . . . . . . . . . . . . . . 3.3.2 Discrete Values in the Network Definition File . 3.3.3 Signal Discretisation and Bias . . . . . . . . . . 3.3.4 Weight Discretisation and Scaling . . . . . . . . 3.3.5 Neuron Discretisation . . . . . . . . . . . . . . . 3.3.6 Sigmoid Function in Hardware . . . . . . . . . . Summary . . . . . . . . . . . . . . . . . . . . . . . . .
4 Hardware Architecture 4.1 Introduction . . . . . . . . . . . . . . . . 4.1.1 Overview . . . . . . . . . . . . . 4.1.2 Network Construction . . . . . . 4.1.3 Generic Network Parameters . . . 4.1.4 Design Considerations . . . . . . 4.2 Layer . . . . . . . . . . . . . . . . . . . . 4.2.1 Overview . . . . . . . . . . . . . 4.2.2 Neuron . . . . . . . . . . . . . . . 4.2.3 Memory Wrappers . . . . . . . . 4.2.4 Control Logic . . . . . . . . . . . 4.3 Neural Network . . . . . . . . . . . . . . 4.3.1 Overview . . . . . . . . . . . . . 4.3.2 Global Controller and Protocol . 4.3.3 Memory Structure . . . . . . . . 4.4 Moptin-Net . . . . . . . . . . . . . . . . 4.4.1 Overview . . . . . . . . . . . . . 4.4.2 Weight Memory Access . . . . . . 4.4.3 Evaluation . . . . . . . . . . . . . 4.5 Serial-Net . . . . . . . . . . . . . . . . . 4.5.1 Overview . . . . . . . . . . . . . 4.5.2 Serial Protocol . . . . . . . . . . 4.5.3 TX Block and Reply-ROM . . . . 4.5.4 RX DATA and RX COMMANDS 4.5.5 Control Logic . . . . . . . . . . . 4.5.6 UART Block . . . . . . . . . . . 4.5.7 Evaluation . . . . . . . . . . . . . 4.6 Toolchain . . . . . . . . . . . . . . . . . 4.6.1 Overview . . . . . . . . . . . . . 4.6.2 JavaNNS . . . . . . . . . . . . . . 4.6.3 CNSIM . . . . . . . . . . . . . .
. . . . . . . . . . . . . . . . . . . . . . . . . . . . . . . . . . . . . . . . . . . . . . . . . . . . . . . . . . . . . . . . . . . . . . . . . . . . . . . . . . . . . . . . Blocks . . . . . . . . . . . . . . . . . . . . . . . . . . . .
. . . . . . . . . . . . . . . . . . . . . . . . . . . . . .
. . . . . . . . . . . . . . . . . . . . . . . . . . . . . .
. . . . . . . . . . . . . . . . . . . . . . . . . . . . . .
. . . . . . . . . . . . . . . . . . . . . . . . . . . . . .
. . . . . . . . . .
. . . . . . . . . . . . . . . . . . . . . . . . . . . . . .
. . . . . . . . . .
. . . . . . . . . . . . . . . . . . . . . . . . . . . . . .
. . . . . . . . . .
. . . . . . . . . . . . . . . . . . . . . . . . . . . . . .
. . . . . . . . . .
. . . . . . . . . . . . . . . . . . . . . . . . . . . . . .
. . . . . . . . . .
. . . . . . . . . . . . . . . . . . . . . . . . . . . . . .
. . . . . . . . . .
. . . . . . . . . . . . . . . . . . . . . . . . . . . . . .
. . . . . . . . . .
. . . . . . . . . . . . . . . . . . . . . . . . . . . . . .
. . . . . . . . . .
47 48 51 51 52 52 53 54 54 56
. . . . . . . . . . . . . . . . . . . . . . . . . . . . . .
57 57 57 58 58 59 61 61 62 63 63 66 66 67 68 70 70 71 71 72 72 73 80 81 81 81 83 86 86 88 89
Contents 4.6.4
10 CNCONV . . . . . . . . . . . . . . . . . . . . . . . . . . . . . 92
5 Evaluation 5.1 Performance of the Hardware Architecture . 5.1.1 Overview . . . . . . . . . . . . . . . 5.1.2 Neural Network . . . . . . . . . . . . 5.1.3 UART Interface . . . . . . . . . . . . 5.2 Comparison with Fuzzy Pattern Classifier . 5.2.1 Overview . . . . . . . . . . . . . . . 5.2.2 Fuzzy Pattern Classification . . . . . 5.2.3 Evaluation Example . . . . . . . . . 5.2.4 Neural Network Implementation . . . 5.2.5 Classification Performance . . . . . . 5.2.6 Hardware Costs and Operation Speed 5.2.7 Training Process . . . . . . . . . . . 5.2.8 Summary . . . . . . . . . . . . . . .
. . . . . . . . . . . . .
. . . . . . . . . . . . .
. . . . . . . . . . . . .
. . . . . . . . . . . . .
. . . . . . . . . . . . .
. . . . . . . . . . . . .
. . . . . . . . . . . . .
. . . . . . . . . . . . .
. . . . . . . . . . . . .
. . . . . . . . . . . . .
. . . . . . . . . . . . .
. . . . . . . . . . . . .
. . . . . . . . . . . . .
. . . . . . . . . . . . .
96 96 96 96 97 100 100 101 103 105 105 108 108 110
6 Conclusion
111
Bibliography
113
A Appendix
118
List of Figures
2.1 2.2 2.3 2.4 2.5 2.6 2.7 2.8 2.9 2.10 2.11 2.12 2.13 2.14 2.15
Schematic drawing of biological neurons . . . . . . . . . . . . . . Neuron structure . . . . . . . . . . . . . . . . . . . . . . . . . . . Neural network architectures . . . . . . . . . . . . . . . . . . . . . Perceptron neuron . . . . . . . . . . . . . . . . . . . . . . . . . . Linear separable problems . . . . . . . . . . . . . . . . . . . . . . ADALINE neuron as adaptive filter . . . . . . . . . . . . . . . . . MADALINE . . . . . . . . . . . . . . . . . . . . . . . . . . . . . . Complex contiguous classification areas . . . . . . . . . . . . . . . Disjointed complex classification areas . . . . . . . . . . . . . . . Associative pattern completion . . . . . . . . . . . . . . . . . . . Hopfield network . . . . . . . . . . . . . . . . . . . . . . . . . . . ART network . . . . . . . . . . . . . . . . . . . . . . . . . . . . . Cascade Correlation network . . . . . . . . . . . . . . . . . . . . . General architecture for 1st order network with multiplexed layers Generic neuron with microprogrammable data route . . . . . . . .
. . . . . . . . . . . . . . .
. . . . . . . . . . . . . . .
16 18 20 24 24 25 25 26 27 27 28 29 30 32 33
3.1 3.2 3.3 3.4 3.5 3.6 3.7 3.8 3.9 3.10
Workflow of neural network design . . . . . . . . . . . . . Generic Network Model . . . . . . . . . . . . . . . . . . . Letters Network Model . . . . . . . . . . . . . . . . . . . . Implementation variant: Direct . . . . . . . . . . . . . . . Implementation variant: 1 multiplier per neuron . . . . . . Implementation variant: One layer . . . . . . . . . . . . . Implementation variant: One parallel neuron each layer . . Implementation variant: One sequential neuron each layer Implementation variant: One neuron . . . . . . . . . . . . Sigmoid function for hardware implementation . . . . . . .
. . . . . . . . . .
. . . . . . . . . .
. . . . . . . . . .
. . . . . . . . . .
. . . . . . . . . .
. . . . . . . . . .
36 39 39 40 42 43 45 46 47 54
4.1 4.2 4.3 4.4 4.5
Hardware architecture hierarchy . Block diagram Layer . . . . . . . Block diagram Neuron . . . . . . Workflow of one processing cycle Block diagram Neural Network .
. . . . .
. . . . .
. . . . .
. . . . .
. . . . .
. . . . .
57 61 62 65 66
11
. . . . .
. . . . .
. . . . .
. . . . .
. . . . .
. . . . .
. . . . .
. . . . .
. . . . .
. . . . .
. . . . .
. . . . .
. . . . .
. . . . .
List of Figures
12
4.6 4.7 4.8 4.9 4.10 4.11 4.12 4.13 4.14 4.15 4.16 4.17 4.18 4.19
Signal chronology for Neural Network Global Controller Weight RAM memory structure . . . . . . . . . . . . . Block diagram Moptin-Net . . . . . . . . . . . . . . . . Block diagram Serial-Net . . . . . . . . . . . . . . . . . Block diagram UART Interface . . . . . . . . . . . . . Frame structure serial protocol . . . . . . . . . . . . . Available frame types serial protocol . . . . . . . . . . Possible serial protocol transitions . . . . . . . . . . . . Data packet examples for 15 data bits . . . . . . . . . . Toolchain for network implementation process . . . . . JavaNNS screenshot . . . . . . . . . . . . . . . . . . . Program flow for CNSIM . . . . . . . . . . . . . . . . . CNCONV tool cascade to generate all requested files . Program flow for CNCONV tool family . . . . . . . . .
. . . . . . . . . . . . . .
. . . . . . . . . . . . . .
. . . . . . . . . . . . . .
. . . . . . . . . . . . . .
. . . . . . . . . . . . . .
. . . . . . . . . . . . . .
. . . . . . . . . . . . . .
. . . . . . . . . . . . . .
67 69 70 72 73 73 74 75 76 87 89 91 93 94
5.1 5.2 5.3 5.4 5.5 5.6 5.7 5.8 5.9 5.10 5.11
Hardware costs for one-layered Neural Network . . . . . . . Example of two-dimensional membership function . . . . . . Example of two-dimensional class membership areas . . . . . Validation image for classifier comparison . . . . . . . . . . . Training images for the classifiers . . . . . . . . . . . . . . . Implemented Neural Networks for comparison with FPC . . Classification rate for Neural Networks and FPC . . . . . . . Classified validation image by the Fuzzy Pattern Classifier . Classified validation image by the Neural Network 3-4-NN . Classified validation image by the Neural Network 3-3-4-NN Different behaviour in training for neural networks and FPC
. . . . . . . . . . .
. . . . . . . . . . .
. . . . . . . . . . .
. . . . . . . . . . .
. . . . . . . . . . .
98 101 102 104 104 105 106 106 107 107 110
List of Tables
2.1
Selection of neural network types . . . . . . . . . . . . . . . . . . . . 23
3.1 3.2
Abbreviations in hardware and speed Tables . . . . . . . . . . . . . . 38 Implementation alternatives . . . . . . . . . . . . . . . . . . . . . . . 49
4.1 4.2 4.3 4.4 4.5 4.6 4.7
Network generics . . . . . . . . . . . . . . . . . . . . . . . . . . . Bank Select signal for Neural Network input buffer . . . . . . . . Signals for weight memory access . . . . . . . . . . . . . . . . . . MSB for received blocks in serial communication . . . . . . . . . . Exemplary clock cycles for one calculation cycle in the Serial-Net Exemplary clock cycles for weight loading in the Serial-Net . . . . CNCONV tool family . . . . . . . . . . . . . . . . . . . . . . . . .
. . . . . . .
. . . . . . .
60 67 71 76 84 84 92
5.1 5.2 5.3 5.4 5.5 5.6
Typical maximum operation speed of Neuron and Neural Network Generics of the UART Interface and their Serial-Net counterparts Performance evaluation of the UART Interface . . . . . . . . . . . Data widths for Neural Networks 3-4-NN and 3-3-4-NN . . . . . Hardware costs and FPGA for Neural Networks and FPC . . . . . Operation speed for Neural Networks and FPC . . . . . . . . . .
. . . . . .
. . . . . .
97 99 99 105 108 108
A.1 Compiler and tools used for building CNSIM . . . . . . . . . . . . . . 129 A.2 Default data widths in CNSIM . . . . . . . . . . . . . . . . . . . . . . 132
13
1 Introduction
Neural networks are able to learn how to solve new tasks. Unlike traditional problem solution methods, no explicit algorithm must be derived. On this account, the neural network approach is very successful in areas which are difficult to describe in an algorithmic manner. In particular, classification tasks fall into this category. Until now, neural networks were not used in the professorship of circuit and systems design. This work was initiated to evaluate the neural approach and compare it to other classification methods. First, the broad field of neural networks has to be investigated and a suitable architecture selected. Then a generic hardware implementation must be created and compared to the Fuzzy Pattern Classifier. In addition to the hardware implementation, the whole neural network design process should be covered. Chapter 2 gives an overview about neural networks and available hardware implementations. The preparatory Chapter 3 develops several hardware architecture alternatives and selects one of them for subsequent implementation. A favourable data discretisation and general implementation aspects are also discussed. Chapter 4 develops the hardware implementation of the selected architecture and presents the toolchain for the neural network design process. The performance of the hardware implementation in respect to hardware costs and operation speed is evaluated in Chapter 5. Using one example problem, the neural network is compared to the Fuzzy Pattern Classifier. This work closes in Chapter 6 with a summary and an outlook.
14
2 Neural Networks
2.1 Overview Today’s computer can perform complicated calculations, handle complex control tasks and store huge amounts of data. However, there are classes of problems which a human can solve easily, but a computer can only process with high effort. Examples are character recognition, image interpretation or text reading. This kinds of problems have in common, that it is difficult to derive a suitable algorithm. Unlike computers, the human brain can adapt to new situations and enhance its knowledge by learning. It is capable to deal with incorrect or incomplete information and still reach the desired result. This is possible through adaption. There is no predefined algorithm, instead new abilities are learned. No theoretical background about the problem is needed, only representative examples. The neural approach is beneficial for the above addressed classes of problems. The technical realisation is called neural network or artificial neural network. They are simplified models of the central nervous system and consist of intense interconnected neural processing elements. The output is modified by learning. It is not the goal of neural networks to recreate the brain, because this is not possible with today’s technology. Instead, single components and function principles are isolated and reproduced in neural networks. The traditional problem solving approach analyses the task and then derives a suitable algorithm. If successful, the result is immediately available. Neural networks can solve problems which are difficult to describe in an analytical manner. But prior to usage, the network must be trained.
15
2.1 Overview
16
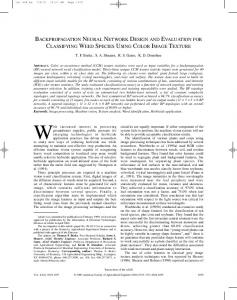
Biological Inspiration The model for the neural processing elements are nerve cells. A human brain consists of about 1011 of them. All biological functions—including memory—are carried out in the neurons and the connections between them. The basic structure of a neuron cell is given in Figure 2.1.
Figure 2.1 Schematic drawing of biological neurons [18, p. 1-8] Dendrites Cell Body Axon Synapse
Carry electric signals from other cells into the cell body Sum and threshold the incoming signals Signal transfer to other cells Contact point between axon and dendrites
Every neuron receives electrochemical impulses from multiple sources, like other neurons and sensor cells. The response is an electrical impulse in the axon which is transferred to other neurons or acting organs, such as muscles. Every neuron features about 100–10’000 connections. There are two types of synapses: excitatory and inhibitory The neural activity depends on the neuron’s intrinsic electric potential. Without stimulation, the potential rests at about −70 mV. It is increased (excitatory synapse) or decreased (inhibitory synapse) by the collected inputs. When the sum of all incoming potentials exceeds the threshold of the neuron, it will generate an impulse and transmit it over the axon to other cells.
2.2 Neural Network Fundamentals
17
The interaction and functionality of biological neurons is not yet fully understood and still a topic of active research. One theory about learning in the brain suggests metabolic growth in the neurons, based on increased activity. This is expected to influence the synaptic potential. A more detailed description about biological neurons can be found in [32] or [35].
2.2 Neural Network Fundamentals 2.2.1 Characteristics Learning Neural networks must be trained to learn an internal representation of the problem. No algorithm is needed. Generalisation By training with suitable samples also new (unknown) data can be processed correctly. Associative Storage Information is stored according to its content. Distributed Storage The redundant information storage is distributed over all neurons. Robustness Sturdy behaviour in the case of disturbances or incomplete inputs. Performance Massive parallel structure which is highly efficient.
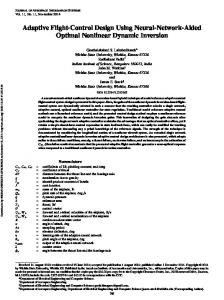
2.2.2 Neurons The neuron in neural networks is the equivalent to nerve cells in the central nervous system. A short outline only is given, more information can be found in [30] or [35]. Like the biological archetype, a neuron has an arbitrary number of inputs and one output. The structure is portrayed in Figure 2.2.
2.2 Neural Network Fundamentals
x1 x2 xn
18
x1
w1
x2
w2
xn
wn
y = ftrans
X
y
f trans
+
y
! xi wi + θ
i
Figure 2.2 Neuron structure
All inputs xi are multiplied by their weight value wi and summed up1 , supplemented by the bias value θ. The sum is then propagated via a transfer function ftrans to the output y. Common transfer functions fall into the following categories: Linear The simplest case. Examples are identity and linear function with saturation. Threshold A threshold function generates binary outputs. Unipolar or bipolar coding is possible. Another name is hard limit function. Sigmoid Functions in the sigmoid class are continuous, differentiable, monotone and have a limited co-domain, usually in the range of [0; 1] or [−1; 1]. Examples are logistic function and the sigmoid function itself.
2.2.3 Network Architecture The performance of neural networks originates from the connection of individual neurons to a network structure which can solve more complex problems than the single element.
1
Other mathematical operations are possible, but neural networks today nearly exclusively implement summation.
2.2 Neural Network Fundamentals
19
Following [35], it is possible to distinguish between two network topologies: • Feed-forward networks – First order – Second order • Feed-back networks They are illustrated in Figure 2.3. Feed-Forward Networks Feed-forward networks organise the neurons in layers. Connections are only allowed between neurons in different layers and must be directed toward the network output. Connections between neurons in the same layer are prohibited. Feed-forward networks of first order only contain connections between neighbouring layers. In contrast, second order networks permit connections between all layers. The network inputs form the input layer. This layer does not include real neurons and therefore has no processing ability. It only forwards the network inputs to other neurons. The output layer is the last layer in the network and provides the network outputs. Layers in between are called hidden layers, because they are not directly reachable from the outside. Feed-Back Networks Opposite to feed-forward, feed-back networks also allow connections from higher to lower layers and inside the same layer. In many cases, the organisation into layers is completely dropped.
2.2.4 Learning One of the basic features of neural networks is their learning ability. To obtain the expected result, the network must reach an internal representation of the problem. The learning rule describes how a network is trained with the available samples
2.2 Neural Network Fundamentals
Input Layer
20
Hidden Layers
Output Layer
Feed-Forward Network 1st Order
Feed-Forward Network 2nd Order
Feed-Back Network
Figure 2.3 Neural network architectures
2.2 Neural Network Fundamentals
21
to reach the desired internal representation. Various learning rules are detailed in literature, e. g. in [30] or [35]. Learning methods are subdivided into two classes: Supervised Learning Learning with teacher The network is trained with samples of input-output pairs. The learning is based on the difference between current and desired network output. Unsupervised Learning No teacher present The network is only trained with input samples, the desired output is not known in advance. Learning is based on self-organisation. The network autonomously divides the input samples into classes of similar values.
2.2.5 Fields of Application This Chapter outlines the most common application areas for neural networks. Explanations in more detail can be found in [28, p. 26ff] or [35, p. 12ff]. Classification Assign an input sample to one of the previous defined classes. Correlation Map an input sample to another sample at the output. Categorisation Or clustering. Autonomous division of the input samples into classes, based on similarities. The classes are not known in advance. Function Approximation An unknown function is defined by tuples of x and f (x). From these tuples, the network should learn a representation of the unknown function. Forecast Forecast of a future trend, based on past values. Optimisation Find a good solution in a pre-defined solution space, while taking boundary conditions into account. Associative Storage Store a number of samples in the network which are also recallable by incomplete or disturbed representations of themselves. Control Influence the system under control to reach a desired state.
2.2 Neural Network Fundamentals
22
2.2.6 Example Applications Today neural networks are used both in research and industry for varying applications. A representative selection is outlined here, more examples are given in common literature [5], [20], [28], [30]. XOR This is a demonstrative example which is often referred in literature. The network should learn the XOR function. NETtalk 1986 introduced in [39], this network learns to pronounce written texts. Face Recognition There are many applications in the field of image analysis. Face recognition is often used for person identification. Data Compression The network should learn an internal representation of the samples with less elements. The samples are used simultaneously as inputs and output reference values. Travelling Salesperson A travelling salesperson wants to visit all cities on his/her tour, while taking the shortest route possible. This is a typical optimisation problem. Cancer Diagnostics Detect cancer cells in urine samples and other tasks in the field of medical diagnostics. Asset Management Many financial institutions consult neural networks for foreign exchange dealings, stock purchases and portfolio management. Autonomous Car Using neural networks, a car can follow the course of the road without a driver. One example is “ALVINN” which is being developed at the Carnegie-Mellon University since 1986 [28, p. 239ff].
2.3 Neural Network Types
23
2.3 Neural Network Types 2.3.1 Overview There are many different neural network types which vary in structure, application area or learning method. Among them the networks in Table 2.1 should be presented here. They were selected according to their significance and to show the neural network variety. Table 2.1 Selection of neural network types Name Structure Learning Application ftrans
Neural network type Network structure Learning method Typical field of application Transfer function
Learning
Application
ftrans
Single neuron Single neuron
Supervised Supervised
Classification Classification
Threshold Threshold
Feed-forward
Supervised
Classification
Sigmoid
Feed-back Complex
Unsupervised Unsupervised
Associative Categorisation
Threshold Diverse
Feed-forward
Supervised
Classification
Any
Name
Structure
Perceptron ADALINE Backpropagation Hopfield ART Cascade Correlation
2.3.2 Perceptron The Perceptron neuron was introduced 1958 by Frank Rosenblatt [33]. It is the oldest neuronal model which was also used in commercial applications. Perceptrons could not be connected to multi-layered networks because their training was not possible yet. See also Chapter 2.3.4. The neuron itself implements a threshold function with binary inputs and outputs. It is depicted in Figure 2.4.
2.3 Neural Network Types
24
Figure 2.4 Perceptron neuron [30, p. 85]
Neuron training is possible with different supervised learning methods [8, p. 11ff], e. g. perceptron learning rule, Hebb rule or delta rule [30, p. 72ff]. The Perceptron can only handle linear separable problems [32, p. 60f]. Graphically speaking, the problems are separated by a line for 2 inputs or by a plane for 3 inputs, as visualised in Figure 2.5.
2.3.3 ADALINE, MADALINE The ADALINE is also a single neuron which was introduced 1960 by Bernhard Widrow. “ADALINE” stands for “Adaptive Linear Neuron” and “Adaptive Linear Element”, respectively. 2D
3D
��������������� �������������������������������������������������� ��������������� ��������������� �������������������������������������������������� ��������������� ��������������� �������������������������������������������������� ��������������� ��������������� �������������������������������������������������� ��������������� Figure 2.5 Linear separable problems
2.3 Neural Network Types
25
The ADALINE neuron implements a threshold function with bipolar output. Later it was enhanced to allow continuous outputs. Inputs are usually bipolar, but binary or continuous inputs are also possible. In functionality it is comparable to the Perceptron. The major field of application is adaptive filtering, as shown in Figure 2.6. The neuron is trained with the delta rule [30, S. 92ff]. 1 w1
xk D x k−1
w0
w2 D
x k−n
y
wn
Figure 2.6 ADALINE neuron as adaptive filter
MADALINE “MADALINE” spells “Many ADALINEs” – many ADALINEs whose outputs are combined by a mathematical function. This approach is visualised in Figure 2.7. MADALINE is no multi-layered network, because the connections do not carry weight values. Still, through the combination of several linear classification borders more complex problems can be handled. The resulting area shape is presented in Figure 2.8.
Figure 2.7 MADALINE [30, p. 99]
2.3 Neural Network Types
26
Figure 2.8 Complex contiguous classification areas [30, p. 102] (translated by author)
The MADALINE training is explained in [28, p. 120ff].
2.3.4 Backpropagation The most popular neural network type is the Backpropagation network. It is widely used in many different fields of application and has a high commercial significance. Backpropagation was first introduced by Paul Werbos in 1974 [44]. Until then it was impossible to deal with disjointed complex classification areas, like the ones in Figure 2.9. For this purpose hidden layers are needed, but no training method was available. The Backpropagation algorithm now enables training of hidden layers. The term “Backpropagation” names the network topology and the corresponding learning method. In literature, the network itself is often called “Multi-Layer Perceptron Network”. The Backpropagation network is a feed-forward network of either 1st or 2nd order. The neuron type is not fixed, only a sigmoid transfer function is required. The Backpropagation training method is detailed in [16, p. 93ff] or [20, p. 86f]. It is based on recursive error back-propagation through the network. The individual error portions of every neuron are calculated and then the weights are adjusted accordingly.
2.3 Neural Network Types
27
Figure 2.9 Disjointed complex classification areas [30, p. 102] (translated by author)
Standard Backpropagation learns very slow and possibly reaches only a local minimum. Therefore variants exist which try to improve certain aspects of the algorithm [18, Chapter 12], [35, p. 79ff].
2.3.5 Hopfield The Hopfield network was presented 1982 by John Hopfield [22]. It is the most popular neural network for associative storage. It memorises a number of samples which can also be recalled by disturbed versions of themselves. This is exemplarily depicted in Figure 2.10.
Figure 2.10 Associative pattern completion [35, p. 129] (translated by author)
2.3 Neural Network Types
28
The structure is sketched in Figure 2.11. It is a feed-back network, where every neuron is connected to all other neurons. The connection weights between two neurons are equal in both directions. The neuron implements a binary or bipolar threshold function. The input and output co-domains match the threshold function type.
Figure 2.11 Hopfield network
Learning is possible by calculating the weight values according to the Hopfield learning rule [35, p. 129ff].
2.3.6 ART Adaptive Resonance Theory (ART) is a group of networks which have been developed by Stephen Grossberg and Gail Carpenter since 1976. ART networks learn unsupervised by subdividing the input samples into categories. Most unsupervised learning methods suffer the drawback that they tend to forget old samples, when new ones are learned. In contrast, ART networks identify new samples which do not fit into an already established category. Then a new category is opened with the sample as starting point. Already stored information is not lost. The disadvantage of ART networks is their high complexity which arises from the elaborate sample processing. The structure is presented in Figure 2.12. Various versions of ART networks exist which differ in structure, operation and input value co-domain [35, p. 109]. Further information about ART can be found in [20, p. 119ff] or [35, p. 108ff].
2.4 Neural Networks in Hardware
29
Figure 2.12 ART network [18, p. 16-3]
2.3.7 Cascade Correlation The Cascade Correlation network was developed in 1990 by Scott E. Fahlman and Christian Lebiere [13]. It is an example of a growing network structure. Usually it is difficult to find a suitable network structure for a given problem. In the majority of cases try-and-error is used, possibly supported by heuristic methods. In Cascade Correlation networks the structure is part of the training process. Starting from the minimal network, successive new neurons are added in hidden layers. The new neurons are trained while previously learned weights are kept [35, p. 143ff]. The overall network structure is feed-forward 2nd order as depicted in Figure 2.13.
2.4 Neural Networks in Hardware For the development of neural networks software simulators are sufficient. On the other hand, in production use computer based simulation is not always acceptable.
2.4 Neural Networks in Hardware
30
Figure 2.13 Cascade Correlation network [28, p. 342] (translated by author)
Compared to software simulation, hardware implementation benefits from the following points: • Higher operation speed by exploring intrinsic parallelities • Reduced system costs in high volume applications • In stand-alone installments no PC needed for operation • Optimisation toward special operation conditions possible, e. g. small size, low power, hostile environment The highly interconnected nature of neural networks prohibits direct structure mapping to hardware for all but very small networks. Direct mapping also requires many processing elements. In particular, one multiplier for each neuron input. Alternative approaches are required to reduce connections and hardware costs. Classification It is possible to split up the hardware approaches into two groups: • Fixed network structure in hardware, targeting one particular task • Flexible neurocomputer, suitable for many different network types and structures
2.4 Neural Networks in Hardware
31
Another division follows the appearance of the implementation [9]: Neurocomputers as complete computing systems based on neural network techniques PC Accelerator Boards to speed up calculations in PC, either accelerating the operation of a software simulator or as stand-alone neural network PC card Chips for system integration Cell Libraries/IP for System-On-Chip (SoC) with the need for a neural network component Embedded Microcomputers implementing software neural networks FPGA as Hardware Base The traditional hardware approach leads to a fixed network structure. The implementations are usually small and fast, but some applications need more flexibility. Especially in the course of development it is advantageous to evaluate a number of different implementations. This can be achieved by using Field Programmable Gate Arrays (FPGAs) which are in-system reconfigurable. This reconfiguration feature can be exploited in a number of ways [47]: • Rapid prototyping of different networks and parameters • Build a multitude of neural networks and load the most appropriate one on startup • Recent FPGAs can be reconfigured at run time, this allows density enhancements by dynamic reconfiguration Usually time-multiplex of different processing stages (like learning and propagation) is performed. • Topology adaption at runtime or start-up is imaginable
2.5 FPGA Implementations
32
2.5 FPGA Implementations In literature only few FPGA implementations are mentioned, because it is a rather new topic. Internet research returned some works which are exemplarily presented here. Most of the papers were not suitable, because they covered some sort of “special approach”. Only self-contained FPGA implementations are portrayed which instantiate an entire neural network. In first order Backpropagation networks only connections between adjacent layers are allowed. On this basis, [6] implements only one network layer in hardware and executes calculation sequentially for each layer. The structure is given in Figure 2.14. The implementation also uses dynamic FPGA reconfiguration to divide the Backpropagation algorithm into different stages. The stages are then loaded successively into the FPGA to perform neural network calculation and training.
Figure 2.14 General architecture for 1st order network with multiplexed layers [6]
The Backpropagation learning algorithm is very versatile, but hardware implementation is difficult. A simpler gradient descent approach is simultaneous perturbation which is implemented in [24]. This method refrains from calculating directly the weight update values. Instead, it changes the weights by small random values and judges the effect toward the output error. The signals are pulse density coded. Results for ALTERA FLEX EPF10K250AGC599-3 FPGA: 3-layered network with 2 inputs, 2 hidden neurons and 1 output uses about 60’000 gates The practical limit of integration density usually is the number and complexity of multipliers, as well as the number of connecting wires between neurons. Stochastic computing techniques reduce in [4] both connections and the need for multipliers. Weights and signals are represented by stochastic bitstreams which use
2.5 FPGA Implementations
33
only one wire. Multiplication is possible with 2-input logic gates. The disadvantage is the slower processing speed, because stochastic bitstreams are very long. Results for Xilinx XC4000 FPGA: single layer neural network with 12 inputs and 10 outputs uses 100 Configurable Logic Blocks (CLBs) The Functional Spiking Neuron from [43] implements a biology-inspired neuron model. It uses neuron pulses instead of discrete values and hebbian weight learning. The pulse coding reduces the connections between neurons to one wire. Results for Xilinx Spartan II FPGA: 30-input neuron occupies 41 slices [1] describes automatic generation of various neural network types. The hardware base is a generic neuron with microprogrammable data route which is presented in Figure 2.15. A software tool generates the microprogram and HDL description of the neural network.
Figure 2.15 Generic neuron with microprogrammable data route [1]
The next paper implements a multi-layer feed-forward neural network using a vector based parallel programming model [17]. It models the neurons in C and derives a hardware structure from it. To build the entire system, a data flow graph has to be created and implemented using the neuron building blocks. The individual units are cascadable in a linear pipeline. A neural network emulator for binary neurons is build in [41]. A basic processor implements one neuron at a time, while the weights and inputs are processed
2.5 FPGA Implementations
34
bit-serially. The processors are arranged in a row and can implement parallel computation of 32 neurons with an arbitrary number of inputs. How the data and weights are presented to the network determines the simulated network type. The Hopfield network is a fully interconnected network, but in every cycle only one neuron is active. To reduce the number of connections, in [40] all connections are merged into one common data bus. Results for Xilinx Spartan-IIE with 10 MHz CLK: 16 neuron Hopfield network exhibits a typical tuning time of 50µs and a system size of about 16’000 gates Evaluation The presented implementations could not be used for this thesis, because no architecture satisfied all requirements. In addition the source code is not available. Performance valuation in advance was impossible too, because the provided results were not comparable. However, some ideas are incorporated in the implemented hardware architecture.
3 Implementation Aspects
3.1 Neural Paradigms Learning One of the most important properties of neural networks is their ability to learn. For hardware implementation, there are two different approaches to enable neural network learning: Either integrate one learning algorithm directly into the hardware (on-chip learning), or train the network independently from the hardware and just download the correct weight values (off-board learning). For better understanding of this decision one should consider the typical neural network design process which is shown in Figure 3.1: 1. To start with, design one neural network with guessed structure 2. Train the network with different training methods and various initial values 3. If the desired result was reached, either finish here or try to improve it 4. Change the network structure and continue with 2 Network training is a fundamental part of the design process. Computer support is always needed. On-chip learning only moves a small part of the whole process into hardware. This approach is only beneficial in a dedicated implementation, targeting a well-known class of problems. Otherwise it restricts the range of application. To keep the generic character of the hardware implementation, off-board learning was chosen.
35
3.1 Neural Paradigms
36
Guessed Structure
Train Network
Change Structure
No
Result OK?
Yes
Finished
Figure 3.1 Workflow of neural network design
Network Structure The targeted field of application is pattern classification. The most famous and most widely used pattern classification network is the Backpropagation network which was introduced in Chapter 2.3.4. It supports a wide range of training methods and has proven itself in numerous real-world applications. In lack of other suitable candidates the Backpropagation network was selected. Feed-forward networks of first order suffice for all applications, therefore it is not necessary to support second order networks. Neuron Transfer Function Backpropagation networks require a sigmoid transfer function. To allow network training with the software simulator JavaNNS (see Chapter 4.6.2), the logistic function from Formula 3.1 was adopted.
ftrans =
1 e−(N ET +θ)
1+ N ET : summed and weighted neuron inputs θ : bias value
(3.1)
3.2 Implementation Alternatives
37
Weight Storage There are two options how to store the weights in the neural network: • Define them in the design stage, i. e. weights are fixed after synthesis. • During operation, allow modification of the weights from outside the hardware implementation. This resembles “learning” in the network. Clearly the last option is in favour. Re-synthesis for every weight value change is not acceptable.
3.2 Implementation Alternatives 3.2.1 Overview In this Chapter several implementation alternatives are developed and judged. The starting point is the direct mapping of the network structure to hardware which offers maximum possible speed. Step by step the hardware resources are reduced through multiplexing on the cost of operation speed. The design is optimised from Chapter to Chapter, thus only the differences to the previous Chapter are mentioned. Evaluation Criteria The following aspects are investigated: Connections Number of connections between neurons Hardware Hardware costs in number of discrete elements: multipliers, sigmoid functions (abbreviated sigmoids), adders (with number of inputs) and estimated additional control hardware Speed Clock cycles for one complete calculation cycle (latency), pipelining when possible with maximum throughput in the pipeline (pipeline delay) Bandwidth Maximum number of weights accessed simultaneously
3.2 Implementation Alternatives
38
Model Networks To valuate the amount of needed hardware and execution speed, two different neural networks are presented.
GEN The Generic Network Model from Figure 3.2 is a feed-forward network of 1st order with l uniform layers (hidden and output), n neurons each layer and n inputs, giving a total of N = l · n neurons in the network. This model is not very realistic, because usually the number of neurons differs between layers. But this uniform structure allows to develop numeric expressions for the evaluation parameters. The Generic Network Model always needs N · (1 + n) weight and bias memories.
LET The Letter Network Model from Figure 3.3 is a two layered feed-forward network of 1st order, designed for letter recognition. It features 35 inputs (5 × 7 binary matrix), a hidden layer of 10 neurons and an output layer of 26 neurons (one neuron for each letter in the alphabet). The network is included in the JavaNNS distribution as letters.pat . The Letter Network Model always needs 646 weight and bias memories. For better comprehension, in the hardware and speed Tables the calculations are demonstrated layer by layer. To save space, the abbreviations in Table 3.1 are used.
The graphical representation of the network structure uses a network with 5 inputs, 3 outputs and two hidden layers of 4 neurons each. Table 3.1 Abbreviations in hardware and speed Tables
Abbreviation B I NR O
Meaning Bias Input Neuron Output
3.2 Implementation Alternatives
39
Figure 3.2 Generic Network Model for n = 5 and l = 4
Inputs
Outputs Figure 3.3 Letters Network Model
3.2 Implementation Alternatives
40
3.2.2 Direct Implementation The first approach is to simply recreate the neural network structure in hardware, including all connections between neurons. The design is trivial, as displayed in Figure 3.4.
Figure 3.4 Implementation variant: Direct
Connections GEN: N · n connections LET: 610 connections
Hardware
GEN LET
Multipliers N ·n 35 I · 10 NR+ 10 I · 26 NR = 610
Sigmoids N 10 NR + 26 NR = 36
No additional hardware needed
Adders N (1+n)-input 10 36-input, 26 11-input
3.2 Implementation Alternatives
41
Speed This implementation has no sequential logic and works without a clock line. The speed depends only on wire and gate delay times.
Bandwidth All weights accessed simultaneously
3.2.3 Reducing Number of Multipliers The direct implementation from last Chapter needs a high number of multipliers and connections. Multipliers are hardware-expensive, but their number can be reduced by sharing one multiplier for all incoming connections in every neuron. Consequently, each neuron only processes one input value every clock cycle. Now all neurons in one layer serially process all outputs from the previous layer. In a second step all connections between layers are replaced by busses and the outputs are transmitted serially. The resulting structure is depicted in Figure 3.5. The bias value is stored as a weight value, multiplied by an additional pseudo-input which is always ’1’.
Connections GEN: l busses LET: 2 busses
Hardware
GEN LET
Multipliers N 10 NR + 26 NR = 36
Sigmoids N 10 NR + 26 NR = 36
Adders N 2-input 36 2-input
3.2 Implementation Alternatives
42
Figure 3.5 Implementation variant: 1 multiplier per neuron
Additional control logic and primitive elements for the neurons are needed.
Speed This implementation—and all following—require a clock line.
GEN LET
Latency (n + 1) · l (35 I + 1 B) + (10 I + 1 B) = 47
Bandwidth GEN: N weights accessed simultaneously LET: 36 weights accessed simultaneously
Pipeline Delay n+1 35 I + 1 B = 36
3.2 Implementation Alternatives
43
3.2.4 Reducing Number of Layers The implementation proposed in the last Chapter gives a good result when used in a pipeline. Without pipelining, in every processing cycle only one layer is active. The others are idle. When no pipelining is needed, the network can be reduced to one layer with maximum width. This single layer calculates the whole network in time-multiplex. It buffers the output values and feeds them again into the layer as inputs. The resulting structure in Figure 3.6 is similar to the implementation described in [6].
Input MUX
Figure 3.6 Implementation variant: One layer
Connections GEN: 1 bus LET: 1 bus
3.2 Implementation Alternatives
44
Hardware
GEN LET
Multipliers n 26 NR
Sigmoids n 26 NR
Adders n 2-input 26 2-input
Additional control logic needed
Speed
GEN LET
Latency (n + 1) · l (35 I + 1 B) + (10 I + 1 B) = 471
No pipelining possible
Bandwidth GEN: n weights accessed simultaneously LET: 26 weights accessed simultaneously
3.2.5 One Neuron each Layer Starting again from the direct implementation in Chapter 3.2.3, there is another way to reduce hardware costs. Instead of multiplexing the layers as in Chapter 3.2.4, it is also possible to keep the number of layers and multiplex the neurons in each layer. This architecture is sketched in Figure 3.7. Each layer consists of only one neuron which receives all inputs in parallel from the previous layer. It then calculates all output values in sequence.
1
In networks without uniform structure redundant calculations are skipped.
3.2 Implementation Alternatives
45
Figure 3.7 Implementation variant: One parallel neuron each layer
Connections GEN: (n + 1) · l connections LET: 47 connections
Hardware
GEN LET
Multipliers N 35 I + 10 I = 45
Sigmoids l 2 NR
Adders l (1+n)-input 1 36-input, 1 11-input
Global control logic needed
Speed
GEN LET
Latency N 10 O + 26 O = 36
Pipeline Delay n 26 O
Bandwidth GEN: (n + 1) · l weights accessed simultaneously LET: 47 weights accessed simultaneously
3.2 Implementation Alternatives
46
3.2.6 Reducing again Number of Multipliers The architecture from last Chapter exhibits one serious drawback: The neurons simultaneously access all memory locations of the input memory. This is impossible to implement with a standard RAM. Another approach is to use a conventional RAM and to avoid simultaneous access. This leads to one multiplier per neuron. The architecture is given in Figure 3.8.
Figure 3.8 Implementation variant: One sequential neuron each layer
Connections GEN: 2 · l connections LET: 4 connections
Hardware
GEN LET
Multipliers l 2 NR
Sigmoids l 2 NR
Global control logic needed
Adders l 2-input 2 2-input
3.2 Implementation Alternatives
47
Speed
GEN LET
Latency N · (n + 1) 10 O · (35 I + 1 B)+ 26 O · (10 I + 1 B) = 646
Pipeline Delay n · (n + 1) 10 O · (35 I + 1 B) = 360
Bandwidth GEN: l weights accessed simultaneously LET: 2 weights accessed simultaneously
3.2.7 Reducing again Number of Layers The last possible step for further reducing hardware is to abandon pipelining again and to reduce the number of implemented layers to one. Like in Chapter 3.2.4, all layers in the network are processed in time-multiplex. This reduces the whole network to one real neuron which performs all calculations. It is the slowest possible implementation in all presented alternatives. The architecture is sketched in Figure 3.9.
Input MUX
Figure 3.9 Implementation variant: One neuron
3.2 Implementation Alternatives
48
Connections Always 1 feed-back
Hardware
Always
Multipliers 1 NR
Sigmoids 1 NR
Adders 1 2-input
Global control logic needed
Speed
GEN LET
Latency N · (n + 1) 10 O · (35 I + 1 B) + 26 O · (10 I + 1 B) = 646
No pipelining possible
Bandwidth Always 1 weight accessed simultaneously
3.2.8 Selection of the Architecture for Implementation The decision for a specific architecture depends on a number of aspects. Most of them can only be determined with a certain problem at hand. However, the choice can be guided by stating a design goal and exclude inappropriate architectures. The alternatives in question are collected in Table 3.2. The “one neuron each layer”implementation described in Chapter 3.2.5 was already excluded, because it requires simultaneous access to all memory locations.
3.2 Implementation Alternatives
49
Table 3.2 Implementation alternatives Chapter Mult Con Speed WB Structure
Chapter and implementation name Number of multipliers Number of connections between neurons, ’B’ for bus Operation speed in clock cycles If pipelining is possible the throughput is given after a slash. Weight bandwidth Sketched structure of the architecture
The numbers given in the Table are taken from the Letter Network Model
Chapter
Mult
Con
Speed
WB
610
610
No clock
646
3.2.3 Bus as data path
36
2B
47/36
36
3.2.4 One layer
26
1B
47
26
3.2.6 One neuron each layer
2
4
646/360
2
3.2.7 One neuron
1
1
646
1
3.2.2 Direct
Structure
3.2 Implementation Alternatives
50
Exclude Inappropriate Architectures The direct implementation mentioned in Chapter 3.2.2 is excluded because of the unreasonable amount of connections and multipliers. Real-world applications would be impossible to implement. For example, the NETtalk network [39] would require 32’400 connections between neurons and the same number of multipliers. The next architecture to exclude is described in Chapter 3.2.3—using a bus as data path but keeping the layers as they are—in favour of the “one layer” implementation from Chapter 3.2.4. The reason is that neural networks usually have a low depth, in most cases only two layers. This type of architecture is already very fast, so that the further speed-up gainable by pipelining is only marginal in absolute numbers. On the other hand the additional hardware costs are high. It should be noted that pipelining can still be obtained by using multiple “one layer” networks in a row. Design Goal Evaluation To quote Table 3.2, there are three alternatives left: No. 1 2 3
Chapter 3.2.4 One layer 3.2.6 One neuron each layer 3.2.7 One neuron
Mult 26 2 1
Con 1B 4 1
Speed 47 646/360 646
WB 26 2 1
In respect to the design goal, it is possible to confront hardware costs with operation speed. In this work it was favoured to minimise the hardware costs along with accepting slower operation speed for a number of reasons: • The generic implementation will be used as a macro, usually only one block in a bigger design. Selecting a small implementation leaves more space for other functionality in the FPGA. • Without speed constraints the result of a speed optimised implementation is hard to judge. On the other hand there are always objective goals for a hardware-inexpensive design. • Using fewer hardware-expensive elements like multipliers enables implementation of these elements with more resources. In the end higher clock rates are possible.
3.3 Data Discretisation
51
It should be noted that the memory needed for a neural network only depends on the number of weights in the network1 . The amount of memory for a given network is independent from its hardware architecture. In preference for low hardware costs, alternative number 1 gets excluded. Finally, there are only two alternatives left. Number 3 has the least hardware costs, but also the slowest operation speed. Because neural networks usually have only few layers, at this point the additional hardware resources needed for alternative number 2 were accepted to improve the speed of the implementation. Again, if one prefers the least hardware-expensive version number 3, one can simply use only one layer of the selected architecture and add the multiplexing control logic by hand2 . Following the reasoning in this Chapter the “one neuron each layer” - architecture from Chapter 3.2.6 was chosen for hardware implementation.
3.3 Data Discretisation 3.3.1 Overview Most software simulators use floating point values for neural network calculation. This is not suitable for hardware implementation, because floating point computations are hardware-expensive. Fixed point data is preferred for fast and resource efficient hardware implementations [25]. Other approaches like stochastic data representation or spiking neurons (see Chapter 2.5) were not further pursued, because they represent “special solutions” for a particular domain. In a neural network 3 different types of data can be distinguished. This is first the signal data, second the weight data and third the neuron data. Signal data refers to communication between the neurons and includes network 1
This is valid for every straight-forward hardware implementation. On the other hand one could imagine special architectures which e. g. eleminate small weights, thus reducing the amount of memory needed. 2 In the end, the decision for one architecture is an arbitrary choice supported by knowledge, because the architecture pairs presented can easily be transformed into each other with small additional hardware costs.
3.3 Data Discretisation
52
inputs and outputs. Weight data names the weight and bias values. Neuron data denotes the data type used for all calculations in the neuron. This Chapter addresses the fixed point representation of the data in the neural network. The size of the data types depends on the application and network structure, therefore it is impossible to identify fixed values in advance. It is only clear, that an over- or underflow of a fixed point number should always lead to saturation. Wrap-around should never occur. Since it is closely connected to data quantisation, a feasible hardware implementation of the sigmoid function will also be developed. The results presented in this Chapter were obtained by examining example networks. The values themselves and further details about the analysis are given in Appendix A.3.
3.3.2 Discrete Values in the Network Definition File The network description is imported from JavaNNS, as described in Chapter 4.6. The network file defines the structure, the weights and the bias values of the trained network. Unfortunately these values are rounded to 5 fraction digits, therefore introducing an error not exceeding 5 · 10−6 for every weight. The resulting maximum output error is usually below 10−4 and is therefore negligible. Neural networks are designed to work with disturbed data and still produce valid results. Beyond that, the following Chapters will show that the errors introduced by fixed point number representation are higher. To this extend, using JavaNNS’s network definition file as source for network construction does not constrain the whole design.
3.3.3 Signal Discretisation and Bias The co-domain of the sigmoid function is [0; 1], therefore the Signal data type only needs fraction bits and no sign. To convert other data to the Signal data type rounding is preferred.
3.3 Data Discretisation
53
In this scope, another question arises. For efficient storage the bias is treated as a weight which is multiplied by an input value of ’1’. It is stored as a signal value which only has fraction bits and therefore is always less than 1. This procedure introduces another small error which can be neglected by bypassing the multiplier. It is shown in Appendix A.3.4 that this is not always the better solution and in most cases the differences are negligible. Therefore the idea to skip multiplication for the bias was abandoned.
3.3.4 Weight Discretisation and Scaling Unlike signals, weights need integer bits and a sign. The number of integer bits is decided by the highest absolute weight value. The fraction bit count depends on the network and the maximum error allowed. Weight Scaling It is difficult to select fitting bit sizes, because usually not all weights in one network are in the same numerical range. Considering different weight sets for different problems complicate the decision even more. [19] suggests to scale the weights individually for each neuron and to undo the scaling in the sigmoid function. Following this approach, the weights for each neuron output are grouped and scaled together. The scaling factor is determined in the way, that the available weight bits are best utilized. To lower hardware costs scaling is only allowed in powers of two, reducing the unscaling operation to a shift with arbitrary range and direction. In the course of scaling the distinction between integer and fraction weight bits becomes superfluous and is dropped. The weights are now only characterised by total bit width. To ease implementation, all weight bits are considered to be fraction bits. Weight scaling always decreases the maximum error. There is no situation in which the original approach outperforms weight scaling. In addition weight scaling has only few additional hardware costs – namely storing the scaling factor and one shift in the sigmoid function. Therefore weight scaling was selected for hardware implementation. To convert the weights from floating point format rounding is preferred.
3.3 Data Discretisation
54
3.3.5 Neuron Discretisation The neuron performs multiply-and-accumulate operations. It is fed by the input signal and the weight values. The neuron also needs integer bits and a sign. Rounding is preferred for the input signal.
3.3.6 Sigmoid Function in Hardware The sigmoid function from Figure 3.10 is computionally expensive, therefore a direct hardware implementation is disfavoured. 1
1 sigm(x) = 1 + e−x
sigm
0.8 0.6 0.4 0.2 0
-4
-2
0 x
2
4
Figure 3.10 Sigmoid function for hardware implementation
[42] proposes a purely combinatorical implementation which combines small size, high speed and low error rate. Being combinatorical, it is well suited for FPGA implementation. First, MATLAB was used to calculate the real sigmoid values. After truncation, the boolean function for each binary digit was processed by a logic minimiser. From this paper the variant sig_337p was chosen, because it offers the highest accuracy of all proposed approximations. Sig_337p implements the sigmoid function for positive input signals with 3 integer and 3 fraction bits. The output is 7 fraction bits wide. Negative inputs are calculated from the symmetry of the sigmoid function: sigm(−x) = 1 − sigm(x)
(3.2)
3.3 Data Discretisation
55
Values exceeding the input range unconditionally lead to ’1’ in the output. [42] identified 0.17% as average error and 0.39% as maximum error, obtained by sampling 106 points of the function. In an example implementation the maxium error between direct calculation and the approximation was derived as 0.74%, ignoring input quantisation at this point. To reduce the error one more fraction bit was added which is set to ’1’ if the input value is equal or exceeds ’5’, otherwise it stays ’0’. This modified implementation should be called sig_338p and reduces the maximum error to 0.39% . Another error is introduced by quantisation of the input values. In the worst case a value in the middle of two quantisation steps is requested which raises the maximum error to 1.73%. Again, rounding of the sigmoid inputs leads to better results than truncation. The sigmoid implementation sig_338p accounts for a high part of the overall error. But still, a maximum absolute error of around 0.05 (right data type configurations assumed) is tolerable for classification tasks. Taking this into account, the sig_338p implementation was chosen. If a lower error is required, following the approach demonstrated in [42] a more precise version can be easily derived. At the same time, the need for rounding at the sigmoid inputs can be eleminated.
3.4 Summary
56
3.4 Summary Neural Paradigms Learning Off-board Network Structure Feed-forward network of first order Neurons Weighted sum with bias value, logistic transfer function Weight Storage Reloadable during operation Implementation Variant The “one neuron each layer” - architecture described in Chapter 3.2.6 was chosen for hardware implementation. Data Discretisation Data Type Fixed point Signal Discretisation Only fraction bits, unsigned, apply rounding Weight Discretisation Use weight scaling by power of two, only fraction bits, signed, apply rounding Neuron Discretisation Integer and fraction bits, signed, apply rounding Bias Storage Store in weight memory, multiply by ’1’ from pseudo-input Sigmoid function Sig_338p, apply input rounding
4 Hardware Architecture
4.1 Introduction 4.1.1 Overview As presented in Chapter 3.2.8, the “one neuron each layer” - architecture from Chapter 3.2.6 was selected for hardware implementation. All components needed for neural network construction are created in a generic way. The following Chapters describe the individual components according to the hierarchy shown in Figure 4.1.
Figure 4.1 Hardware architecture hierarchy
The innermost hierarchy block is a single network Layer, including the calculation Neuron and local control logic. Combining the Layers with global control logic and an interface to the outer world
57
4.1 Introduction
58
forms the Neural Network itself. Following the argumentation from Chapter 4.1.4, the Neural Network does not include memory elements, but exports the interface to all memories. Therefore the memory structure is explained. Because it is laborious to connect all memories to the network manually—especially in the course of verifying the implementation—the Moptin-Net was created. This abbreviation stands for “Memory-opted in Network” which is a Neural Network combined with simple memory elements. Currently they are synchron memories resembling Virtex BlockRAM in their behavior, but constructed using CLBs. The last level in hierarchy originates from the hardware base used for in-system verification. The Vibro-Boards from the professorship use a serial link for communication with a host computer. Therefore a Serial Interface—termed UART Interface—was implemented. Combining it with a Moptin-Net creates the Serial-Net. In this Chapter the different data types are labeled Signal, Weight and Neuron. This matter is explained in detail in Chapter 3.3. The port signal names mirror the names in the VHDL source files.
4.1.2 Network Construction The Neural Network defines many generics and instantiates a variable number of ports. Hence, a generic description of the toplevel entity is impractical. Instead, a collection of tools named CNCONV is used for automatic network construction. The neural network itself is designed using JavaNNS. Then CNSIM evaluates the network in limited fixed point precision and exports it in a format readable by CNCONV. The complete toolchain with description of the individual stages is depicted in Chapter 4.6, while an exemplary network generation process is detailed in Appendix A.5.
4.1.3 Generic Network Parameters The neural network hardware implementation is very flexible which is reflected by the multitude of generic parameters in the VHDL files. Most of them adjust the data widths used for calculation and storage.
4.1 Introduction
59
All generics from the toplevel network files are explained in Table 4.1. If a generic is not present in one network type, it is marked by a bar. Usually there is no need for setting the generics manually, because the correct values are entered automatically by the network construction tools.
4.1.4 Design Considerations It is expected that calculation takes up most time of each processing cycle and memory access times can be disregarded. Taking this into account, one calculation step should be performed each clock cycle. It is not known in advance which kind of memory elements are used with the Neural Network. For Virtex FPGA there are two reasonable choices: 1. FPGA-external asynchron memory 2. FPGA-internal synchron BlockRAM For smaller networks or FPGA which do not include memory, it is also possible to use CLBs for memory emulation. In this case, the designer can implement either synchron or asynchron memory. The problem arises, that asynchron memory returns its value after a certain set-up time, but synchron memory always introduces one clock cycle of delay. A design tailored to synchron memory can neglect memory set-up time in clock cycle consideration, because memory access can be interlaced. But such a design will fail with asynchron memory. On the other hand, when designing for asynchron memory the set-up time counts toward clock cycle length. Synchron memory can behave the same way, if it is driven by a clock rate much higher than the design clock rate. A synchron memory interface was chosen, because it allows a design with only one clock line. A suitable wrapper for asynchron memory consists only of few elements and is easily created. The interlaced memory access permits maximum clock rate. Secondary, in the majority of cases the usage of FPGA-integrated synchron memory elements is expected.
Table 4.1 Network generics
60
Serial-Net
Moptin-Net
Neural Network
Description
gSize_Signal
gSize_Signal
gSize_Signal
gSize_Weight gSize_Calc
gSize_Weight gSize_Calc
gSize_Weight gSize_Calc
gSize_Calc_Frac
gSize_Calc_Frac
gSize_Calc_Frac
gSize_Weight_ADR
gSize_Weight_ADR
–
gSize_Weight_LS
gSize_Weight_LS
–
gSize_Scale
gSize_Scale
gSize_Scale
Signal data width between neurons and network inputs/outputs, no sign and only fraction bits Weight data width, only fraction bits Neuron data width used for all calculations, two’s complement representation Number of fraction bits of gSize_Calc, the sign itself counts toward the integer bits Number of address lines for weight memory access Number of data lines for weight layer select signal Number of bits used for storing the weight scale factor, excluding the scale direction bit
gNet_In_Num gNet_In_Size gLayerM _Num
gLayer0_Num gLayer0_Size gLayerM _Num
gLayer0_Num gLayer0_Size gLayerM _Num
gLayerM _Size
gLayerM _Size
gLayerM _Size
gNet_Out_Num
gLayerN _Num
gLayerN _Num
gNet_Out_Size
gLayerN _Size
gLayerN _Size
gLayerCount
–
–
Number of network inputs Number of address lines for network input Number of outputs for network Layer M, present for all network Layers but the last one Number of address lines for Layer M output, present for all network Layers but the last one Number of network outputs, where N is the number of layers Number of address lines for network output, where N is the number of layers Number of network layers, excluding the input layer
4.2 Layer
61
4.2 Layer 4.2.1 Overview The network Layer transforms the Layer inputs and weight values to the Layer outputs. The calculation itself is performed by the embedded Neuron, while the Layer provides the data and stores the results. The block diagram with all elements is given in Figure 4.2.
Figure 4.2 Block diagram Layer
The building blocks are grouped together and explained in the following Chapters: Neuron The processing unit of the Layer Memory Wrappers wRAM and lRAM form the interface to the external attached memory elements Control Logic CC1, CC2 and lCON govern the other blocks in the Layer
Interface The Layer supplies address values to the previous Layer by poADR and expects the input data to arrive over piData in the next clock cycle. The previous Layer can also be the network input. Analogously the Layer accepts address values from the next Layer by piADR and returns the appropriate output over poData.
4.2 Layer
62
In each operation cycle, the current input values are requested, while the output values from the last operation cycle are presented at the output.
4.2.2 Neuron The Neuron presented in Figure 4.3 handles the computations in the Layer. It sequentially calculates all Layer outputs (out_erg) from the weights (in_w) and Layer inputs (in_sig).
Figure 4.3 Block diagram Neuron
The Neuron register responds to high-active synchron enable (ENA) and clear (CLR) signals.
Data Widths As marked in the Figure, the Neuron data width as well as Signal and Weight data widths are independently parameterisable. The values are inherited from the Neural Network toplevel entity.
Activation The Activation block implements the sigmoid transfer function and weight scaling, as described in Chapter 3.3.6 and 3.3.4.
4.2 Layer
63
4.2.3 Memory Wrappers wRAM The Weight RAM Wrapper concatenates the addresses generated by CC1 (low address part) and CC2 (high address part) to form the weight memory address and returns the respective weight value.
lRAM The Layer RAM Wrapper contains two memory elements to buffer the Layer outputs. In each processing cycle the new output values are written into one memory, while the other memory offers the results from the last processing cycle as Layer outputs. Between two processing cycles both memories are logically swapped by inverting the Bank Select signal BS. The first address place is reserved for the bias multiplication factor. The Signal data type is unsigned and has only fraction bits, thus no real One is available. On RESET the factor is set to All-’1’, because it is the highest representable value. The write address ADR_WT from CC2 is internally incremented by one to associate address ’0’ with the first input value. piADR from the next Layer is used verbatim. In Chapter 4.3.3 the memory structures of both lRAM and wRAM are further explained.
4.2.4 Control Logic 4.2.4.1 CC1 and CC2 The Control Counters CC1 and CC2 from Figure 4.2 are simple counter elements with a maximum value and enable-input. When the counter reaches its maximum, an overflow signal is asserted and the counter wraps to zero. Upon RESET the counter starts from zero. CC1 sweeps the Layer inputs, while CC2 sweeps the Layer outputs.
4.2 Layer
64
4.2.4.2 lCON The Layer Controller lCON drives all other blocks in the Layer and communicates with the Global Controller. See Chapter 4.3.2 for more information.
Interface to Global Controller Two signals manage the handshaking with the superior controller: Global Enable Input — Start signal for next processing cycle (piGE) The Layer Controller has to wait for Global Enable before the next processing cycle is started. Layer Finished Output — Current processing cycle finished (poLF) The Layer Controller sets Layer Finished to High when all Layer outputs are calculated.
Mode of Operation Each processing cycle is divided into the steps shown in Figure 4.4, initiated by the Layer Controller: 1. The Layer waits for Global Enable The Control Counters are both set to zero, Layer Finished set to one 2. Upon Global Enable the Bank Select signal BS is inverted and Layer Finished revoked 3. The Neuron register is cleared 4. The Neuron gets enabled and all inputs are swept by CC1 5. The Neuron gets disabled and the resulting value is scaled by the coded weight scale factor 6. The output of the sigmoid function is written into the Layer RAM and CC2 is incremented by one 7. If there are outputs left continue with 3, otherwise go to 1
4.2 Layer
65
CC1:=0, CC2:=0 LF:=1
GE=1?
Start
No
Yes Invert BS
LF:=0 Clear Register
Enable Neuron, Sweep all Inputs by CC1
Disable Neuron, Scale Result
Write Output
CC2:=CC2+1
No
Outputs left?
Yes
Figure 4.4 Workflow of one processing cycle
4.3 Neural Network
66
4.3 Neural Network 4.3.1 Overview The Neural Network itself is created by combining all Layers with a global controller and buffer for the network inputs, as depicted in Figure 4.5.
Figure 4.5 Block diagram Neural Network
A Layer RAM (see Page 63) is used as input buffer, because it permits treatment of both network inputs and outputs as memories. The block “BS Generator” drives the Bank Select signal BS for the input lRAM. It is inverted upon Global Enable (GE). The Global Controller gCON governs the entire Neural Network and handles the communication with the outer world. All memory connection ports and the Bank Select signal poBS are passed to the outside. If the network inputs should be directly written into the input buffer lRAM memory blocks, the correct memory bank can be identified by Table 4.2.
4.3 Neural Network
67
Table 4.2 Bank Select signal for Neural Network input buffer
Bank Select poBS ’0’ ’1’
Memory Bank selected for writing 1 2
The network inputs are also accessible through the data port piData_In, address port piADR_In and high-active write enable piWE. The network outputs are readable through data port poData_Out and address port piADR_Out. These signals map directly to the underlying memory elements in the Layer RAMs. No interface for weight value loading is integrated into the Neural Network. However, all memory elements are provided outside the network which enables access to all weight memories.
4.3.2 Global Controller and Protocol The Global Controller implements a handshaking protocol with the environment and governs all other blocks in the Neural Network. As denoted in Figure 4.5 the Neural Network communicates with the outside by the input signal piReady and the output signal poCycleDone. These signals are directly connected to the Global Controller. The Global Controller itself emits the Global Enable signal GE to all Layers and obtains Layer Finished (signals LFn) from all. Before processing the individual LF signals are logically conjugated to the signal and_LF. The signal chronology is visualised in Figure 4.6.
and_LF piReady poCycleDone GE RESET
Alternative A
Alternative B
Alternative C
Figure 4.6 Signal chronology for Neural Network Global Controller
4.3 Neural Network
68
In detail, the simple protocol performs this signal exchange: 1. The network is running, and_LF and GE are low The next network inputs and the last network outputs are accessible 2. The network finishes calculation, and_LF goes high 3. Global Controller waits for piReady to go high (if not already) piReady must have been low in the meantime 4. Global Controller sets GE to high for one clock cycle The Layers do invert their Bank Select signals and start the next processing cycle 5. poCyleDone goes to high and stays high, until piReady is revoked It is to note, that one processing cycle propagates the network values only from one Layer to the next. Thus a delay of as many processing cycles as network Layers present is introduced. Pipelining is implicitly enabled, the pipeline latency is determined by the slowest network Layer.
4.3.3 Memory Structure 4.3.3.1 Weight RAM The Weight RAM is organised into rows. Every row contains all weight values for one network output, the resulting matrix structure is depicted in Figure 4.7. There are unused memory cells when the column count is no multiple to the power of two. This could only be avoided by changing the whole weight memory access mechanism. The simple approach presented here was chosen, because in most cases the amount of available memory is no limiting factor. If a memory efficient implementation is needed, the Layer architecture must be modified.
4.3 Neural Network
Outputs 2 (from CC2), high 1 address part 0
69
Bias Value
Weight 1
Weight 2
Weight N
Scale Factor
Bias Value
Weight 1
Weight 2
Weight N
Scale Factor
0
1 2 N Inputs (from CC1), low address part
N+1
Figure 4.7 Weight RAM memory structure for N layer inputs Bias Value The bias value for the virtual Neuron. It will be multiplied by ’1’ and summed up. Weight n Weight value n; 1 ≤ n ≤ N Scale Factor The weight scale factor for this group of weights. Format: Unsigned number, scaling direction prepended, leading surplus bits are ignored Scaling direction (D): ’0’ - Perform right shift in Neuron Activation block ’1’ - Perform left shift in Neuron Activation block Example for 3 scaling bits (S) in 8 bit wide memory cell: ’000DSSS’ See Chapter 3.3.4 about weight scaling.
4.4 Moptin-Net
70
4.3.3.2 Layer RAM Each Layer RAM memory block stores a One for bias multiplication on address zero, followed by the Layer outputs. Therefore each memory block stores ’N+1’ elements for ’N’ Layer outputs.
4.4 Moptin-Net 4.4.1 Overview The Moptin-Net combines the Neural Network from Chapter 4.3 with all memory elements, removing the need (and the ports) for external ones. The structure is presented in Figure 4.8.
Figure 4.8 Block diagram Moptin-Net
In the automatic construction process synchron memory blocks are used which resemble Virtex BlockRAM in their behaviour. They are called sync_RAM in the implementation and simply RAM in the block diagram. Because all memories are embedded now, no direct weight access is possible anymore. Therefore a new interface is introduced for weight loading which is explained in the next Chapter. It is called Weight Loading. The other signals except for poBS are
4.4 Moptin-Net
71
forwarded verbatim from the Neural Network to the outside1 .
4.4.2 Weight Memory Access The weight memory access bus marked as Weight Access in Figure 4.8 breaks down to the signals explained in Table 4.3. Table 4.3 Signals for weight memory access
Signal piWeight_LS
piWeight piWeight_ADR
piWeight_WE
Description Layer Select and enable Selects which Layer to access, counting starts with one for the first Layer. A value of zero disables the external weight access, i. e. zero denotes normal network operation. Weight data input Weight memory address The number of address lines is the maximum over all Layers. For Layers with fewer address lines the unused upper lines are not connected. High-active write enable for the selected weight memory
While the weight memory is accessed from the outside, the Neural Network will not function. Consequently, weight reloading should be performed when the network is waiting for the next processing cycle to start. It will not suspend operation by itself.
4.4.3 Evaluation The sync_RAM memory elements are very area-inefficient2 . Albeit functional, they should be regarded as placeholders or evaluation models. They suffice for fast verification, but not for production use. Manual replacement by BlockRAM or other efficient memory elements is highly recommended and supported by the design.
1 2
The signal piWE is renamed to piIn_WE. Implementing 8 kbit by sync_RAM consumes about 8000 slices in a Virtex E FPGA.
4.5 Serial-Net
72
4.5 Serial-Net 4.5.1 Overview The Vibro-Boards from the professorship are used for in-system verification of the design. They possess a serial link for communication. On this account a serial interface to the network—termed UART Interface—was needed. The Serial-Net originates from combination of the Moptin-Net with this serial interface. Its overall structure is displayed in Figure 4.9.
Figure 4.9 Block diagram Serial-Net
UART Interface The UART Interface depicted in Figure 4.10 mediates between the serial lines and the Moptin-Net. It receives the network inputs and weight values, and returns the calculated network outputs. The protocol is described in the next Chapter. The interface includes the following components: TX Reply-ROM
Generates all outgoing traffic Frame header and network characteristics memory for TX RX DATA Receives network inputs and weight values RX COMMANDS Interprets received frame headers MAIN CONTROLLER Controls all other blocks LOAD CONTROLLER Controls RX DATA and RX COMMANDS UART The UART block itself
4.5 Serial-Net
73
Figure 4.10 Block diagram UART Interface
The new input signal piEN_16_X_Baud adjusts the transmission speed of the serial line. See Chapter 4.5.6 for explanation.
4.5.2 Serial Protocol 4.5.2.1 Introduction The serial protocol exhibits a simple frame-orientation, where each frame is divided into 8-bit wide blocks. Each frame starts with a header block. When present for this frame type, the data packets follow. Each data packet itself is assembled from one or more data blocks, as shown in Figure 4.11. The number and size of data packets are derived from
8bit
8bit
8bit
Header Data Packet 1
8bit
8bit
8bit
Data Packet 2
Figure 4.11 Frame structure serial protocol
the underlying neural network characteristics. After one frame is finished, the next frame can follow immediately.
4.5 Serial-Net
74
The perspective of the protocol description is from the outside, i. e. commands are transmitted to and replies are received from the Serial-Net. First, the allowed protocol transitions are displayed. Then the data format is explained, followed by the frame types. All available frame types are presented in overview in Figure 4.12. Transmission Frames ReadCharacteristics 0x03 InitWeights Weight 0x04 Count WriteInputs Input 0x05 Count
Layer
Start Address
Weight 1
Start Address
Input 1
Input 2
Weight 2
RepeatState 0x01 Ready 0x02
Reception Frames Characteristics 0x88
Version
Signal bits
Layers
Inputs
Outputs
ReadyAck 0x81 Idle 0x82 CycleDone Output 0x84 1
Output 2
Figure 4.12 Available frame types serial protocol
4.5 Serial-Net
75
4.5.2.2 Permitted Protocol Transitions Figure 4.13 gives the possible protocol transitions together with the controller states. Nodes represent received frames, while the edges name the triggering frames or conditions for the frame generation. After sending out an ’Idle’ or ’ReadyAck’ frame, the controller waits for new commands. InitWeights and WriteInputs possible
Ready aborts CycleDone Network finished calculation ReadyAck
RepeatState
CycleDone
CycleDone finished Ready ReadCharacteristics
RESET State RepeatState Idle Characteristics finished Characteristics
Figure 4.13 Possible serial protocol transitions
Illegally transmitted frame headers are discarded, while the next block resembling a header is perceived as new frame.
4.5.2.3 Data Format In blocks received from the UART Interface the Most Significant Bit (MSB) is reserved for easy distinction between header and data blocks, as given in Table 4.4. Thus only 7 bits are available in every block. This allows easy frame synchronisation, especially if the communication partner is unaware of the network’s present state (e. g. after startup). To maximise throughput, in blocks transmitted to the UART Interface all 8 bits are available. If by any chance the synchronisation is lost, the UART Interface must be forced into a known state. One option is to transmit ’RepeatState’ in repetition, until the
4.5 Serial-Net
76
Table 4.4 MSB for received blocks in serial communication
Value MSB ’0’ ’1’
Meaning Data block Header block
UART Interface replies with ’Idle’ or ’ReadyAck’. It should be noted, that now the network inputs and weight values could be corrupted and should be re-initialised. Data Packet Format As already mentioned, for reception the MSB is reserved and ’0’ for all blocks. In transmission all 8 bits are used. Each datum is packed into a number of blocks, beginning with the Least Significant Bit (LSB). If not all bits fit into one block, more blocks are prepended. Unused bit positions can have arbitrary value and are ignored. The blocks are now send starting with the block containing the MSB and finish with the block containing the LSB. The data widths are dictated by the neural network at hand and determine the number of blocks for each data packet. A descriptive example is presented in Figure 4.14. Transmitted Data Packet Data MSB
Data LSB
Ud d d d d d d
dddddddd
1st Block
2nd Block
Received Data Packet Data MSB
Data LSB
1 UUUUUU d
1ddddddd
1ddddddd
1st Block
2nd Block
3rd Block
d Data Bits U Unused Bit Positions
Figure 4.14 Data packet examples for 15 data bits
4.5 Serial-Net
77
4.5.2.4 Transmission Frames These frames are send from the host to the UART Interface. ReadCharacteristics Header: 0x03 • Request ’Characteristics’ frame • No data packets InitWeights Header: 0x04 • Assign weight values • Data packets Size 1 block
2
4 bits1
3
Width is defined in generic gSize_Weight_ADR of the Serial-Net toplevel entity Data width of weight memory values, defined in generic gSize_Weight of the Serial-Net toplevel entity
following
No. 1
1
Description Number of weight memory data packets, counting starts with zero (i. e. zero means one data packet) Which Layer to address, first Layer is addressed as ’1’ Address where to put the first weight data packet, following packets are written to consecutive addresses Individual weight memory data packets
The number of accessible Layers is intentionally limited to 15 in the block “RX DATA”. It was considered sufficient, because neural networks usually have only 2 layers. If more layers are needed, this field can easily be expanded up to 8 bits.
4.5 Serial-Net
78
WriteInputs Header: 0x05 • Assign new network inputs • Data packets No. 1
following
2
Size 1 block
Width is defined in generic gNet_In_Size of the Serial-Net toplevel entity Data width of network signal, defined in generic gSize_Signal of the Serial-Net toplevel entity
Description Number of input memory data packets, counting starts with zero (i. e. zero means one data packet) Address where to put the first input data packet, following packets are written to consecutive addresses, the first network input is addressed by zero Individual input data packets
RepeatState Header: 0x01 • Request the current state of the UART Interface • Only answered when waiting in ’Idle’ or ’ReadyAck’ state • No data packets Ready Header: 0x02 • Notify the UART Interface that all network inputs are initialised and all outputs are read. The network is ready for the next calculation cycle. • No data packets
4.5 Serial-Net
79
4.5.2.5 Reception Frames These frames are send from the UART Interface to the host. Characteristics Header: 0x88 • Return some characteristics of the neural network • Data packets No. 1 2
Size 1 block 1 block
3
1 block
4
1 block
5
1 block
Description Version, always ’1’ Number of bits for signal data type as given in generic gSize_Signal of the Serial-Net toplevel entity, if the value exceeds ’127’ then ’127’ is returned Number of layers as given in generic gLayerCount of the Serial-Net toplevel entity Number of network inputs as given in generic gNet_In_Num of the Serial-Net toplevel entity, if the value exceeds ’127’ then ’127’ is returned Number of network outputs, as given in generic gNet_Out_Num of the Serial-Net toplevel entity, if the value exceeds ’127’ then ’127’ is returned
ReadyAck Header: 0x81 • UART Controller acknowledge received ’Ready’ frame • Reply to ’RepeatState’ frame while waiting in ’ReadyAck’ state • No data packets
4.5 Serial-Net
80
Idle Header: 0x82 • Received immediately after ’CycleDone’ and ’Characteristics’ frame • Reply to ’RepeatState’ frame while waiting in ’Idle’ state • Received after start-up of the Serial-Net • No data packets CycleDone Header: 0x84 • Announce finished network calculation cycle • All network outputs are included in the frame • This frame can be interrupted by a transmitted ’Ready’ frame • Data packets
following
No.
Size Data width of network signal, defined in generic gSize_Signal of the Serial-Net toplevel entity
Description Individual network output data packets, beginning with the first output, all outputs follow in succession
4.5.3 TX Block and Reply-ROM TX The TX block generates all data which is send by the UART Interface. The network outputs needed for the ’CycleDone’ frame are taken directly from the Moptin-Net, while all other blocks are read from the Reply-ROM. All control signals are generated by the Main Controller. The TX block can send an arbitrary number of consecutive storage positions. After being enabled, TX fetches the first value from the correct memory and transmits it block by block. Then the next value is processed, until all data is send. While being active, the TX block can always be interrupted by the Main Controller.
4.5 Serial-Net
81
Reply-ROM The Reply-ROM is a small read-only memory which stores all frame headers and all data packets of the ’Characteristics’ frame.
4.5.4 RX DATA and RX COMMANDS Blocks RX DATA This block processes the data packets from the ’InitWeights’ and ’WriteInputs’ frames. They are received, assembled and written into the MoptinNet. RX DATA can handle a continuous data stream, but will delay its operation when no incoming blocks are available.
RX COMMANDS The RX COMMANDS block decodes the header blocks. It returns invalid when there is no data available or the UART Interface is currently busy with data packet decoding.
4.5.5 Control Logic MAIN CONTROLLER The Main Controller drives all other blocks in the UART Interface.
LOAD CONTROLLER Inferior to the Main Controller, the Load Controller arbitrates between RX DATA and RX COMMANDS. Furthermore, it tells the RX DATA block whether to interpret weight or network input data packets.
4.5.6 UART Block The UART Block combines an UART receiver and transmitter. For these components the Xilinx 200 MHz UART with Internal 16-Byte Buffer [10] is used. They are provided as EDIF macros for Xilinx Virtex and Spartan-II FPGA devices.
4.5 Serial-Net
82
Characteristics of Xilinx UART The UART components display the following characteristics: • 1 start bit • 8 data bits, LSB first • 1 stop bit • Fully compatible to Universal Asynchronous Receiver Transmitter standard • 16 byte buffer in each direction • Clock rate exceeding 200 MHz, resulting in a possible communication speed over 1 Mbyte/s • Total of 15 CLBs used For correct function of the receiver macro it is essential to synchronise the incoming serial line with the macro’s clock signal. Typically, a single register is inserted in the signal path. Disregarding this step will result in sporadic packet loss, therefore this buffering is already implemented in the UART block. Line Speed Control The speed of the serial line can be adjusted with the signal piEN_16_X_Baud. Originally, the bit length equals 16 clock cycles, 160 clocks in total for one byte (8 bit data, 1 start bit, 1 stop bit). piEN_16_X_Baud acts as clock enable for the UART block, thus allowing to slow down the link speed. piEN_16_X_Baud set constantly high results in a link speed equal to the clock rate divided by 16. If the signal is driven low to some extend, one bit lasts 16 rising clock edges overlapped with high piEN_16_X_Baud. For explanation in detail see Xilinx XAPP223 [10].
4.5 Serial-Net
83
4.5.7 Evaluation 4.5.7.1 Network Speed Considerations The transmission of one byte takes 160 clock cycles. It is unclear, whether the UART Interface is fast enough to supply the Neural Network continuously with data. Otherwise the network has to wait between calculation cycles. To valuate this matter, the example neural networks from Appendix A.3.2 were used. To ease the evaluation, a number of simplifications were done: • Each data packet consists of only one block • The overhead of every network output cycle adds up to 3 blocks (’CycleDone’ frame header, ’Idle’ frame, ’ReadyAck’ frame) • The overhead of every network input cycle adds up to 4 blocks (’Ready’ frame, ’WriteInputs’ frame header and first two data packets) • No overhead is considered for weight initialisation To obtain demonstrative cycle times, a serial communication speed of 115’200 bps was assumed which results in a clock frequency of 1.8432 MHz. In Table 4.5 the clock cycles for the Neural Network and the UART Interface are presented. In Table 4.6 the same is done for weight loading. From the Tables it is obvious that the serial interface in its current form slows down the Neural Network, because it fails to provide new data in time.
4.5 Serial-Net
84
Table 4.5 Exemplary clock cycles for one calculation cycle in the Serial-Net Name Inputs Outputs Network UART
Ratio Time
Name encoder font iris biglet letters nettalk xor
Name of the network Number of network inputs Number of network outputs Pipelined clock cycles for one calculation cycle Maximum cycles needed for receiving network outputs and sending network inputs over the UART Interface at the same time Cycle ratio = UART / Network Time in ms needed for one Serial-Net processing cycle, based on the maximum cycle count for UART
Inputs 8 576 4 16 35 203 2
Outputs 8 72 3 26 26 26 1
Network 32 28850 15 494 360 24480 6
UART 1920 92800 1280 4640 6240 33120 960
Ratio 60 3.2 85 9.4 17 1.4 160
Time/ms 1.0 50 0.7 2.5 3.4 18 0.5
Table 4.6 Exemplary clock cycles for weight loading in the Serial-Net Name Weights UART Time
Name of the network Number of weights in the network Clock cycles needed for receiving all weight values over the UART Interface Time spend for loading all weight values
Name encoder font iris biglet letters nettalk xor
Weights 70 32644 63 1276 682 27772 12
UART/103 11 5000 10 200 100 4400 2
Time 6.0 ms 2.8 s 5.4 ms 0.1 s 54 ms 2.4 s 1.0 ms
4.5 Serial-Net
85
4.5.7.2 UART According to last Chapter, the UART Interface usually slows down the Neural Network. If this speed degradation is not acceptable, there are a number of possible solutions: • Do not use the UART Interface at all, but employ the Moptin-Net or Neural Network instead • Replace the UART block, e. g. by an 8-bit parallel interface • Decouple the clock of the UART block from the system clock, allowing higher transmission rates • Use another UART block which needs less than 16 clock cycles to transmit one bit According to Xilinx, the UART macros only qualify for Virtex and Spartan-II FPGA. Therefore the Serial-Net is no longer a generic FPGA implementation. This was accepted, because it is easy to replace the UART block for other FPGA architectures or by a generic description. The UART Interface lacks flow control, because for in-chip communication this is not essential. Up-to-date host computers are also able to prevent data loss over the serial link. When needed, flow control can be implemented without much effort. On the receiving side, the UART Interface does not need flow control at all, because it guarantees to process all incoming data blocks.
4.5.7.3 Protocol The protocol is simple, but very strict. Its biggest drawback is the lack of error detection and correction. The worst case are tampered weight values, because this would result in all calculated network outputs being possibly wrong. The host has no ability to detect such an error. Therefore either error detection/correction should be added or the possibility to
4.6 Toolchain
86
verify the weight values. Another option is to implement error protection for all frames. It is arguable, if the reserved MSB for received data blocks is a good solution. Possibly the masking of header blocks inside data packets or other techniques would provide better results, in respect to frame start synchronisation and data throughput. The ’Characteristics’ frame is only rudimentary implemented. It is not possible to explore the whole network, only few characteristics are returned. The network cannot be used without obtaining information about the network’s topology from another source.
4.5.7.4 Implementation Implementing the UART Interface by state machines yields an efficient but inflexible solution. Modification of the protocol could prove difficult, therefore in this case replacing the state machines by an embedded microcontroller should be considered.
4.6 Toolchain 4.6.1 Overview Hardware implementation is only the last stage in the neural network construction process. Prior to synthesis—which is not expected to cause difficulties—the following tasks must be performed: • Network construction itself, preferably graphical • Network training, preferably offering a high number of different and widely parameterisable learning methods • Fixed point evaluation of the network, independently for all different data types in the Neural Network • Generation of the toplevel VHDL network files (Neural Network, Moptin-Net, Serial-Net)
4.6 Toolchain
87
To satisfy the named requirements, a collection of programs was created. Unlike a monolithic application, any single stage can be replaced without affecting the other tools. Beyond that, modularisation eases the task of software development and maintenance. For network construction and training, there are programs available for public use. Thus, a suitable program could be selected. For the other stages, custom tools were developed. The tool chain covering all mentioned points is depicted in Figure 4.15. The programs themselves are introduced in the following Chapters and Appendix A.4.
JavaNNS
CNSIM
CNCONV
Toplevel VHDL Files
VHDL Library
Simulation
Synthesis
Figure 4.15 Toolchain for network implementation process JavaNNS CNSIM CNCONV VHDL Library Toplevel VHDL Files
Graphical network construction and training Fixed point evaluation and network export Automatic toplevel VHDL file and stimuli generation VHDL description of the neural network elements Neural Network, Moptin-Net and Serial-Net
The network construction and training process itself is not covered, because in common literature it is described in detail. Example books are [5], [16], [30] and [35].
4.6 Toolchain
88
4.6.2 JavaNNS JavaNNS—the Java Neural Network Simulator—is a graphical neural network editor and simulator. It supports easy entry and training of many network types. JavaNNS is based on the Stuttgart Neural Network Simulator SNNS [45]. A screenshot is given in Figure 4.16. JavaNNS is provided by the University of Tübingen, Department of Computer Architecture. It can be found at [14]. The manual at [15] gives a short overview about JavaNNS itself. For more insight into the topic of neural networks, the available network types and training methods the interested reader is directed to the SNNS manual at [46]. Version 1.1 of JavaNNS was used throughout this thesis. See also Appendix A.4.1 for more information about JavaNNS. Network training is done by providing input patterns and their respective target values. While training the network, a set of reference patterns can be evaluated to judge the result of the training process. The neural network description and the training patterns are stored in textual form which eases data import by the next processing stage. The following network simulators were also examined: • NNSIM [11] • NSL [2] • PDP++ [26] • SNNS [45] None of them was convincing in its usage or flexibility; all proved inferiour to JavaNNS. Only SNNS provided more capabilities in network construction and training, but at the expense of usability.
4.6 Toolchain
89
Figure 4.16 JavaNNS screenshot [14]
4.6.3 CNSIM 4.6.3.1 Overview CNSIM—in the style of SNNS—is the “Chemnitz Network Simulator”. It emulates the hardware architecture and allows simulation of the neural network with fixed point values. Then the difference between JavaNNS’s reference output and the calculated values is printed, allowing easy judgement of the accuracy in hardware. The data widths can be specified in a configuration file which permits easy evaluation of different values. The network description and the test patterns are expected in the JavaNNS file format version V1.4-3D1 . This is the output format from Version 1.1 of JavaNNS which was elaborately tested with CNSIM. The current version of CNSIM is 1.0. See Appendix A.4.2 for compiling, usage, program options and file formats.
4.6.3.2 Program Flow CNSIM is a command line driven C++ program. It follows an object oriented approach. 1
The version is printed in the first line of each file.
4.6 Toolchain
90
Basically, CNSIM loads the network and test pattern files from JavaNNS, recreates the network structure and then performs the calulations with fixed point values. When requested, the prepared network and test patterns are exported for CNCONV. Figure 4.17 gives the program flow. CNSIM is broken down into modules which are stored in separate files. The file base name equals the module name. When the module name itself has no file extension, the implementation is segmented into a header file (.h) and a C++ code file (.cpp). All modules are explained below: main Main program, calls all other modules parseargs Parses the command line parameters globals Defines global variables and internal settings for the whole program load_config Loads the configuration file with the help of Config.g Config.g Parser for CNSIM’s own config file, implemented in ANTLR [27] load_network Loads the JavaNNS network file with the help of regular expressions network Object representation of the neural network It allows network construction by adding neurons and connections, and performs the network calculation. layer Object representation of a network layer It stores all incoming weights, calculates the scaling factor and uses the neuron object to compute the layer outputs. neuron Object representation of a hardware Neuron with register, sigmoid function sig_338p (see Chapter 3.3.6) and weight unscaling data_export This object exports network and test pattern files for CNCONV All needed information is collected throughout the program execution, then prepared and written into the export files. The network and pattern values originate from the network and layer objects. load_stimuli Loads the JavaNNS test pattern file with the help of Stimuli.g
4.6 Toolchain
91
main Main Program parseargs Parse Command Line Config.g
load_config Load Configuration
Parse Config File
load_network Load Network network
layer
Construct Network
neuron
Network Layers
Neuron in Layer data_export Export Network
Stimuli.g
load_stimuli Load Test Patterns
Parse Pattern File
network
layer
Calculate Network
neuron
Calculate Layers
Calculating Neuron
data_export Export Test Patterns output_compare Print Results module
module
Description
Description
Functional Unit
Optional called Functional Unit
module
Implemented as Object
module
No Object
Figure 4.17 Program flow for CNSIM
4.6 Toolchain
92
Stimuli.g Parser for JavaNNS test pattern files, implemented in ANTLR [27] output_compare This object compares the calculated output values with the reference values from the pattern file and prints the results stdheaders.h Specifies the headers which are included in every source file data.h Data type definitions for the whole program For further information about the operation of CNSIM see the well documented source code.
4.6.4 CNCONV 4.6.4.1 Overview Manual creation of the toplevel VHDL files is laborious, because the files set many generics and instantiate port-extensive components. The complexity is high, but the structure itself is regular. Therefore an automatic generation of the files is possible. The CNCONV tool familiy generates the toplevel VHDL files along with stimuli files for verification. Input files are the networks exported by CNSIM. The tools are written in Perl version 5.8.3. Other Perl versions greater 5.0 should also suffice, but this issue was not elaborated. The individual programs of the tool family are listed in Table 4.7. Table 4.7 CNCONV tool family Name Ver. Description
Program name and executable file name Latest program version Short description of the program
Name serial_net.pl moptin_net.pl network.pl serial_tb_stimuli.pl
Ver. 1.0 1.0 1.0 1.0
Description VHDL file generation of a Serial-Net VHDL file generation of a Moptin-Net VHDL file generation of a Neural Network Stimuli generation for the Serial-Net VHDL testbench
4.6 Toolchain
93
To generate all needed files the tools call each other in a cascade, as sketched in Figure 4.18. serial_tb_stimuli.pl Testbench Stimuli
serial_net.pl on t s e u req
moptin_net.pl
network.pl
Serial−Net VHDL File
Moptin−Net VHDL File
Neural Network VHDL File
Figure 4.18 CNCONV tool cascade to generate all requested files
While generating the Serial-Net VHDL file, various configurations for testbench modules are also written. They can be used in conjunction with the stimuli files for simulative verification of the whole network. See the VHDL source code of the hardware implementation for details. In Appendix A.4.3 the program options and file formats are presented.
4.6.4.2 Program Flow The program flow of all tools is sketched in Figure 4.19.
Perl Modules All shared functionality is collected in three Perl modules. They are placed in the directory modules/ . The module CNSIM provides the interface to the network description and test patterns. The values are loaded from the files exported by CNSIM. A set of functions allows data query. The identifier names used to query the CNSIM module are defined in the module CNSIM_names . The last module is named C1N. It provides auxiliary functions for data preparation, such as converting numbers to binary and building data packets. The packet headers of the serial protocol are also defined here.
Template Files All network constructing programs use templates to generate the VHDL files. They are placed in subdirectories of the templates/ directory. The templates store VHDL code in Perl variables which in turn include other variables. The code snippets are loaded and interpreted by the eval command in Perl.
4.6 Toolchain
94
Start
Read Commandline
Load Network (Module CNSIM) serial_net.pl Request Moptin−Net (moptin_net.pl)
moptin_net.pl
network.pl
Request Neural Network (network.pl)
serial_tb_stimuli.pl
Write Input Stimuli
Write VHDL File (Template Files) serial_net.pl (on request)
Write Reference Stimuli
Request Stimuli Files (serial_tb_stimuli.pl)
Finish
Figure 4.19 Program flow for CNCONV tool family
4.6 Toolchain
95
In doing so, the embedded variables are replaced by their current values. Step by step, the toplevel VHDL files are build from these templates. Due to the usage of template files the program architecture of all network construction programs is very similar. For further information about the operation of the CNCONV tools see the well documented source code.
5 Evaluation
5.1 Performance of the Hardware Architecture 5.1.1 Overview It is of general interest how the hardware architecture will perform after synthesis. On this account, the speed of operation and the hardware costs are presented here. Since the implementation is highly parameterisable, it is impossible to explore the whole design space. Instead, only few parameter combinations are arbitrarily selected to allow cursory valuation of the performance. To assess the hardware architecture it is sufficient to consider a one-layered Neural Network and the UART Interface. Due to the regular structure, multi-layer Neural Networks can be regarded as arrays of one-layered networks. Moptin-Nets connect the Neural Network to memory blocks and virtually include no further elements themselves. At last, the Serial-Net interconnects the Moptin-Net with the UART Interface. The hardware base is a Virtex E 600 FPGA from Xilinx. For synthesis the Synopsys FPGA Compiler 2 version 3.8.0 and Xilinx XACT version 6.2i were used. After synthesis, the maximum operation speed and number of slices were extracted from the report files.
5.1.2 Neural Network The hardware costs of the Neural Network are primarily determined by the size of the data types. Therefore the responsible generics gSize_Signal, gSize_Weight and gSize_Calc are explored independently, while the other parameters are set to a fixed
96
5.1 Performance of the Hardware Architecture
97
value. All other generics are set to ’1’ – except for gLayer0_Size which is set to ’2’. The meaning of the generics is explained in Table 4.1 on Page 60. Because the data widths mainly affect the Neuron implementation, the slices needed for the Neuron alone and the whole Neural Network are given. The graphs drawn in Figure 5.1 visualise the hardware costs in slices over the individual data widths. The values are presented in Appendix A.2.1. As expected, the distance between the Neuron and Neural Network lines is nearly independent from the generic value.
Speed For typical generic values the maximum operation speed is only slightly affected by the changing parameters. The usual range identified during the evaluation is given in Table 5.1. Table 5.1 Typical maximum operation speed of Neuron and Neural Network
Element Neuron Network
Speed Range 130-142 MHz 29-36 MHz
Unlike expected in Chapter 4.1.4, the complete Neural Network is much slower than the Neuron alone. The cause for this slow-down in operation speed should be further investigated and corrected, if possible.
gSize_Scale While quickly checking the other generics, gSize_Scale revealed an unexpected impact on the number of slices used. In the evaluated example, increasing gSize_Scale from ’1’ to ’5’ needed 33 more slices. This hints to an inefficient implementation of the shifter1 in the Neuron. Currently the VHDL functions SHL and SHR from the package std_logic_unsigned are used for shifting.
5.1.3 UART Interface The UART Interface presented in Chapter 4.5.1 connects to the Moptin-Net. It therefore inherits generic parameters from the Serial-Net toplevel entity. They are presented in Table 5.2 by name and their Serial-Net counterparts. 1
The shifter is implemented in the VHDL source file src/network/neuron/shifter_a.vhdl .
5.1 Performance of the Hardware Architecture
98
120
Slices
100 80 60 40
gSize_Weight = 6
20
gSize_Calc = 8
0
2
3
4 5 6 gSize_Signal
7
8
Slices for Neural Network Slices for Neuron only 120
Slices
100 80 60 40
gSize_Signal = 4
20
gSize_Calc = 8
0
4
6
8 10 12 gSize_Weight
14
16
Slices for Neural Network Slices for Neuron only 120
Slices
100 80 60 40
gSize_Signal = 4
20
gSize_Weight = 6
0
4
6
8
10 12 14 gSize_Calc
16
18
20
Slices for Neural Network Slices for Neuron only
Figure 5.1 Hardware costs for one-layered Neural Network
5.1 Performance of the Hardware Architecture
99
Table 5.2 Generics of the UART Interface and their Serial-Net counterparts
UART Interface gSize_Data gNum_Inputs gSize_ADR_In gNum_Outputs gSize_ADR_Out gSize_Weight gSize_ADR_Weight gSize_Weight_LS gLayerCount
Serial-Net gSize_Signal gNet_In_Num gNet_In_Size gNet_Out_Num gNet_Out_Size gSize_Weight gSize_Weight_ADR gSize_Weight_LS gLayerCount
In the following analysis some of the generic parameters were varied. The results are presented in Table 5.3. Table 5.3 Performance evaluation of the UART Interface Generics Slices Speed
Altered generic parameters Generics not mentioned take the default value of ’1’ Number of slices occupied Maximum operation speed in MHz
Generics
Slices
Speed
Defaults gSize_Data= 8 gSize_ADR_In= 10 gSize_ADR_Out= 10 gSize_Weight= 16 gSize_ADR_Weight= 20 gSize_Weight_LS= 5 gSize_Data= 8, gSize_ADR_Weight= 20 gSize_ADR_In= 10, gSize_ADR_Out= 10 gSize_Weight= 16, gSize_Weight_LS= 5
109 115 118 125 116 127 111
70 MHz 64 MHz 72 MHz 72 MHz 73 MHz 61 MHz 63 MHz
147
55 MHz
5.2 Comparison with Fuzzy Pattern Classifier
100
5.2 Comparison with Fuzzy Pattern Classifier 5.2.1 Overview Besides neural networks, another popular instrument for classification tasks is the Fuzzy Pattern Classifier (FPC). Fuzzy pattern classification is used in the professorship since 2001 in form of a custom-build processor [36]. For evaluating the overall performance of Neural Networks, a comparison between both methods on the basis of an example is valuable. First the method of fuzzy pattern classification and the classifier implementation is introduced, followed by the example task. Then the characteristics of the implemented Neural Networks are portrayed. Subsequently the performance regarding classification rate, hardware costs and operation speed will be presented. The values were obtained on the base of a Xilinx Virtex-E FPGA. Then some remarks concerning the training process will be given, closing with a summary of this Chapter. Limitation of Validity As explained in Chapter 5.2.2.2, the FPC used as comparison model is a custom processor. The classification task is controlled by the loaded program. In contrast, the Neural Network is a custom hardware implementation which is specifically designed toward the actual problem at hand. Usually every new task leads to a different implementation which is reflected in classification rate, hardware costs and operation speed. At design stage the outcome of these three parameters can be influenced. Comparing a processor with a custom hardware implementation is to the disfavour of the processor. Nevertheless, to permit judgement versus an existing and already evaluated classifier, the comparison should be drawn discounting the imbalance. All results presented here should be regarded under this premise.
5.2 Comparison with Fuzzy Pattern Classifier
101
5.2.2 Fuzzy Pattern Classification 5.2.2.1 Method Similar to neural networks, the Fuzzy Pattern Classifier processes a number of input values and calculates the class membership for each output. These so-called sympathy values express how much an input sample belongs to each output class, following the fuzzy set theory. The sympathy is derived by a discrete formula. An example membership function is given in Formula 5.1 and is visualised in Figure 5.2. 1 [36, p. 22] (5.1) y(i) = � � �D � m X 1 |xl − Si,l | i,l 1 −1 · 1+ m · B Ci,l i,l l=1
Figure 5.2 Example of two-dimensional membership function [36, p. 22]
The advantage of fuzzy pattern classification is the existence of a discrete membership function to calculate the sympathy value. The training is performed by determining the function parameters, so that the function covers the corresponding input samples as best as possible.
5.2 Comparison with Fuzzy Pattern Classifier
102
On the other hand, each class can only span a contiguous area, as drafted in Figure 5.31 . The shape of the area is also determined by the membership function in use and can only be adjusted according to the function parameters.
x2
������� ������������������ �� ��� ��� ��� ����� ������ � � � ����� � � ��������������������������� � � � � � � � ����� A � � �� �� �� �� ����� � ��������C���������� ������� ������� ������� ��������������������������� ��������� � � � ��� � � � � � ���������� ���� ������ ���� ������ ���� � ���� ��� ����� � � � � � � � ��� � � � � � ����� �� ���� B ���� ��� ������� ����� ����� D����� ����� ����� ����� ��� �� �������
x1
Figure 5.3 Example of two-dimensional class membership areas for classes A, B, C and D
Multi-layered neural networks do not exhibit this kind of constraints. Classes can have arbitrary shape and do not need to be connected. See also Figure 2.9 on Page 27. For deeper understanding of fuzzy pattern classification the interested reader is directed to [7] or [12, Chapter 2].
5.2.2.2 Hardware Implementation The hardware implementation is described in [36]. It is a Xilinx Virtex E 400 based custom processor with integer and floating point arithmetic, targeting fuzzy pattern classification. The implemented floating point format ranges from −1018 up to +1018 with a precision of 4 to 5 decimal places. Data and program code are stored in 3 external memories. The address bus is 16 bit wide, the data bus 16 and 24 bit. 16 status/integer registers, 16 floating point registers and one fixed point register are available [37]. The classifier is trained by a PC-based software.
1
An extension of the Fuzzy Pattern Classifier named Structured Classifier can handle discontiguous areas by forming sub-classes [29].
5.2 Comparison with Fuzzy Pattern Classifier
103
The default classification program reads the input values and function parameters from memory and stores the sympathy values also there. Thus, the classification task to perform can be changed by loading different parameters into memory. The program implements the membership function from Formula 5.1 which is described by 7 values. An 8th value gives the angle of an additional coordinate system transformation. By means of limited address bus width and memory organisation the number of inputs and classes must satisfy the inequation from Formula 5.2. classes · (2 + 20 · inputs) ≤ 32767
(5.2)
5.2.3 Evaluation Example The selection of an example similarly suited for both neural network and fuzzy pattern classification is difficult, because beforehand the performance cannot be assessed. The neural network is expected to compete in all areas of classification, therefore an example with known good eligibility for fuzzy pattern classification was chosen. At first vibration analysis was favoured, because it was already used in conjunction with the FPC. But the number of available samples was insufficient for neural network training, so another example had to be selected. The professorship also has experience with fuzzy pattern classification in the field of image processing. One domain with successful application is color classification. The task is to attribute the colored pixels of an image to a limited number of discrete colors. For example, this could be the first processing stage in an object detection scheme. Since color classification is easy to implement and allows illustrative representation of the results it was adopted as evaluation example. The input picture is given in Figure 5.4. It is based on a reference image provided by Dipl.-Ing. Heiko Kießling, but the black background removed. The classifiers should assign every input pixel to one of the classes marked in the image: Red, Green, Yellow and Blue. If the output with maximum value corresponds to the expected class it is a classification hit, otherwise it is a miss. The input vector consists of the RGB-values of every pixel. They are scaled to the range of [0; 1] for the neural network, while the FPC takes the values verbatim. Only colored pixels are presented to the classifiers, the background is ignored. All color pixels in the image form the validation set.
5.2 Comparison with Fuzzy Pattern Classifier
104
Red Green Yellow Blue Figure 5.4 Validation image for classifier comparison
The training sets for all four colors are predetermined as presented in Figure 5.5. They were extracted from the colored areas in the validation image. It should be noted, that the training set for Yellow lacks the magenta pixels, as
Red
Green
Yellow
Blue
Figure 5.5 Training images for the classifiers
well as the training for Blue does not include yellowish samples. Nevertheless they should be classified into the “correct” color as marked by the area. Here the overall robustness of the trained classifiers toward unexpected disturbances is of importance. Both classifiers are trained targeting maximum classification rate for the validation set, but only using the training sets.
5.2 Comparison with Fuzzy Pattern Classifier
105
5.2.4 Neural Network Implementation The Neural Networks sketched in Figure 5.6 were implemented. Both have 3 inputs and an output layer of 4 neurons. They only differ in the number of hidden layers. While 3-4-NN does not have any hidden layer at all, the network 3-3-4-NN is equipped with one 3-neuron wide hidden layer. 3-4-NN
3-3-4-NN
Figure 5.6 Implemented Neural Networks for comparison with FPC
The larger network exhibits the best classification rates found in simulation, while using as few neurons as possible. The one-layered network allows valuation of the achievable classification rate with the smallest neural network possible. The data widths for the networks are given in Table 5.4. Table 5.4 Data widths for Neural Networks 3-4-NN and 3-3-4-NN Name Signal Weight Neuron
Name of the network Bits for Signal data type Bits for Weight data type Integer and fraction bits for the Neuron data type, separated by a dot
Name 3-4-NN 3-3-4-NN
Signal 7 8
Weight 7 8
Neuron 1.7 2.9
5.2.5 Classification Performance The classification rates for the FPC and the Neural Networks 3-4-NN and 3-3-4-NN are presented in Figure 5.7. See also Appendix A.2.2 for the values. The resulting images are given in Figures 5.8 to 5.10. Each correctly classified pixel is drawn in its target color and classification misses are symbolised by black pixels.
5.2 Comparison with Fuzzy Pattern Classifier
Figure 5.7 Classification rate for Neural Networks and FPC
Red Green Yellow Blue Figure 5.8 Classified validation image by the Fuzzy Pattern Classifier Correctly classifies magenta pixels into yellow color class.
106
5.2 Comparison with Fuzzy Pattern Classifier
107
Red
Green Yellow Blue Figure 5.9 Classified validation image by the Neural Network 3-4-NN Best result for blue color class, but 7 % less in the green color class than FPC and 3-3-4-NN.
Red
Green Yellow Blue Figure 5.10 Classified validation image by the Neural Network 3-3-4-NN Best result for red color class.
5.2 Comparison with Fuzzy Pattern Classifier
108
5.2.6 Hardware Costs and Operation Speed The number of slices for every classifier and the particular FPGA family member used as hardware base are given in Table 5.5. The operation speed can be found in Table 5.6. All results were obtained on Xilinx Virtex-E FPGA. Clock rate and slice count of the FPC were taken from [36]. No maximum clock rate from synthesis was available, therefore the suggested operation clock rate was accepted instead. The number of clock cycles was identified using the default classification program and the FPC hardware simulator [31]. Table 5.5 Hardware costs and FPGA for Neural Networks and FPC Slices FPGA
Number of occupied slices in FPGA Type of Xilinx Virtex-E FPGA used for implementation
FPC 3-4-NN 3-3-4-NN
Slices 3840 158 368
FPGA XCV400E XCV600E XCV600E
Table 5.6 Operation speed for Neural Networks and FPC Maximum Clock Clock Cycles
Highest possible clock rate found in synthesis Clock cycles spend for processing one input sample, without input value loading or result fetching
FPC 3-4-NN 3-3-4-NN
Maximum Clock ≥ 20 MHz 31 MHz 28 MHz
Clock Cycles 5761 37 71
5.2.7 Training Process Both neural network and FPC must be trained to solve a task. However, the characteristics of both training methods differ. FPC training is quite simple: All class parameters are calculated using distinct formulae [12, Chapter 2]. In additon, the user can specify the wideness of the covered
5.2 Comparison with Fuzzy Pattern Classifier
109
area for each class1 [38]. Besides classifier training, it is also possible to determine all parameters by expertise. Neural network training takes more time. There are many different training methods, most of them can be adjusted with more than one parameter. The result depends on the initial network values which are set randomly. No expertise can help to determine good starting values, rarely heuristics are available to allow good guesses. As if this is not already complicated enough, also the network structure affects the training results and must be figured out by experiment. All of this causes many training cycles, until a suitable solution is found. In terms of needed user interaction, for this simple example the FPC was trained in about one hour, but the neural network training took about 10 times longer. After trying out different methods, both networks were trained using Standard Backpropagation. Resilient Propagation showed good results too. The pure processing time spent in training is no concern for both neural network and the FPC. On the other hand, it is possible to automate neural network training. A network training program could try different training methods and network structures, and afterwards select the one which yields the best result. This approach would heavily decrease the network training time, up to virtually no user interaction besides preparation of the training and verification samples. The different behaviour of both training methods is visualised in the treatment of the yellow color class with embedded magenta spots. The training set itself does not include the magenta pixels. In first runs, the FPC was also unable to associate magenta pixels with the yellow class. Only by manually expanding the class wideness it was accomplished. It is impossible to influence the neural network learning process. The behavior solely depends on the training set. The network training aims to closely embrace all training samples and at the same time to increase the distance between class borders. Thus, if no magenta pixels are included in the training set, they usually won’t range in the yellow class. This behavior is sketched in Figure 5.11.
1
Another option is to allow or prohibit coordinate system transformation in the classifier. It is apparent that transformation never degrades the result and is therefore always enabled.
5.2 Comparison with Fuzzy Pattern Classifier FPC
x2
Magenta
��� �� �� �� �� � ��� �� � � � � ��� ��� �� � � � � � ��� �� ����� Yellow
110
x2
�� �� �� ���� ��� �� �� �� ����� ��� � ��� � � � ��� �� �����
Neural Network Magenta
����� ���������� � ����� ���� ����� ���� ��� �������
Red
Yellow
x1
������ ������ ������ ���� ���� ���� ���� ��� ������� Red
x1
Figure 5.11 Different behaviour in training for neural networks and FPC
5.2.8 Summary The overall classification rate is comparable for the FPC and the 3-3-4-NN Neural Network. Red is better classified by the Neural Network and Yellow is in favour of the FPC. It is remarkable, that the small network 3-4-NN beats the others in the Blue domain. Not always the bigger network achieves better results – it depends on the task. In this example, the network 3-3-4-NN is 80-times faster with respect to clock cycles and 10-times smaller than the FPC. On the other hand, the FPC is more flexible in usage. A new task calls for only an updated memory content, while the Neural Network usually must be synthesised again. Learning for FPC is easy and fast. It is possible to influence the result by expertise. Neural Network learning takes a longer time. The selection of training sample is very important for the result – much more than for the FPC, because manual intervention is neither possible nor needed. If the design stage is of no concern, for simple tasks the Neural Network is superior to the FPC in all domains. Because of the greater classification abilities, the network should also outperform the FPC for more complex problems.
6 Conclusion
Summary This work introduces a VHDL-based generic neural network hardware implementation which was verified using Xilinx Virtex E FPGA. It supports first order Backpropagation networks of arbitrary structure. In hardware every layer instantiates only one neuron which processes all outputs in multiplex. A serial communication interface can be included as option. The design is only slightly optimised. The complete neural network design process—from graphical network construction and training up to generation of the toplevel VHDL files—is covered by the tools JavaNNS, CNSIM and CNCONV. The neural network method can handle disjointed complex classification areas and is therefore suitable for all kinds of classification tasks. A comparison with the Fuzzy Pattern Classifier showed that the hardware implementation is smaller, faster and reaches comparable results. On the other hand, it is less flexible in the case of changing problems. Outlook In the course of this work not all ideas could be carried out. Some of these possible enhancements are listed here. Now every layer includes only one neuron. To support parallel processing, it should be possible to parameterise the number of neurons in each layer with only little extra effort. To increase the versatility of the implementation, hardware integration of learning methods is suggested. One approach is to apply dynamic FPGA reconfiguration which should only require small architecture modifications.
111
6 Conclusion
112
Further optimisation of the hardware implementation and the generated tools is recommended to increase the overall performance. To ease network construction, the whole design process could be managed by a graphical user interface. Network training now requires a high amount of user interaction to explore different training methods with varying parameter values. To reduce the interaction, the user interface should automatically try diverse training methods and select the best result. Finally, using the existing hardware implementation, the neural approach itself should be evaluated in more detail with the help of real world examples.
Bibliography
[1] Acosta, Nelson ; Tosini, Marcelo: Custom Architectures for Fuzzy and Neural Networks Controllers. (2002). http://citeseer.ist.psu.edu/ acosta02custom.html [2] Arbib, Michael et al.: Neural Simulation Language. Version: November 2002. http://nsl.usc.edu/nsl/. – Online–Ressource, Last Checked: 2005-02-01 [3] Asanović, Krste ; Morgan, Nelson: Experimental Determination of Precision Requirements for Back-Propagation Training of Artificial Neural Networks. (1991). ftp://ftp.icsi.berkeley.edu/pub/techreports/1991/ tr-91-036.pdf [4] Bade, Stephen L. ; Hutchings, Brad L.: FPGA-based Stochastic Neural Networks – Implementation. In: Buell, Duncan A. (Ed.) ; Pocek, Kenneth L. (Ed.): IEEE Workshop on FPGAs for Custom Computing Machines. IEEE Computer Society Press, p. 189–198 [5] Berns, Karsten ; Kolb, Thorsten: Neuronale Netze für technische Anwendungen. Berlin Heidelberg : Springer, 1994 [6] Beuchat, Jean-Luc ; Haenni, Jacques-Olivier ; Sanchez, Eduardo: Hardware Reconfigurable Neural Networks. (1998). http://ipdps.eece.unm.edu/ 1998/raw/haenni.pdf [7] Bocklisch, S. F.: Prozessanalyse mit unscharfen Verfahren. Berlin : Verlag Technik, 1987 [8] Braun, Heinrich ; Feulner, Johannes ; Malaka, Rainer: Praktikum Neuronale Netze. Berlin Heidelberg : Springer, 1996 [9] Caviglia, Daniele:
NEuroNet: 3.3.1 Tools – Neural Networks Hardware.
113
Bibliography
114
Version: March 2001. http://www.kcl.ac.uk/neuronet/about/roadmap/ hardware.html. – Online–Ressource, Last Checked: 2005-02-02 [10] Chapman, Ken: 200 MHz UART with Internal 16-Byte Buffer. v1.1. San Jose, CA: Xilinx, July 2001. http://direct.xilinx.com/bvdocs/appnotes/ xapp223.pdf [11] Dentinger, Daniel J.: Overview of NNSim. Version: July 2002. http://www. nd.edu/~ddenting/nnsim.html. – Online–Ressource, Last Checked: 2005-0201 [12] Eichhorn, Kai: Entwurf und Anwendung von ASICs für musterbasierte FuzzyKlassifikationsverfahren, Technische Universität Chemnitz, Diss., 2000 [13] Fahlman, S. E. ; Lebiere, C.: The Cascade-Correlation Learning Architecture. In: Touretzky, D. S. (Ed.): Advances in Neural Information Processing Systems vol. 2. Denver 1989 : Morgan Kaufmann, San Mateo, 1990, p. 524–532 [14] Fischer, Igor: JavaNNS – Java Neural Network Simulator. Version: March 2005. http://www-ra.informatik.uni-tuebingen.de/software/JavaNNS/. – Online–Ressource, Last Checked: 2005-06-21 [15] Fischer, Igor et al.: JavaNNS User Manual. Version 1.1. Tübingen: University of Tübingen, 2002. http://www-ra.informatik.uni-tuebingen.de/ software/JavaNNS/manual/JavaNNS-manual.html [16] Freeman, James A. ; Skapura, David M.: Neural Networks: Algorithms, Applications and Programming Techniques. Nachdruck mit Korrekturen. Bonn : Addison-Wesley, 1991 [17] Guccione, Steven A. ; Gonzalez, Mario J.: A Neural Network Implementation Using Reconfigurable Architectures. (1993). http://www.io.com/ ~guccione/Papers/Neural/neural.pdf [18] Hagan, Martin T. ; Demuth, Howard B. ; Beale, Mark: Neural Network Design. Boston : PWS Publishing Company, 1996 [19] Hoehfeld, Markus ; Fahlman, Scott E.: Learning with Limited Numerical Precision Using the Cascade-Correlation Algorithm. In: IEEE Transactions on Neural Networks 3 (1992), July, no. 4, p. 602–611
Bibliography
115
[20] Hoffmann, Norbert: Kleines Handbuch Neuronale Netze: Anwendungsorientiertes Wissen zum Lernen und Nachschlagen. Braunschweig/Wiesbaden : Vieweg, 1993 [21] Holt, Jordan L. ; Hwang, Jenq-Neng: Finite Precision Error Analysis of Neural Network Hardware Implementations. In: IEEE Transactions on Computers 42 (1993), March, no. 3, p. 281–290 [22] Hopfield, J. J.: Neural Networks and Physical Systems with Emergent Collective Computational Abilities. In: Proceedings of the National Academy of Sciences, 1982, p. 2554–2558 [23] Liao, Stan Y.: Welcome to the SystemC Community. Version: 2005. http: //www.systemc.org. – Online–Ressource, Last Checked: 2005-05-01 [24] Maeda, Yutaka ; Tada, Toshiki: FPGA Implementation of a Pulse Density Neural Network With Learning Ability Using Simultaneous Perturbation. In: IEEE transactions on neural networks 14 (2003), May, no. 3. http://www. jhuapl.edu/SPSA/PDF-SPSA/maeda_IEEETNN.pdf [25] Nichols, Kristian R. ; Moussa, Medhat A. ; Areibi, Shawki M.: Feasibility of Floating-Point Arithmetic in FPGA based Artificial Neural Networks. In: 15th International Conference on Computer Applications in Industry and Engineering, 2002 [26] O’Reilly, Randall C. et al.: The PDP++ Software Home Page. Version: October 2004. http://psych.colorado.edu/~oreilly/PDP++/PDP+ +.html. – Online–Ressource, Last Checked: 2005-02-01 [27] Parr, Terence: ANTLR Parser Generator. Version: 2005. http://www. antlr.org/. – Online–Ressource, Last Checked: 2005-05-01 [28] Patterson, Dan W.: Künstliche neuronale Netze: Das Lehrbuch. Haar bei München : Prentice Hall, 1997 [29] Priber, Ulrich ; Kretzschmar, Werner: Inspection and Supervision by means of Hierarchical Fuzzy Classifiers. In: Fuzzy Sets Syst. 85 (1997), no. 2, p. 263–274. – ISSN 0165–0114 [30] Rigoll, Gerhard: Neuronale Netze: Eine Einführung für Ingenieure, Informatiker und Naturwissenschaftler. Renningen-Malmsheim : expert Verlag, 1994
Bibliography
116
[31] Rockstroh, Jörg: Programmierung eines Software-Debuggers und Untersuchung der Realisierungsmöglichkeiten eines Hardware-Debuggers für einen selbstentwickelten Prozessor, Chemnitz University of Technology, Seminar Paper, 2003 [32] Rojas, Raúl: Theorie der neuronalen Netze: Eine systematische Einführung. Berlin Heidelberg : Springer, 1993 [33] Rosenblatt, Frank: The Perceptron: A probabilistic model for information storage and organization in the brain. In: Psychological Review 65 (1958), no. 6, p. 386–408 [34] S. Hettich, C.L. B. ; Merz, C.J.: UCI Repository of machine learning databases. http://www.ics.uci.edu/~mlearn/MLRepository.html. Version: 1998 [35] Scherer, Andreas: Neuronale Netze: Grundlagen und Anwendungen. Braunschweig : Vieweg, 1997 [36] Schlegel, M. ; Herrmann, G. ; Müller, D.: Eine neue HardwareKomponente zur Fuzzy-Pattern-Klassifikation. In: Dresdener Arbeitstagung Schaltungs- und Systementwurf DASS’04 Fraunhofer-Institut für Integrierte Schaltungen, 2004, p. 21–26 [37] Schlegel, Michael: Dokumentation Fuzzy–Prozessor. v1.1. Chemnitz: Chemnitz University of Technology, 2000 [38] Schreiter, André: Programmierung einer graphischen Benutzeroberfläche für MATLAB-Funktionen zur Fuzzy-Pattern-Klassifikation, Chemnitz University of Technology, Seminar Paper, August 2004 [39] Sejnowski, T. ; Rosenberg, C.: NETtalk: a parallel network that learns to read aloud / John Hopkins University. 1986. – Technical Report. JHU/EEC86/01 [40] Shiun, Kuek C. ; Abdullah, Wan Ahmad Tajuddin W. ; Kamaluddin, Burhanuddin: Digital Hardware Implementation of Bus-based, Field-Ordered Hopfield Network using VHDL. (2004). http://fizik.um.edu.my/wat/ kertas/pkuek.pdf [41] Skubiszewski, Marcin: A Hardware Emulator for Binary Neural Networks. (1990). http://citeseer.ist.psu.edu/skubiszewski90hardware.html
Bibliography
117
[42] Tommiska, M.T.: Efficient Digital Implementation of the Sigmoid Function for Reprogrammable Logic. In: IEE Proceedings – Computers and Digital Techniques 150 (2003), November, no. 6 [43] Upegui, Andrés ; Peña-Reyes, Carlos A. ; Sánchez, Eduardo: A Hardware Implementation of a Network of Functional Spiking Neurons with Hebbian Learning. (2004). http://lslwww.epfl.ch/~upegui/docs/A%20hardware% 20implementation%20of%20a%20network%20of%20functional%20spiking% 20neurons%20with%20hebbian%20learning%20.pdf [44] Werbos, Paul J.: Beyond Regression: New Tools for Prediction and Analysis in the Behavioral Sciences, Harvard University, Diss., 1974 [45] Zell, Andreas et al.: Stuttgart Neural Network Simulator. http:// www-ra.informatik.uni-tuebingen.de/SNNS/. – Online–Ressource, Last Checked: 2005-06-21 [46] Zell, Andreas et al.: SNNS User Manual. Version 4.2. Stuttgart, Tübingen: University of Stuttgart, University of Tübingen, 1998. http://www-ra. informatik.uni-tuebingen.de/downloads/SNNS/SNNSv4.2.Manual.pdf [47] Zhu, Jihan ; Sutton, Peter: FPGA Implementation of Neural Networks – A Survey of a Decade of Progress. (2003). http://eprint.uq.edu.au/archive/ 00000827/
A Appendix
Contents A.1 Acronyms . . . . . . . . . . . . . . . . . . . . . . . A.2 Tables . . . . . . . . . . . . . . . . . . . . . . . . . A.2.1 Hardware Costs for One-Layered Neural Network A.2.2 Classification Performance in Color Classification A.3 Data Discretisation . . . . . . . . . . . . . . . . . A.3.1 Approach . . . . . . . . . . . . . . . . . . . . . . A.3.2 Example Networks . . . . . . . . . . . . . . . . . A.3.3 Discrete Values in Network Definition File . . . . A.3.4 Signal Discretisation and Bias . . . . . . . . . . . A.3.5 Weight Discretisation and Scaling . . . . . . . . . A.3.6 Sigmoid Function in Hardware . . . . . . . . . . A.3.7 Rounding versus Truncation . . . . . . . . . . . . A.4 Network Construction Programs . . . . . . . . . A.4.1 JavaNNS . . . . . . . . . . . . . . . . . . . . . . A.4.2 CNSIM . . . . . . . . . . . . . . . . . . . . . . . A.4.3 CNCONV . . . . . . . . . . . . . . . . . . . . . . A.5 Network Implementation Guide . . . . . . . . . . A.6 Contents CD-ROM . . . . . . . . . . . . . . . . .
119
. . . . . . . . . . . . . . . . . .
. . . . . . . . . . . . . . . . . .
. . . . . . . . . . . . . . . . . .
. . . . . . . . . . . . . . . . . .
. . . . . . . . . . . . . . . . . .
120 120 120 121 121 121 121 122 123 124 125 125 127 127 129 137 140 143
A.1 Acronyms
120
A.1 Acronyms ART
Adaptive Resonance Theory
CLB
Configurable Logic Block
FPC
Fuzzy Pattern Classifier
FPGA Field Programmable Gate Array LSB
Least Significant Bit
MSB Most Significant Bit SoC
System-On-Chip
UART Universal Asynchronous Receiver Transmitter
A.2 Tables A.2.1 Hardware Costs for One-Layered Neural Network gSize_Weight=6, gSize_Calc=8 gSize_Signal Slices Neuron Slices Network
2 41 66
4 56 85
6 71 104
8 81 116
gSize_Signal=4, gSize_Calc=8 gSize_Weight Slices Neuron Slices Network
4 50 80
6 56 85
10 70 101
14 82 112
16 88 118
gSize_Signal=4, gSize_Weight=6 gSize_Calc Slices Neuron Slices Network
4 42 70
8 56 85
10 60 91
16 76 106
20 88 120
A.3 Data Discretisation
121
A.2.2 Classification Performance in Color Classification All values are in percent.
Fuzzy Pattern Classifier Neural Network 3-4-NN Neural Network 3-3-4-NN
Red 91.3 93.5 97.8
Green 89.3 82.4 89.7
Yellow 94.6 84.3 85.3
Blue 91.5 95.1 91.3
Total 91.8 89.0 91.0
A.3 Data Discretisation A.3.1 Approach Step by step, the floating point data types are replaced by fixed point ones. At first all data are equipped with 16 integer and 32 fraction bits and reach the same error as the floating point calculation. This will be called the Reference Implementation. Then step by step the data width in question is reduced and the impact is analysed. The error analysis will be performed using the example networks introduced in the next Chapter. An analytical maximum error calculation is not meaningful because of multiplicative error propagation and the usage of a sigmoid function. The same method is used to examine other data type characteristics throughout this Chapter.
A.3.2 Example Networks The following neural networks are used for performing the studies. The samples for iris and biglet originate from the UCI Repository of machine learning databases [34], while the networks were designed manually. The other networks are taken from the JavaNNS distribution [14].
A.3 Data Discretisation
122
The meaning of the colums: Name Name used for identification Structure Network Structure The overall structure is first order feed-forward. In this column the number of neurons in each layer is given, starting with the number of inputs. Inputs Input value co-domain Binary input is restricted to ’1’ and ’0’, while real input allows every value in the range of [0; 1]. Description Short description of the network
Name encoder
Structure 8-3-8
Inputs Binary
font
576-50-72
Binary
iris
4-3-3-3-3
Real
biglet
16-20-18-26
Real
letters
35-10-26
Binary
nettalk
203-120-26
Binary
xor
2-2-1
Binary
Description This network tries to learn a 3-bit coded representation for 8 input bits Classification of characters from two different character sets, input is the display matrix The well-known iris classification problem, classifies iris plants in 3 different types A real letter classification problem, using statistic moments as inputs A demonstrative letter classification, input is the display matrix The well-known NETtalk application, tries to learn the correct pronounciation of written english text Learns the XOR function
A.3.3 Discrete Values in Network Definition File The errors are presented in the following Table which were calculated using floating point variables.
A.3 Data Discretisation Network encoder font iris biglet letter nettalk xor
Maximum Deviation 5.14856e-06 7.99155e-06 8.05856e-06 1.06888e-04 4.99742e-06 3.35527e-05 4.93964e-06
123 Average Deviation 1.96236e-06 2.49859e-06 2.40031e-06 8.24167e-07 2.35834e-06 2.65001e-06 3.52617e-06
This Table also shows the lowest error reachable from the JavaNNS output and is the basis of comparison further on. Without providing more fraction bits for the weights no better result can be reached.
A.3.4 Signal Discretisation and Bias First of all, the signals between neurons are changed from floating point to fixed point representation. The question to investigate is whether one universal bit width sufficient for all examples could be found. [3], [21] et al suggest that 8 bits are enough for signals. This is investigated in the following Table for maximum deviation. Network encoder font iris biglet letter nettalk xor
Bias multiplied by ’1’ 4.3750e-03 3.3313e-03 4.1930e-02 2.0013e-01 3.2600e-03 7.5338e-03 2.2200e-03
Bias bypassing Multiplier 5.1875e-03 3.2363e-03 3.7410e-02 1.9240e-01 3.6300e-03 7.5338e-03 1.6863e-03
Errors are inferred by rounding the inputs in each network layer, while all other values are still in the form of the Reference Implementation. The previous Table has two colums: In the first column the bias value is multiplied by a signal-representation of ’1’. In the second column the bias value bypasses the multiplier. The deviations in the Table vary from network to network, not indicating that 8 bits are always a reasonable choice. To keep the generic character of the implementation, the signal bit width cannot be set to a fixed value.
A.3 Data Discretisation
124
A.3.5 Weight Discretisation and Scaling Weight Scaling Comparison of maximum errors with and without weight scaling for each example network: Bit Configuration Network encoder font iris biglet letter nettalk xor
Integer 6 3 7 8 4 5 4
Fraction 2 4 2 10 3 4 0
Scaled 8 7 9 18 7 9 4
Maximum without Weight Scaling 4.6349e-02 2.7919e-02 7.5180e-02 1.2235e-02 4.0541e-02 5.6808e-02 5.2835e-02
Deviation with Weight Scaling 1.5586e-02 2.0106e-02 3.1739e-02 8.5637e-04 3.3630e-02 3.0274e-03 5.2835e-02
To allow the valuation of weight scaling in a changing environment, all networks (minus biglet) were evaluated with one fixed weight width. Without scaling 7 integer and 3 fraction bits were selected which translates to 10 bits with weight scaling. The following Table presents the maximum deviation for both cases: Network encoder font iris letter nettalk xor
No Weight Scaling 2.6453e-02 6.6079e-02 2.3495e-02 4.9621e-02 1.0498e-01 4.1551e-03
Weight Scaling 7.5008e-03 2.4499e-03 8.6572e-03 5.8863e-03 3.0274e-03 5.9754e-04
For all networks the error is reduced to 50% or less. There is no situation in which the original approach outperforms weight scaling.
A.3 Data Discretisation
125
A.3.6 Sigmoid Function in Hardware For the empirical analysis of the overall error all sample networks were configured with the same bit widths, as shown in the following Table.
Signal Bits Weight Bits Neuron Bits
Bit Width 8 10 8 integer bits, 16 fraction bits
The next Table compares the analytical calculation using floating point values with sig_338p, in respect to maximum deviation.
Network encoder font iris biglet letter nettalk xor
Floating Point 7.9775e-03 4.3213e-03 5.7555e-02 3.0420e-01 6.3638e-03 3.8963e-03 3.0950e-03
sig_338p Input Rounding Input Truncation 3.9228e-02 3.2288e-02 1.1225e-02 1.9805e-02 6.5368e-02 4.4983e-02 6.4544e-01 9.1448e-01 1.1875e-02 1.8083e-02 1.9810e-02 4.2690e-02 4.6975e-03 1.2510e-02
A.3.7 Rounding versus Truncation Another question is how the discretisation from floating point to fixed point values should be done. The alternatives are rounding and truncation of surplus fraction bits. All networks are analysed together using the following bit widths.
Signal Bits Weight Bits Neuron Bits
Bit Width 8 10 8 integer bits, 8 fraction bits
For both signals and weights rounding (RND) and truncation (TRN) were selected, and the resulting maximum errors portrayed in the next Table. The table headers spell “Signal/Weight”. To ease the investigation, first the discretisation method for the neurons is fixed to rounding.
A.3 Data Discretisation Network encoder font iris biglet letter nettalk xor
RND/RND 3.9228e-02 1.2685e-02 5.3035e-02 9.5230e-01 1.0580e-02 1.1440e-02 4.6975e-03
126 RND/TRN 2.2668e-02 2.6093e-02 1.4349e-01 9.7537e-01 2.2928e-02 1.3644e-01 4.6975e-03
TRN/RND 3.9228e-02 1.2685e-02 6.1325e-02 9.6734e-01 1.0580e-02 1.1440e-02 4.6975e-03
TRN/TRN 2.2668e-02 2.6093e-02 6.5133e-02 9.6092e-01 2.2928e-02 1.3644e-01 4.6975e-03
There is no clear vote for one single setting. Rounding of weights and signals is favourable in the majorities of cases, but not for all. The outcome seems to depend on the network at hand, presumably also on the input signals. Further investigation by means of the application needs to be performed. Selecting rounding for both signals and weights, now rounding and truncation for the neuron are compared. The presented maximum error in the next Table shows that rounding is advantageous over truncation. Network encoder font iris biglet letter nettalk xor
Round Neuron 3.9228e-02 1.2685e-02 5.3035e-02 9.5230e-01 1.0580e-02 1.1440e-02 4.6975e-03
Truncate Neuron 3.4293e-02 7.3213e-02 2.8319e-01 9.9609e-01 3.8553e-02 4.0207e-01 5.5925e-03
Summarising the results, rounding for all data types is suggested. If truncation of the neuron data is preferred for hardware implementation, it should be verified whether the additional error introduced is tolerable. However, the network input and weight discretisation method is no issue for the hardware implementation, because data preparation for the Neural Network has to be done by the controlling application. The Neural Network accepts and delivers its values in discretised fixed point format only.
A.4 Network Construction Programs
127
A.4 Network Construction Programs A.4.1 JavaNNS A.4.1.1 Characteristics
Supported training methods: • Cascade Correlation • TACOMA • Backpropagation, Batch Backpropagation, Backpropagation with Momentum, Backpropagation with Weight Decay, Backpropagation through Time, Batch Backpropagation through Time, Time-Delay Backpropagation • JE Backpropagation, JE Backpropagation with Momentum, JE Quickprop, JE Resilient Propagation • Quickpropagation, Quickpropagation through Time • Resilient Propagation • Dynamic LVQ • Kohonen • Counterpropagation • Radial Basis Learning • RBF – Dynamic Decay Adjustment • ART1, ART2, ARTMAP • Hebbian, Delta-Rule JavaNNS is currently provided only in binary form for the following platforms:
A.4 Network Construction Programs
128
• Windows NT and Windows 2000 • Linux for Intel machines • Solaris 7 • Mac OS X
A.4.1.2 Exporting Networks for CNSIM According to the hardware implementation all first order feed-forward networks are eligible. To generate valid network description files for CNSIM the following points must be observed: • Select Act_Logistic as Activation Function for real Neurons, Act_Identity for Input Neurons • Neurons need to be assigned to the correct layer number • Layers must be arranged in ascending order, with the input layer being the numerically smallest • The network must be fully connected • No shortcuts are allowed The network itself is exported by selecting Save or Save As from the file menu.
A.4 Network Construction Programs
129
The test patterns are exported via Save Data from the file menu: 1. Select “Result Files *.res” at “File of Type” 2. Input file name with suffix “.res” 3. Press Save button 4. Select wanted patterns 5. Check “Include Input Patterns” 6. Uncheck “Include Output Patterns” 7. Press OK button
A.4.2 CNSIM A.4.2.1 Building and Prerequisites CNSIM is written in ANSI C++ with the usage of SystemC [23] and ANTLR [27]. It was compiled with GCC. The program versions in Table A.1 were used for compilation. Other versions of the mentioned tools should also suffice, but this issue was not elaborated. The compilation process can be configured in the file Makefile.def which also introduces ANTLR and SystemC. Most likely, these settings must be adapted to the current environment. Table A.1 Compiler and tools used for building CNSIM
Program GCC SystemC ANTLR
Version 3.3.2 2.0.1 2.7.5
Description C++ Compiler Provides fixed point data types Language parsing and recognition
The compilation itself is performed by make. To kick off the build process, just enter make in the root directory of the source tree. See the header of the Makefile for other possible make targets.
A.4 Network Construction Programs
130
A.4.2.2 Usage The goal of the network simulation with CNSIM is to elaborate the data widths and to find suitable values for hardware implementation. The network itself is already constructed and trained by JavaNNS. The network description and the test patterns are exported as described in Chapter A.4.1.2. In the next step the network description and the test patterns are converted to an easy-to-parse format, using the identified data widths. A typical network analysis covers the following steps: 1. Running CNSIM with various data widths, until a satisfactory trade-off between number of bits and introduced error is established 2. Using the established values, export the network and test patterns for usage with CNCONV CNSIM is command line oriented, its arguments and options are explained in Chapter A.4.2.3.
Output The program output is self-explanatory and can be divided into three sections. First the number of bits used for the simulation are printed, according to the values set in the configuration file. Intermixed are status messages of CNSIM itself. The calculation results for all test patterns follow. For each sample the network inputs and calculated outputs along with their absolute deviation from the reference values are printed. If the difference falls below a threshold1 of 10−5 the result is considered without error and “OK” is printed. The last section entitled “statistics” gives the maximum and average absolute deviation, along with the number of threshold oversteppings.
1
The threshold value is defined in the constant output_threshold in the file globals.cpp .
A.4 Network Construction Programs
131
A.4.2.3 Program Options Usage: cnsim [OPTIONS] pattern_file The option structure follows the GNU coding standards which define short and long options. Short options are one character long and prefixed with one hyphen. Long options are prefixed with two hyphens and contain more than one character. They can be shortened, as long as uniqueness is kept. Values following long options can be separated by spaces or equal signs. For the short form a space is allowed, but not mandatory. Short options without value can be combined, i. e. options “-a” and “-b” become “-ab”. The columns in the following program option Tables list the long option name (Long), the short option name (Short) and give a description. Mandatory Arguments and Options The only argument “pattern_file” names the test pattern file of the neural network which usually bears the suffix .res . The mandatory option gives the network file name: Long --network
Short -n
Description File name of the JavaNNS network file, usually ending in .net
Facultative Options Long --config, --cfg --writenet, --wnet --writestim, --wstim --debug --quiet --help --usage --version
Short -c -w -s -d -q -? -V
Description Name of the configuration file Export network to this file Export test patterns to this file Enable debug output Print only statistics summary Print help screen and exit Print usage message and exit Print program version and exit
A.4 Network Construction Programs
132
A.4.2.4 Configuration File The data widths can be set in a configuration file. If no configuration file is loaded or a value is not specified, the defaults1 given in Table A.2 are used. Table A.2 Default data widths in CNSIM
Data Type Signal Weight Neuron
Format Unsigned Signed Signed
Integer Bits 0 1 16
Fraction Bits 32 47 32
For signed data types the sign bit counts toward the integer bits. Internally the data are represented by sc_fix_fast and sc_ufix_fast which are data types from the SystemC class library. See the SystemC User Guide for further information. It can be found in the SystemC source code distribution [23]. The overall syntax follows these rules: • Each line contains one configuration element • Lines starting with a hash ’#’ and empty lines are ignored • Element names are case insensitive • A configuration element consists of its name, followed by an equal sign and the arguments separated by colon. The element is finished by a semicolon: name = arg1[, arg2, ...] ; • All arguments are mandatory • Between each part of the element an arbitrary number of spaces is allowed
1
The default values are set at the end of the source file globals.cpp .
A.4 Network Construction Programs
133
The configuration elements set the data widths for simulation and network export. They are listed by their element names. fix_bitwidth_signal Number of fraction bits for Signal data type There are no integer bits, because the co-domain is [0; 1] Argument Description 1 Number of fraction bits fix_bitwidth_weight Number of bits for Weight data type Argument Description 1 Number of overall bits used to store scaled weight values fix_bitwidth_neuron Number of bits for Neuron data type Argument Description 1 Number of integer bits Number of fraction bits 2
A.4.2.5 Export Data Format The characteristic feature of the export data format is its easy readability for both human and machine, at the expense of larger file size. The files are line-oriented and the entries are topically grouped together. Every block starts with the block name on a single line and contains a number of entries (also zero) in the format: name:␣arg1␣[arg2␣...] The entry name is followed by a colon and a space. The arguments sequel, each separated by a single space. A block itself can appear once or in repetition. The file format is strict, no variations like added spaces or empty lines are allowed. The entry order and capitalisation is fixed too. Number format is either Integer or Binary as textual representation of the value. Binary fields also exhibit the correct number of digits, with zeros padded if necessary. String is used to represent character strings. A String argument spans all characters until the end of the line, including spaces. A string can also be empty. The last format type are YesNo entries. They contain either “yes” or “no” as string and possess their natural language meaning.
A.4 Network Construction Programs
134
Network Export File; generated by Option --writenet Block CNSIM␣Network␣Definition␣File␣v0.1 • File header • Appear once • No entries Block Parameter • Contain global neural network characteristics • Appear once • Entries Name network_name size_signal
Value String Integer
size_weight
Integer
size_scale
Integer
size_neuron
Integer
size_neuron_frac
Integer
number_of_layers
Integer
Description Name of the network Number of bits for the Signal data type Number of bits for the Weight data type Number of bits for the scale factor used for weight scaling, excluding the sign bit Total number of bits for the Neuron data type Number of fraction bits for the Neuron data type Number of neuron layers, excluding the input layer
A.4 Network Construction Programs
135
Block Layer • Definition of the network layers, starting with the first layer and finishing with the output layer • Appear once for each network layer • Entries Name output_layer number_of_inputs size_input number_of_outputs size_output number_of_weights weights
Value YesNo Integer Integer
Description Marks the output layer Number of inputs for this layer Number of bits used to encode this layer’s inputs Integer Number of outputs for this layer Integer Number of bits used to encode this layer’s outputs Integer Number of weight values stored in the next field weights Multiple Weight values as memory iniBinary tialisation values starting from Values address zero, bias and scale factors are also included as described in Chapter 4.3.3
Test Pattern Export File; generated by Option --writestim Block CNSIM␣Stimuli␣Definition␣File␣v0.1 • File header • Appear once • No entries
A.4 Network Construction Programs
136
Block Metadata • General information about the test patterns • Appear once • Entries Name number_of_sets
Value Integer
Description Number of test pattern sets
Block Stimuli␣Set • Definition of the test patterns with reference values for each layer • Appear once for every test pattern set • Entries – One entry for every network layer plus the input layer – All entries share the same structure – The first entry contains the network inputs – Then the layers are traversed in ascending order – The last entry contains the network outputs Name values
Value Multiple Binary Values
Description Values for each layer, counting upward, equals the content of the Layer RAM block starting from address one
A.4 Network Construction Programs
137
A.4.3 CNCONV A.4.3.1 Program Options Usage: program.pl [OPTIONS] network_file [test_pattern_file] The options and arguments for all tools are similar. The option structure and usage is identical to CNSIM which is explained in Chapter A.4.2.3. All programs share the following common options: Long --help --version
Short -h -V
Description Print help screen and exit Print program version and exit
The VHDL generating tools serial_net.pl, moptin_net.pl and network.pl also share these options: Long --output
Short -o
--netname
-n
Description Base name filebase of the generated output files, optionally with path Base name designbase of the VHDL design units
If these options are not specified, both filebase and designbase are derived from the network name. These variables will be used in the next section.
A.4 Network Construction Programs
138
Additional options for the individual programs are listed below. serial_tb_stimuli.pl Long --tb_inputfile --tb_compfile
Short -i -c
Description Name of the generated testbench input file Name of the generated testbench reference file
serial_net.pl Long --tb_stimuligen
Description If present, also the VHDL testbench stimuli files are generated
network.pl Long --two_layers
Description Only use the first two layers for network generation This option should not be used and is only present for legacy reasons.
Arguments All tools require the exported network network_file as the first argument. The second argument is the exported test pattern file test_pattern_file which is only present when stimuli file generation is requested.
A.4.3.2 Structure of the generated Files The file names are derived from the value of filebase. File Name filebase_network.vhdl filebase_moptin.vhdl filebase.vhdl filebase_in.txt
Source network.pl moptin_net.pl serial_net.pl serial_tb_stimuli.pl
filebase_out.txt
serial_tb_stimuli.pl
Contents Neural Network Moptin-Net Serial-Net Input stimuli for the Serial-Net VHDL testbench Reference stimuli for the Serial-Net VHDL testbench
A.4 Network Construction Programs
139
Inside the VHDL files, the names of the design units are derived from designbase. Neural Network Entity name . . . . . . . . . . . . . . . . . . . Architecture name . . . . . . . . . . . . . Configuration name . . . . . . . . . . . . Moptin-Net Entity name . . . . . . . . . . . . . . . . . . . Architecture name . . . . . . . . . . . . . Configuration name . . . . . . . . . . . . Serial-Net Entity name . . . . . . . . . . . . . . . . . . . Architecture name . . . . . . . . . . . . . Configuration name . . . . . . . . . . . . Testbench configuration . . . . . . . . Backannotation configuration . . .
nn_designbase_e nn_designbase_a nn_designbase_c moptin_designbase_e moptin_designbase_a moptin_designbase_c serial_designbase_e serial_designbase_a serial_designbase_c tb_designbase_c tb_backanno_designbase_c
A.4.3.3 Stimuli File Format for the Serial-Net Testbench The stimuli files for the Serial-Net are generated by serial_tb_stimuli.pl. They are intended for the VHDL testbench, but in-system verification is also possible. As stated in Chapter A.4.3.2, an input stimuli file and a reference stimuli file are written. The testbench first requests the Characteristics from the Serial-Net, then it initialises the weight values and sends the network inputs. The data is taken from the input stimuli file. All replies from the Serial-Net are then compared with the values from the reference stimuli file. The file format is very simple. Each line stores one 8-bit data block for the UART Interface of the Serial-Net in binary representation with 8 digits. These blocks are send and received in succession. No leading spaces or empty lines are allowed. Trailing characters—except for one string with special meaning—should be ignored and are used for comments about the frames. In the input stimuli file a trailing “␣WAIT” after a data block prohibits the sending of further data blocks, unless a ’CycleDone’ frame followed by an ’Idle’ frame are received. This procedure is used to permit the Serial-Net to finish processing of the current set of network inputs, before the next inputs are transmitted.
A.5 Network Implementation Guide
140
A.5 Network Implementation Guide The complete implementation process—from the problem at hand to the generation of the MCS file—will be presented here in detail. The result is a MCS file containing a Serial-Net implementation of the problem which can configure a FPGA. It should be noted that this guide does not explore all possible options and details. It only gives the general directions to obtain a neural network implementation.
Presumptions The VHDL source code and all programs of the toolchain are available and functional. The user can operate JavaNNS to generate and train a neural network and has basic knowledge about neural networks themselves. The file base name is defined as nn . Network Generation and Training After analysis of the problem, the network must be built and trained using JavaNNS. The training expects the samples stored in JavaNNS pattern files. The pattern file format is described in the JavaNNS manual [15]. It is very basic and can be easily adopted from example files which are e. g. provided in the JavaNNS distribution. It is advantageous to distinguish between training and verification samples. While the network is trained with the training samples only, the verification samples are used to evaluate the training progress. After obtaining a satisfactory result, the network and stimuli are exported according to Appendix A.4.1.2. The file names are nn.net for the network and nn.res for the result file. Use nn as network name. Fixed Point Analysis Using CNSIM, the exported network can be analysed with various fixed point data widths. The data type characteristics are read from a configuration file which is typically named cnsim.cfg . For each run the deviations between the JavaNNS reference values and the calculated values are printed. Command line: cnsim -q --cfg cnsim.cfg --net nn.net nn.res After selecting a suitable trade-off between the number of bits used and accuracy, the network and stimuli can be written to files by the command line options --writenet and --writestim .
A.5 Network Implementation Guide
141
Command line: cnsim -q --cfg cnsim.cfg --net nn.net nn.res \ --writenet nn.net.exp --writestim nn.stim.exp Toplevel VHDL Files Generation Now the CNCONV tools are used to generate the toplevel VHDL files and testbench stimuli. To create a Serial-Net, the program serial_net.pl is called. Command line: serial_net.pl --tb_stimuligen nn.net.exp nn.res.exp Synthesis The generated VHDL files nn.vhdl, nn_moptin.vhdl and nn_network.vhdl are put into the VHDL source tree for synthesis. The target directory is src/generated/serial_net/ . Put the stimuli files nn_in.txt and nn_out.txt in the directory simulation/ . If the Moptin-Net should use BlockRAM, the file nn_moptin.vhdl must be manually modified as follows: • Remove component declaration of sync_RAM_e • Replace all instances of sync_RAM_e by correctly sized BlockRAM – Remove generics – Replace component name
– Replace port names
sync_RAM_e piData poData piADR piWE CLK
BlockRAM din dout addr we clk
It is also needed to generate single-ported BlockRAM modules of correct memory size, e. g. with Coregen.
A.5 Network Implementation Guide
142
For synthesis customise the following source files: Toplevel Vibro-Board src/vibro/toplevel_serialnet.vhdl Find all lines marked by “--MODIFY” and insert the network name. For this example it is serial_nn_e; the network name is the entity name of the generated Serial-Net.
Configure Synthesis include_fst/config.fst Set nn or any other design name for the variable DESIGN_BASENAME. All generated files will get this base name. Set SERIAL_NET_BASE_FILE_NAME to the file base name of the Serial-Net VHDL file, relative to the src/generated/serial_net/ directory. In this example use nn .
Write Configuration in Directory src/vibro/config/ Generate a VHDL configuration of the Serial-Net. First copy the template file template.vhdl in this directory to a new name, like nn.vhdl . Find all lines marked by “--MODIFY” in the file and follow the given instructions.
Configure Backannotation src/make_sourcefiles Set BACKAN_BASENAME to the same value as DESIGN_BASENAME in synthesis – here nn . Assign to BACKAN_SRC the configuration file name from the last step, relative to the src/ directory – here vibro/config/nn.vhdl . The name of the backannotation VHDL configuration is assigned to the variable BACKAN_CONFIG. Following the conventions from the template file, it is tb_vibro_backanno_nn_c . Assign the file base name of the Serial-Net VHDL file to the variable SERIAL_NETWORK_NAMES. It is the same value as for SERIAL_NET_BASE_FILE_NAME in synthesis – nn . The steps “Write Configuration” and “Configure Backannotation” can be skipped if no simulation of the design is wanted. After doing the set-up a VHDL compilation can be started by typing make rebuild in the directory simulation/ . It should complete without errors. If this is the first run of vcom, the work library must be created beforehand by the command make createlib .
A.6 Contents CD-ROM
143
The synthesis itself is started by make chip in the root directory of the VHDL source tree. The resulting MCS file is placed in the directory xact/ . To simulate the backannotation, type make backan followed by make backan_sim in the directory simulation/ .
A.6 Contents CD-ROM The attached CD-ROM contains the sources of all created projects and information gathered from other origins. Files da_rola.pdf and da_rola_print.pdf Diploma thesis for viewing and printing. The documents differ in the way hyperlinks are highlighted. Directory projects/ Project sources VHDL CNSIM CNCONV CNET Latex Example Networks Data Discretisation FPC Comparison Presentations
VHDL source of the hardware implementation Chemnitz Network Simulator CNSIM Converter Chemnitz Network Verification tool for synthesised Serial-Networks Diploma thesis source Example neural networks for evaluation Data discretisation study Comparison between Neural Network and Fuzzy Pattern Classifier Slides for intermediate and diploma colloquium
Directory repositories/ Subversion repositories which contain the sources of most projects. Subversion is a version control system which allows to recover older versions of the content or to examine the history of how the content changed. Directory 3rd_party/ Papers and programs collected from other sources over the course of this thesis.