than 31 days a value of '-99X' is recorded. Each entry contains the .... 6. DATA APPLICATIONS. As of late August 1994, the CPRDB has been accessed by 53 ...
DESIGN OF A PACIFIC RAINFALL DATABASE Mark A. Shafer and Mark L. Morrissey
Oklahoma Climatological Survey The University of Oklahoma Norman, Oklahoma
1.
INTRODUCTION
The Pacific Ocean represents a traditionally data-poor region, yet an area which is critical to the understanding of the global hydrologic cycle and a principal focus for studies of global climate change. To enhance the research community's access to data from this vital region, the Oklahoma Climatological Survey (OCS) has developed a Comprehensive Pacific Rainfall DataBase (CPRDB). The CPRDB collects data from different area meteorological agencies into a central location which is accessible to the research community. In addition to the single -source advantage of the CPRDB, the project provides easy access and retrieval of subsets of data for a region or time period of interest. The development of the CPRDB was in response to the difficulty of obtaining rainfall data in the region in a timely fashion for comparison to satellite rainfall estimates. The daily data base grew out of previous work by Morrissey and Greene (1991), which compiled monthly rainfall data for atolls in the tropical Pacific Ocean.
The data are formatted to values in millimeters, reported in increments of 0.1 mm. This provides a consistency between data from the different meteorological services and NCDC. * Corresponding author address: Mark A. Shafer, Oklahoma Climatological Survey, 100 E. Boyd, Suite 1210, Norman, OK 73019-0628.
Data are supplemented from observations by the Schools of the Pacific Rainfall Climate Experiment (SPaRCE; Postawko et. al (1994)). Approximately 30 schools currently participate in the collection of daily rainfall data in the same region. This contribution increases the data available to the CPRDB by nearly 25% each month. While many of these stations are in areas near other reports, several lie in areas where large gaps in coverage exist with the conventional data sources. Data are reported as quickly as other stations, with a lag period of about 2-4 months from the end of the data collection period.
3. 2.
DATA FILE FORMAT
DATA SOURCES
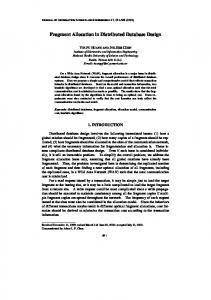
Data are from a region of the equatorial Pacific Ocean, bounded approximately by 135 degrees East and West Longitude and 20 degrees North to 25 degrees South Latitude (figure 1). Data from this area are particularly difficult to obtain in a timely fashion. One reason is the remote nature of many stations. Another is that three different meteorological services are responsible for collection of the data: New Zealand Meteorological Service (NZ), the National Climatic Data Center (NCDC) and the French Polynesian Meteorological Service (FR). Approximately once a month, daily ra infall data are received from the three regional meteorological services. These data, which are in manuscript format, are manually entered into a spreadsheet. Data are double -checked for accuracy.
As data are entered, a preliminary level of quality assurance is performed. Each observation has a QA flag attached, to indicate missing (M), accumulated (A), or estimated values(E). Estimated values are those reported by regional meteorological services and not by this project. Accumulated data are preceded by 'S' on days over which the reported accumulation occurred. This lends a distinction between missing data points and those included in subsequent values. Trace values (T) are reported by NCDC and are included as '0T' entries. Other meteorological services do not report trace accumulations. Data are merged into station re cord files. Each station has a file according to its region and WMO id number. Within each of these files is a list of daily rainfall data. There are 31 entries per line, one
for each day of the month. If the month has fewer than 31 days a value of '-99X' is recorded. Each entry contains the daily rainfall value in tenths of millimeters with the QA flag. The beginning of the line contains a record of the station id, year and month. Quality assurance tests are being developed. Any observation failin g a QA test will be flagged with a '?', leaving the decision about whether or not to use the observation to the researcher. Tests are being designed to identify outliers, incorrect recording procedures and other obvious inhomogeneities in the data. One of the largest potential problems results from enhancement of rainfall due to orographic affects. This will cause island reporting stations to record higher precipitation than atoll stations. Care must be taken to compare stations with similar geographical characteristics.
4.
METADATA CATALOG FILE
A metadata catalog has been developed for easy reference. The following metadata are recorded in the file for each station: - Source region for the data (US, NZ, FR, or SP=SPaRCE) - WMO id number (SPaRCE id numbers are assigned by the project - Time of observation, in local time - Latitude and Longitude to the nearest minute - Elevation of the reporting site, in meters - Geography of observing site (A toll, Island, Low Island, Raised A toll) - Maximum elevation of island / atoll - Period-of-Record of observations (P.O.R.) - Percent of observations present during the P.O.R. - Island or Atoll group (e.g., Marshall Islands) - Station Name (island, nearest city, research station, military base, etc.) The metadata catalog is still undergoing enhancements. Particularly lacking at the time of writing are time of observation for many sites and maximum elevation of islands. Geographical information has proven elusive for many of the smaller islands in the area. There remain several stations for which latitude, longitude, elevation and station name have not been identified.
5.
RETRIEVAL PROCEDURE
The CPRDB can be accessed directly by researchers via a captive telnet account on a VaxStation computer. In development of the data distribution system, we recognized the need for flexibility in selecting data countered by the need for protection of the 'raw' data and other data residing on the system. Consideration was given first to placement of all data files on an anonymous ftp account. This proved cumbersome, because users were required to download multiple files or the entire data set. We wanted the flexibility for users to run a program to extract a subset of data from the data base. An extraction program was developed and tested in -house. A request form was placed at the anonymous ftp site, which a user could retrieve and return to OCS via e-mail. A student operator would then run the extraction program and place the file of selected data on the anonymous ftp account. This too proved cumbersome, in that processing delays occurred and the operator spent considerable time extracting data and not as much time entering new data. We settled on a combination of a captive telnet account and anonymous ft p site. The captive account allows a user to log in directly to the computer housing the data base and run the extraction program (address 129.15.41.101). Only a telnet site provided the capability for this type of interaction. A captive account was chosen to secure the data and other data on the system. Upon connecting to the account, a data extraction program is automatically run, which allows the user to select parameters from the following list: - individual stations - island / atoll groups - latitude / longitude range - time frame - type of observation site (e.g. atolls only) - minimum record quality (percent of observations) One or more of these parameters can be selected before data are extracted. An individual data file is then written to an anonymous ftp site for later retrieval. The file is personalized by the user's first name initial and first seven letters of the last name (e.g., Clark Kryptonite would have a file ckrypton.dat created). When the extraction is complete, directions for retrieval of the data file are written to the screen. The user is then logged off the telnet account and the connection closes. To retrieve the file, the user connects to the same address via ftp and registers as 'anonymous'.
The individual file will be in a pacrain directory on the account. The metadata catalog file is also in the directory available for download. In addition to the creation and retrieval of data sets, users are asked for some information, including name, affiliation, mailing address and e -mail address. This allows our project to understand some of the applications of the data and try to better meet the needs of the research community. Mailing address is requested so that a technical report (Morrissey et. al., 1993) describing the data set can be sent for future reference. E-mail address is requested so that notification can be sent to users if there are substantial changes to the system or data. The above information is recorded for each person so that re entry of this information is not required each time a user accesses the data base. Each use creates a mail message containing user information and notification of a request for a copy of the companion technical report. The mail message is sent to the project administrators, allowing easy monitoring of the system and quick response on mailing copies of the technical report.
6.
DATA APPLICATIONS
As of late August 1994, the CPRDB has been accessed by 53 different users from 11 countries. The majority of users were from the United States, split approximately evenly between academia and federal government. The CPRDB has been accessed from the United Kingdom, Australia, Germany, Portugal, Spain and Canada. In addition, three international requests were filled via mailed diskettes: Japan, India and Fiji. The majority of users are affiliated with academic units. Of the 38 United States users, 20 were from academia. Of the 15 international users, 9 were from academia. The CPRDB has been accessed a total of 263 times since it was made available in late 1993. Primary use seems to be for development and testing of satellite rainfall algorithm estimates of precipitation. Because of the relative lack of data over the Pacific Ocean - an area vital to understanding the global hydrologic cycle - the Pacific rainfall data base provides a valuable resource. Data have been used in WetNet's PIP-1 (Morris sey et al, 1994) and other similar programs. In addition to satellite estimates, the non-
uniform spatial distribution of the data provided an opportunity to apply new statistical techniques to determine areal estimates of precipitation. An atoll rainfall data set was used in the application of the Non-Contiguous Raingage technique to satellite algorithm verification studies (Morrissey 1991, Morrissey and Greene, 1993).
7.
SUMMARY
The CPRDB combines data from a region administered by three different meteorological services covering a large portion of the Western and Central Pacific Ocean and combines the data into a single source available to the research community. Rather than placing requests to each meteorological service, researchers are able to access rainfall data from the entire region and receive a response quickly, and without the associated data access fees. Furthermore, the density of observations is enhanced through the inclusion of data from the SPaRCE program. Data are also checked for quality, with quality-assurance symbols attached to each data value. These symbols are set to a single standard, rather than the different symbols used by the different meteorological services. Future enhancements to the data base will include spatial and temporal comparisons among the data. Comparisons between the data base and print records are ongoing to assess data translation errors. Ease of use is another advantage of the CPRDB. Through a single source, a researcher is able to isolate regions, time periods, sources or topographical characteristics of interest without having to sort through a large data set. The metadata file provides the researcher with a single source for generally hard -to-find information. In addition, the frequent updates to the data base frees a researcher from having to search for new data; a simple check of the news files will provide information about the latest update. REFERENCES: Barrett, E.C., R.F. Adler, K. Arpe, P.Bauer,W. Berg, A. Chang, R. Ferraro, J. Ferriday, S. Goodman, Y. Hong, J. Janowiak, C. Kidd, D. Kniveton, M. Morrissey, W. Olsen, G. Petty, B. Rudolf, A. Shibata, E. Smith, R. Spencer, 1994: The first WETNET precipitation intercomparison project (PIP-1): Interpretation of
results, Remote Sensing Reviews (in press). Morrissey, M.L., M.A. Shafer, H. Hauschild, M. Reiss, B. Rudolf, W.Ruth, and U. Schneider, 1994: Surface Data sets Used in WETNET's PIP-1, Remote Sensing Reviews (in press). Morrissey, M.L., M.A. Shafer, S. Postawko, and B. Gibson, 1993: The Comprehensive Pacific Rainfall Data Base, Oklahoma Climate Survey Tech. Rep. 93003, Norman, OK Morrissey, M.L. and J.S. Greene, 1991: The Pacific Atoll Raingage Data Set, JIMAR Pub. Morrissey, M.L. and J.S. Greene, 1993: A comparison of two satellite-based rainfall algorithms using Pacific atoll raingage data, J. Appl. Meteor., 32, No. 2, 411-425. Postawko, S., M.L. Morrissey, and B. Gibson, 1994: Schools of the Pacific Rainfall Climate Experiment: Combining research and education, Bull. Amer. Meteor. Soc. , 75,1260-1266.