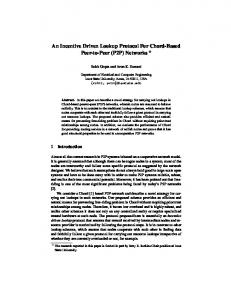
Design of a Robust Search Algorithm for P2P Networks? Niloy Ganguly1,2 Geoff Canright3 Andreas Deutsch2 1
Indian Institute of Social Welfare and Business Management, Management House, Kolkata, India n
[email protected] 2 Center for High Performance Computing, Dresden University of Technology, Dresden, Germany
[email protected] 3 Telenor Research and Development, 1331 Fornebu, Norway
[email protected]
Abstract. In this paper, we report a decentralized algorithm, termed ImmuneSearch, for searching p2p networks. ImmuneSearch avoids query message flooding; instead it uses an immune-systems-inspired concept of proliferation and mutation for message movement. In addition, a protocol is formulated to change the neighborhoods of the peers based upon their proximity with the queried item. This results in topology evolution of the network whereby similar contents cluster together. The topology evolution help the p2p network to develop ‘memory’, as a result of which the search efficiency of the network improves as more and more individual peers perform searches. Moreover, the algorithm is extremely robust and its performance is stable even when peers are transient.
1
Introduction
Due to their flexibility, reliability and adaptivity, p2p solutions like Gnutella [2], Napster [1], and Freenet [4] are becoming hugely popular. However, especially due to the unreliability of the peers, the development of an efficient search algorithm poses a fundamental challenge to researchers. The algorithm for search in p2p networks proposed by us in this paper is termed ImmuneSearch. It has been inspired by the simple and well known concept of the humoral immune system where B cells undergo mutation and proliferation to generate antibodies which track the antigens (foreign objects). ImmuneSearch uses proliferation and mutation to spread query message packets across the network. In addition, it evolves the topology of the p2p network in terms of adjusting the neighborhood of the participating peers. This gives rise to a loosely structured network where the overlay topology [3] roughly corresponds to the content in the network. Consequently, the algorithm ensures better quality of service (in terms of the number of search items found within a specified number of steps), and greater efficiency (in terms of the network congestion arising from the query packets) compared ?
This work was partially supported by the Future & Emerging Technologies unit of the European Commission through Project BISON (IST-2001-38923).
to the conventional schemes of random walk and message flooding [5]. The algorithm ensures robustness, that is, stability of performance in face of the transient nature of the network. It also guarantees autonomy to the users, who are not required to store any replicated files on their own machine. The next section describes the ImmuneSearch(IS) algorithm in detail. Section 3 details the different simulations performed based upon the algorithm ImmuneSearch. The simulation results reflect the potential of ImmuneSearch to perform fast and accurate search as well as point to its adaptability to continuously changing situations of p2p networks. The concluding section summarizes important insights from our simulation studies, and presents an outline for further work.
2
Simulation Model
In this section, we describe the framework chosen to model the p2p environment and the ImmuneSearch algorithm. 2.1
Abstraction
The factors which are important for simulating p2p environments are the overlay topology, the profile management of each individual peer, the nature of distribution of these profiles and the affinity measure based upon which the search algorithm is developed. Each of these factors is discussed one by one. Topology : The overlay topology responsible for maintaining the neighborhood connections between the peers in the p2p network is considered to be a (100 × 100) toroidal grid where each node in the grid is conceived to be hosting a member (peer) of the p2p network. Each node has a fixed set of eight neighbors. A peer2 residing in a particular node has correspondingly eight neighbors. Each peer carries two profiles - the informational profile and the search profile. Profile : The informational profile (PI ) of the peer may be thought of as a description of the information stored by the user. The search profile (PS ) of a peer is built from the informational interest of the user. In general, the search profile may differ from the information stored on the peer. For simplicity we assume that there are 1024 coarse-grained profiles, and let each of these profiles be represented by a unique (d = ) 10-bit binary token. The query message packet (M ) is also a 10-bit binary token. From now on we interchangeably use the term profile and token. Similarity between a profile P and a query message packet (M ) that is, sim(P, M ) = d − HD(P, M ), where HD is the Hamming distance between P and M . The frequency of the profiles follows Zipf’s distribution [6]. 2
Although, in standard literature, ‘peer’ and ‘node’ are synonymous terms, the terms have been differentiated in the paper for ease of understanding. Node here means a position in the grid and essentially indicates a neighborhood configuration. A peer entering the network is assigned a node by the overlay management protocol. During topology evolution (discussed next) peers occupy new nodes and acquire new sets of neighbors.
2
The ranking of tokens in terms of frequency is the same for both information and search profiles—for instance, the most popular information profile is also the most popular search profile. On the basis of the above discussed model, we now present the search algorithm ImmuneSearch. 2.2
ImmuneSearch Algorithm
The ImmuneSearch algorithm defines the movement of the query message packets through the network and the topology evolution initiated as a result of search. Packet Movement : The search in our p2p network is initiated from the user peer. The user (U in Fig. 1) emanates message packets (M ) to its neighbors - the packets are thereby forwarded to the surroundings. The message packets (M ) are formed from the search profile PS of U . The message packets spread in the network by undergoing random walk on the grid, but when they come across a matching profile (information profile of any arbitrary peer), that is, the similarity between a message packet and informational profile is above a threshold, the message packet undergoes proliferation (as around peer A of Fig. 1), so as to find more peers with similar information profile around the neighborhood. Some of the proliferated packets are also mutated. (Cf. the differently colored message packets around A in Fig. 1). Mutation has two-fold consequences. First of all, due to mutation the chance of message packets meeting similar items increases, which in turn helps in packet proliferation. Secondly, the concept of mutation can be used in the future to help the user peer to find a wider variety of search items. The mutation results in finding new items which may not have been exactly queried. But these suggestive new results can be helpful for the user3 . (This aspect of mutation is not dealt with in this paper). Proliferation and mutation will initiate an intensified search around the neighbors of the peers which are already found to be similar to the queried profile. This implicitly points to the importance of topology evolution of the network, which should ensure that peers which have similar profiles come close to each other. Due to clustering, packets after proliferation will immediately begin to find peers with similar information profiles, thus enhancing the efficiency of search. Topology Evolution : In the topology evolution scheme, the individual peers change their neighborhood configuration during search so as to place them ‘closer’ to U . Fig. 1 illustrates the exact mechanism of this movement. In the figure, peer A moves (changes its neighborhood configuration) from node 7 to node 13 to place itself ‘closer’ to U . Correspondingly, other peers adjust their positions. We now explain the factors based upon which a peer decides to change position as well as the rules guiding the degree of change. A peer (say A) decides to change its neighborhood configuration and places itself ‘closer’ to the user, when similarity between the profile of peer (P ) and the 3
An example of this is the Amazon.com criterion of statistical correlation: “Users who sought [query Q] have also often been interested in [. . .].”
3
U 1
2
3
4
5
6
7
8
9
10
11
C
Anew 13
A 12
Move
To facilitate A’s movement from node 7 to 13; peers in node 6, 5, 13, respectively, move to node 7, 6, 5. For example, peer C which initially was residing in node 6 having peers at node numbers {1, 2, 3, 5, 7 (= A), 9, 10, 11} as neighbors, after topology evolution resides in node number 7 and has peers at node numbers {2, 3, 4, 6, 8, 10, 11, 12} as neighbors. In effect, peer C changes three neighbors [Neighbors previously residing in (1,9,7=(A)) for (4,8,12). (The peer which was earlier residing in 5 now resides in 6, hence there is no change in this case.)] Fig. 1. The Search Mechanism (packets passing and topology evolution).
message (M ) sent by user peer (say U ) is above a threshold level. The similarity can be of two types: (i) Similarity between information profile (PI ) of the peer (A) and the message packet (M ), and (ii) similarity between search profile (P S ) of the peer (A) and the message packet (M ). The amount of movement of A towards the user peer (U ) is proportional to (a) the similarity between them (P and M ) either in terms of (i) PI or (ii) PS ; and (b) the distance between node U and node A. (Each message packet carries the node number of the user peer U which initiated the query, so that each peer can estimate the distance between it and U ). (c) The movement of the peer is also controlled by another important process which is inspired by natural immune systems - aging. The movement of a peer gets restricted as it ages. The age of a peer is determined in terms of the number of times it undergoes movement as a result of encountering similar message packets. That is, the longer it stays in the environment (p2p network), the more it is assumed that the peer has found its correct node position, and hence the less it responds to any call for change in neighbors towards any user peer U . If the search profile (PS ) of peer A matches M , but the peer (A) has performed the search operation more times than U , then there is no movement of the peer A towards user peer U . The aging concept lends stability to the system; thus a peer entering the p2p network, after undergoing some initial changes in neighborhood, finds its correct position. 4
3
Simulation Results
The experimental results, besides illustrating the efficiency of the ImmuneSearch algorithm, also show the self-organizing capacity of the algorithm in face of heavy unreliability of the peers participating in a p2p network. We also simulate experiments with a random walk, two schemes of proliferation/mutation termed proliferation1 and proliferation2 , as well as a simple flooding technique. In proliferation1 and proliferation2 , peers basically execute the ImmuneSearch algorithm without the Topology Evolution step. The threshold conditions applied to the two schemes differ; this point will be discussed later. 3.1
Experimental Setup
To understand the effect of proliferation and mutation rates, experiments with different rates and different threshold values have been performed. From these, we report two cases which represent two main trends observed by us. In both cases, the proliferation and mutation rate is the same; however, the value of Threshold(Pro/Mut) differs. For the first case, Threshold(Pro/Mut) is (d - 1); while in the second case, it is (d - 2) (d is the length ( = 10) of the token). ImmuneSearch and proliferation1 represents the first case, while proliferation2 represents the second case. The number of packets proliferated (N R) in the neighborhood is given by the following equation - N R = 8 · S, where S = sim(PI ,M ) ; while the probability of each packet undergoing one bit mutation d (M P ) is 0.05. The threshold value required for topology evolution is set to d. Each search is initiated by a peer residing at a randomly chosen node and the number of search items (ns ) found within 50 time steps from the commencement of the search is calculated. The search output (ns ) is averagedPover 100 different 100
n
s searches (a generation), whereby we obtain Ns , where Ns = i=1 100 . In the graphs (Fig. 2 & 5 ) we plot this average value Ns against generation number to illustrate the efficiency of different models. We perform two types of experiments within the above mentioned experimental setup. In the first experiment, no peers leave the system, while the second experiment represents a more transient situation where peers leave/join the network at random.
3.2
Expt. I : Search in Stable Conditions
This experiment is carried out with the assumption that no peer leaves the system. We have initiated experiments with random walk, two types of proliferation/mutation schemes (proliferation1 and proliferation2 ), limited flooding, and ImmuneSearch. The graph of Fig. 2 displays the performance of the five different models. The x-axis of the graph shows the generation number while the y-axis represents the average number of search items (Ns ) found in the last 100 searches. The performance comparison of the above mentioned five methods obeys fairness criteria which are discussed next. Fairness in power : To provide fairness in ‘power’, two different approaches are taken. The first approach defines fairness among ImmuneSearch, proliferation 2 , 5
Profile Matched Per Generation
random walk, and limited flooding, while the second approach defines fairness between ImmuneSearch and proliferation1 . The initial conditions (number of message packets) for ImmuneSearch, proliferation2 , and random walk, are chosen in a way such that the total number of packets used over 50 time steps of each individual search is roughly the same. In the case of flooding, we have allowed the process to run for x number of steps where x (< 50) steps uses the same number of packets as the aforesaid three cases used in 50 time steps. Proliferation1 and ImmuneSearch have the same threshold level for proliferation, and the same proliferation/mutation rate. But due to topology evolution, the message packets during ImmuneSearch pass through thickly populated areas with similar information profile and are able to produce more message packets. Search Efficiency : In Fig. 2, it 90 is seen that the number of search 80 items (Ns ) found is progressively higher in limited flooding, random ImmuneSearch 70 Proliferation1 Proliferation2 walk, proliferation2 , proliferation1 , Random Walk LimitedFlooding 60 and ImmuneSearch, respectively. The proliferation1 , proliferation2 , ran50 dom walk, and limited flooding maintain a steady search output of around 40 50, 40, 30, and 15 hits respectively. 30 In the ImmuneSearch algorithm, 20 it is observed that after it starts at an initial output of around 55 10 0 10 20 30 40 50 60 70 80 90 100 items per search, it steadily increases Generation Number th to 80 within the 25 generation, and then maintains a steady out- Fig. 2. Efficiency of different techniques of put of about 80 per search. There- search namely ImmuneSearch, proliferation1 , fore, the first 25 generations can proliferation2 , random walk and limited floodbe termed as ‘learning’ phase. Dur- ing. (Search results are averaged over 20 simuing this time, similar to natural lation runs). immune systems, the p2p network develops memory by repositioning the peers. The repositioning results in clustering of peers with similar profiles which is discussed next. Clustering Impact : The series of snapshots in Fig. 3 demonstrates the clustering effect in the p2p network as a result of ImmuneSearch. Each figure represents the configuration on the 100 × 100 overlay grid taken to host the 10,000 peers. In Fig. 3a. & b., each peer displays its two profiles PI and PS . (The big dots represent the search profile of a peer (PS ) while the small dots are the informational profile (PI )). In Fig. 3c, we show only the informational profile represented as dots. The second snapshot (Fig. 3b) exhibits the clustering of the most frequently occurring profile at generation number 24 (the generation around which ‘learning’ is more or less complete) from the initial scattered setting (Fig. 3a). The snapshot of generation 24 shows that peers with search profile PS intermingle 6
a b Clustering of information (small dots) and search (big dots) profile of peers possessing most frequent tokens at generation no. 0, 24 respectively.
c Information profile of peers hosting 11th most frequent tokens at generation 100.
Fig. 3. Snapshots showing clustering of similar peers in the p2p network.
with the peers with information profile PI . That is, execution of the algorithm results in the peers with search profile (PS ) positioning themselves in ‘favorable’ positions whereby, when these peers initiate search, the message packets emanated by them immediately begin to find peers with similar profiles. The clustering of the peers, as seen in Fig. 3b, is roughly divided into three major clusters; and it is notable that the clusters are porous. The porous and separated clusters are a result of ongoing competition among the differently frequent tokens and as a result of it also less frequent tokens obtain space to form clusters. Subsequently, their search output is also enhanced. (As an example, Fig. 3c shows clusters of peers hosting the 11th most frequent token). The next important aspect of the experimental results which needs to be discussed is the cost incurred during search. Cost and Self-Regulation : Cost is defined as the number of message packets spent per successful item searched. Since, already, in order to be ‘fair’, we have assigned each process the same ‘power’, intuitively, we can say that cost will vary inversely to performance. However, while experimentally demonstrating this fact in the following paragraphs, we also illustrate another important self- organizing property displayed by the ImmuneSearch algorithm. In order to illustrate the self-organizing property, we next present the result of a single experiment. The graph of Fig. 4(a) displays the performance analysis of the five different models based upon a single experiment. Similar to Fig. 2, the x-axis of the graph shows the generation number while the y-axis represents the average number of search items (Ns ) found in the last 100 searches. However, unlike Fig. 2, in this figure we see that the search results of all the models are oscillating in proportion to their average output. The oscillations occur due to the sampling differences at each generation. However, these oscillations help us to understand the cost regulation mechanism inbuilt within proliferation/mutation schemes, explained next. 7
100
20 ImmuneSearch Proliferation1 Proliferation2 Random Walk LimitedFlooding
18
16
80
Cost Per SearchItem
Profile Matched Per Generation
90
70
60
50
40
30
12
10
8
6
4
20
10
ImmuneSearch Proliferation1 Proliferation2 Random Walk LimitedFlooding
14
2
0
10
20
30
40
50
60
70
80
90
100
0
0
10
20
30
Generation Number
40
50
60
70
80
90
100
Generation Number
(a)Ef f iciency
(b)Cost
Fig. 4. Efficiency and cost of different techniques of search namely ImmuneSearch, proliferation1 , proliferation2 , random walk and limited flooding. (Search results are based on one experiment).
Fig. 4(b) displays the cost each scheme incurs (y - axis) to generate the performance of Fig. 4(a). The packets are assumed to be present in the network throughout the 50 time steps executed during a search instance. It is seen that for limited flooding, it is around 16 packets per item searched, while it is just around 2 in case of ImmuneSearch and proliferation1 . Two interesting observations are worth mentioning here. First of all, the cost is almost the same in proliferation1 and ImmuneSearch. It is seen that keeping the same constraints for proliferation/mutation implies almost the same cost in the network. Only the number of search items differs according to the topology of the network. The interesting feature is further demonstrated through the second observation. We see that the cost of all the three schemes using proliferation and mutation for packet movement (proliferation1 , proliferation2 , ImmuneSearch) almost remains constant throughout the total period, although the number of items found through search (Fig. 4 (a)) varies considerably during this period. The above two observations point to the fact that proliferation and mutation have a self-regulatory quality inherent within them. As a result of this, in the ImmuneSearch algorithm, the packets are not generated blindly, as with flooding, but are instead regulated by the availability of the searched item. 3.3
Expt II : Search in Transient Conditions
The robustness of the algorithm is demonstrated by the following experiment. In this experiment, 0.5%, 1%, 5%, or 50% of the population, respectively, is replenished after every generation. This mimics the transient nature of p2p networks where peers regularly join and leave the system. 8
85
350
80
Movement Per Generation
Profile Matched Per Generation
300 75 70 65 60 55 50 45
ImmuneSearch (without Replacement) ImmuneSearch(with 0.5% replacement) ImmuneSearch (with 1% replacement) ImmuneSearch (with 5% replacement) ImmuneSearch (with 50% replacement) Proliferation1
40 35 30
0
10
20
30
40
50
60
70
80
90
250
Without replacement 0.5% Replacement 1% Replacement 5% Replacement 50% Replacement
200
150
100
50
0
100
Generation Number
0
10
20
30
40
50
60
70
80
90
100
Generation Number
(a)Performance efficiency
(b)Change in neighborhood
Fig. 5. Performance efficiency and amount of change in neighborhood undergone by peers when there are 0%, 0.5%, 1%, 5% and 50% replacement of peers after each generation respectively. (Results are average of 20 simulation runs).
Fig. 5(a) showing the performance of the ImmuneSearch, under various degrees of replacement, illustrate two important results. (i) First of all, even in face of dynamic change, the ImmuneSearch algorithm ‘learns’, in that, after some initial generations, the efficiency increases. The amount of increase in search efficiency, are generally dependent on the percentage of replacement the p2p network undergoes after each generation. We find that the performance of proliferation 1 (which has been plotted as a reference point) is roughly the same when there is 50% replacement. But replacement of 50% of all peers within 100 searches is likely far higher than any realistic turnover rate. (ii) However, the more important point to be noted is that at 0.5% replacement, we observe that the performance is in fact at par and sometimes slightly better than ImmuneSearch without replacement! The result establishes one important positive point about the algorithm - that is, a little transience is helpful, rather than detrimental, to the performance of the algorithm. This happens because the problem of developing a search algorithm is in fact a multi-objective optimization problem, and due to the enormous complexity, we are obtaining a ‘good’, however not optimal solution. So a little change in peers is facilitating the system to move quickly towards a better solution. We next discuss the extent of neighborhood changes the peers have to undergo. Change in Neighborhood : Fig. 5(b) shows the amount of change in neighborhood of the constituent peers (y-axis) . One unit of movement implies the movement of a peer from one node to a neighboring node. We can also refer to a unit of movement as a neighborhood change. It is seen that in all the cases (0%, 0.5%, 1%, 5% & 50%), initially, there are 9
around 300 neighborhood changes, per search. That is, when a search goes on for 50 time steps, at each time step there are around 6 peers changing their neighborhood (or 1 peer changing neighborhood 6 times). However, the movement of the peers in all the cases, except the first case, gradually reaches a steady level. In the first case, plotting the movement over many generations produces a monotonically decreasing curve, which implies that the system will eventually reach a state in which there will be no further movement. In the other cases, the amount of movement at steady state increases monotonically (but sublinearly) with the percentage of peers leaving the network. For example, in cases of 0.5% and 1% replacement, the change in neighborhood becomes quite insignificant and are around 30 and 50 neighborhood changes per search respectively. The monotonically decreasing graph for the case where no peers leave the system is the result of the concept of aging, whereby, after some time, the system stops rearranging the peers. The steady level of movement maintained by other cases can be directly attributed to the dynamic nature of the system. As new peers are joining the system, the system as a whole tries to adjust to the changing conditions. This shows that the system on the whole tries to learn, while at the same time does not unnecessarily undergo neighborhood changes.
4
Conclusion
This paper has presented a search algorithm which derives its inspiration from natural immune systems and whose underlying guiding rules are generally also very simple. We find that as a result of the algorithm, the p2p network ‘learns’ and subsequently develops memory, whereby the search efficiency improves dramatically after some initial learning/training phase. The system also gains capability to decide upon the number of message packets to be generated during the search for a particular item, according to the availability of that item. Thus the cost of search remains virtually constant irrespective of the item’s availability and the nature of the topology. The system also can withstand the transient nature of the peers. The basic strengths displayed by the ImmuneSearch algorithm need to be further explored and developed, by applying it in more realistic circumstances in the near future.
References 1. Napster. http://www.napster.com, 2000. 2. Gnutella. http://www.gnutellanews.com, 2001. 3. G Canright, A Deutsch, M Jelasity, and F Ducatelle. Structures and functions of dynamic networks. Bison Deliverable, www.cs.unibo.it/bison/deliverables/D01.pdf, 2003. 4. Freenet. http://freenet.sourceforge.net/. 5. Q. Lv, P. Cao, E. Cohen, and S. Shenker. Search and Replication in Unstructured Peer-to-Peer Networks. In Proceedings of the 16th ACM International Conference on Supercomputing, June 2002. 6. G. K. Zipf. Psycho-Biology of Languages. Houghton-Mifflin, 1935.
10