May 15, 2018 - Streptococcus pneumonia, Staphylococcus aureus, Staphylococcus ... cus hominis, Staphylococcus lugdunensis, Staphylococcus warneri,.
DOI: 10.26717/BJSTR.2018.04.001073 Krishna Gupta. Biomed J Sci & Tech Res
ISSN: 2574-1241
Research Article
Open Access
Design of Experiment Based Validated Stability Indicating Method for Determination of Besifloxacin Hydrochloride in Bulk Drug and Formulation Sonali S Askarkara, Anvesha V Ganorkara and Krishna R Gupta* Department of Pharmaceutical Chemistry, Smt Kishoritai Bhoyar College of Pharmacy, India Received: May 04, 2018; Published: May 15, 2018
*Corresponding author: Krishna Gupta, Department of Pharmaceutical Chemistry, Smt. Kishoritai Bhoyar College of Pharmacy, New Kamptee, Nagpur, Maharashtra, India Abstract A simple, precise, stability indicating RP-HPLC method was developed and validated for determination of Besifloxacin HCl (Besi) in bulk sample and application of that method for estimation of drug i.A Box–Behnken statistical design with three factors and five levels was employed to optimize the chromatographic conditions. The separation was achieved using solvent system combination using methanol:Acetonitrile: phosphate buffer pH 3(25:25:50). The developed method was validated for linearity, precision, accuracy, limit of detection and limit of quantitation, and robustness in accordance with the ICH guidelines. The method was found linear with regression coefficient of over a wide range of 2.5–15 μg/mL. All the validation parameters were found to be within the acceptance range. The developed method was successfully applied to estimate the amount of Besifloxacin HCl in pharmaceutical formulations. Abbreviations: BBD: Box-Behnken Design; CCD: Central Composite Design; FFD: Fractional Factorial Design; LOD: Limit of Detection; LOQ: Limit of Quantitation; ANOVA: Application of Analysis of Variance
Introduction Bacterial conjunctivitis is an inflammation of the conjunctiva, characterised by persistent mucopurlent discharge and redness of the eye [1]. It is generally a self-limiting disease and usually does not cause permanent loss of vision or structural damage to eye. Topical anti-bacterial is used to overcome this disease [2,3]. Bacterial conjunctivitis caused by those bacteria which infect the eye through various sources of contamination. The most common types of bacteria that cause bacterial conjunctivitis include Streptococcus pneumonia, Staphylococcus aureus, Staphylococcus epidermidis, Haemophilus influenza, Moraxella catarrhalis and Corynebacterium spp [4,5]. Aerococcusviridans, CDC coryneform group G, Corynebacterium striatum, Haemophilus influenzae, Moraxella catarrhalis, Moraxella lacunata, Pseudomonas aeruginosa, Staphylococcus aureus, Staphylococcus epidermidis, Staphylococcus hominis, Staphylococcus lugdunensis, Staphylococcus warneri, Streptococcus mitis group, Streptococcus oralis, Streptococcus pneumoniae, Streptococcus salivary [6]. Besifloxacin ophthalmic suspension 0.6%w/v was approved by US-FDA in 2009. The formulation uses Duracite® technology to increase the residence time of drug on the ocular [7,8]. Besifloxa
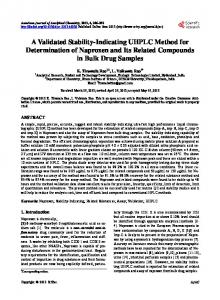
cin is a novel fluoroquinolone antibiotic for ocular pathogens that are currently resistant to present fluoroquinolone antibiotics [9]. Besifloxacin (7-[(3R)-3- aminohexahydro -1H-azepin -1-y1] – 8 – choloro -1- cyclopropyl – 6-fluoro -1,4-dihydro -4-oxo-3-quinolinecarboxylic acid )–(Figure 1) is a novel, chiral synthetic fluoroquinolone being developed by Bausch & Lomb for the topical treatment of ophthalmic infections. Structurally, besifloxacin has an N-1 cyclo-propyl group, which provides broad- spectrum activity against aerobic bacteria[10]. The main mechanism of action of besifloxacin is the inhibition of DNA gyrase and topoisomerase-IV enzyme that are involved in bacterial transcription replication and separation of chromosomal DNA during cell division [10]. This activity is enhanced by a C-8 chloride substituent in besifloxacin, which also exhibits improved activity against gram-positive bacteria relative to older fluoroquinolone while still remaining potent efficacy against anaerobic bacteria [11]. It is white to pale-yellowish white powder. It is sparingly soluble in water, methanol, ethanol and soluble in DMSO. pKa value of besifloxacin is 5.65 and 9.67. It has log P value of 4.712. Three different pH of phosphate buffer such as 2.5, 3.0 and 3.5 were stud-
Cite this article: Sonali S A, Anvesha V G,Krishna R G. Design of Experiment Based Validated Stability Indicating Method for Determination of Besifloxacin Hydrochloride in Bulk Drug and Formulation. Biomed J Sci &Tech Res 4(4)- 2018. BJSTR. MS.ID.001073. DOI: 10.26717/ BJSTR.2018.04.001073.
1/9
Krishna Gupta. Biomed J Sci & Tech Res
ied and optimized with DOE. This pH was used in the study for best retention of acidic drug in a reversed-phase system. For best retention, the pH of buffer or the mobile phase should be approx. two pH units below its pKa value. In this pH the drug will be totally unionized (more hydrophobic) which helps for better retention in a reversed-phase system. Literature review revealed RP-HPLC method for analysis of solubility, cytotoxic studies [12-14] stability indicating method of besifloxacin hydrochloride [15]. Quantitative estimation of besifloxacin hydrochloride [14] in human tears by liquid chromatographytandem mass spectrometry has been reported. Enantiomeric impurity in besifloxacin hydrochloride [15] is estimated by chiral HPLC with precolumn derivatisation. Besifloxacin in different simulated body fluids is estimated by UV spectrophotometric method.
Figure 1: Chemical structure of besifloxacin. Our aim is to develop simple, precise, economical and rapid HPLC method development for analysis of Besifloxacin in bulk and formulation. The novelty of present method is QbD driven assay method development using solvent system using Acetonitrile:Methanol: Phosphate Buffer pH 3. The QbD based approach provides deeper understanding of the interaction between the factors and their effect on responses. Hence a robust and less variability in method results is obtained. Most of the formulation studies involve only one variant at a time by keeping others as constant. With the help of full factorial design investigators can study the effect of all the factors by varied simultaneously. The factorial design helps to study the effects caused by independent factors and interactions between those self-governing factors. In the present work, three independent factors were used such as Mobile phase (X1), pH of buffer (X2) and flow rate (X3) and five dependent factors were used such as theoretical plate (Y1), tailing factor (Y2), retention time (Y3), Capacity factor (Y4) and Area (Y5).
Volume 4- Issue 4: 2018 Chromatographic separation was performed at ambient temperature on an ACE C18 Column (150 × 4.6 mm, 5μ). The Injection volume was 20 μL. Prior to injection of the drug solution, the column was equilibrate for some time with the mobile phase flowing through the system. The data were acquired, stored and analyzed with Design Expert Software Ver 7.0.
Preparation of Standard Stock Solution
Weighed and transferred accurately about 6.63 mg of Besifloxacin hydrochloride standard in a 25mL volumetric flask, 15 mL of methanol was added, sonicated to dissolve and diluted up to the mark with methanol (240μg/mL). 1 mL portion of this solution was further diluted to 10 mL with methanol (24μg/mL). 2 mL portion of this solution was again further diluted to 10 mL with methanol to get final dilution of4.8μg/mL.
Preparation of Sample Solution
An accurately weighed quantity about 1mL of marketed suspension was transferred in to 25mL of volumetric flask. 15 mL of methanol was added and sonicated for 10 min, diluted to volume with diluent. A 1mL of this solution was further diluted to 10mL with methanol (24μg/mL). 2mL portion of this solution was again further diluted to 10 mL with methanol to get final dilution of 4.8μg/mL. Chromatograms of working Standard and sample of Besifloxacin hydrochloride are shown in (Figures 2 & 3) respectively.
Figure 2: Chromatogram of working standard of Besifloxacin HCl.
Materials and Methods
Besifloxacin hydrochloride was a generous gift sample from Glenmark Pharmaceuticals, (Mumbai, India) and used as a working standard. The commercially available formulation of Besifloxacin hydrochloride i.e. Besix ophthalmic suspension 0.6% (Ajanta Pharrma Pvt. Ltd.) were used for Assay. Potassium Di-hydrogen Orthophosphate was of GR Grade, Methanol was of HPLC Grade. All the solutions were prepared with reverse-osmosis, HPLC grade double distilled water. The HPLC System was model Shimadzu and was composed of a binary pump, a mobile phase degasser, a Prominence diode array detector (SPD-M20A) etc. The mobile phase contains Acetonitrile: Methanol and Phosphate Buffer (25:25:50 v/v) with pH 3 adjusted with 1% solution of orthophosphoric acid, flow Rate of 1.0 mL/min and UV Detection was carried out at 297nm. Biomedical Journal of Scientific & Technical Research (BJSTR)
Figure 3: Chromatogram of Besifloxacin HCl Sample.
Method Development and Experimental Design A novel HPLC Method was developed using the mobile phase composition containing Acetonitrile:Methanol:Phosphate Buffer 2/9
Krishna Gupta. Biomed J Sci & Tech Res
(pH 3) for achieving chromatographic separation. The Experimental Design Optimization method along with statistical analysis of data performed by Design-Expert 7.0 software, Full Version, using the Box-Behnken Design (BBD). The BBD has a advantage of optimization for experiments using 3k-factorial design (where, k=1,2,3…….) having a least three dependent variables or factors and more than one response as compared to other experimental designs such as Central Composite Design (CCD) and Fractional Factorial Design (FFD). The ratio of mobile phase (Acetonitrile:Methanol: Phosphate Buffer) composition from 25:25:50% v/v, Flow Rate between 0.81.2 mL/min and pH between 2.5-3.5 indicating three level was fed in the software and a total of 17 runs were obtained using the design.
Model Design Optimization
The significance of model so obtained was evaluated by two ways i.e. ANNOVA method and Good fit evaluation.
a) ANOVA: ANOVA is a statistical method based on F-test to estimate the significance of model. It involves subdividing total variation into variation due to Residual error, Main effects and Interactions.
Volume 4- Issue 4: 2018
Precision Precision was assessed by the measurement of Intraday precision (repeatability) through the assay of three different concentrations on besifloxacin (2.5-15μg/mL) at different time intervals in the same day and Interday precision by repetition for five days as per ICH Guidelines.
LOD and LOQ
The Limit of Detection (LOD) and Limit of Quantitation (LOQ) were determined from Slope (S) of the Linearity plot and Standard Deviation of the response to the blank sample by formula, 3.3 σ
Limit of Detection (LOD) = -----------S
10 σ
Limit of Quantitation (LOQ) =-----------S
Solution Stability
b) Main Effects (lack of fit): The Lack of Fit is one of the components of partition of the sum of squares in an ANOVA which can tell that proposed model is fit or not.
The solution stability study was carried out with sample besifloxacin HCl solution. The solution stability study was performed at Room temperature for 24h and in the refrigerator for 24h. After the specified period results were analyzed.
The developed HPLC Method was used for determination of Besifloxacin in Pharmaceutical Formulations. Marketed Formulations of Besifloxacin HCl Suspension 0.6%w/v strength was procured from local pharmacy were evaluated for the amount of Besifloxacin present in the formulation. 1mL of Besifloxacin HCl suspension equivalent to Besifloxacin 6 mg was transferred in 25 mL of volumetric flask, 15mL of methanol was added, sonicated for 10 min and volume made up to the mark with diluent. Transferred 1 mL of this solution into 10 mL of volumetric flask and volume made up to the mark with methanol. 2 mL portion of this solution was again further diluted to 10 mL with methanol to get final dilution of 4.8μg/mL. The representative chromatogram of sample was recorded. The Chromatograms were obtained for Besifloxacin in marketed formulation is represented in Figure 3.
The Suitability of Mobile Phase combination, Flow rate and pH was decided on the basis of Linearity, Assay, System Suitability, lesser time required for analysis (Retention Time), Peak Parameters and ease of preparation. Out of several tried combinations as suggested by BBD, the mobile Phase Composition of Acetonitrile:MethanolPhosphate Buffer (25:25:50% v/v), pH 3 and Flow Rate 1.0mL/min showed efficient chromatographic separation of (4.8μg/mL) and Retention time (Rt) at 4.3min.
Estimation of Besifloxacin in Pharmaceutical Dosage Form
Method Validation
The method was validated for
System Suitability
The System Suitability was assessed by six replicate analysis of 4.8μg/mL concentration of Besifloxacin.
Linearity
The Linearity of the method was determined by diluting the standard stock solution to 2.5-15μg/mL.
Accuracy
Accuracy of the method was determined from the recovery of besifloxacin through 4.8μg/mL solution spiked with 80, 100 and 120% extra quantity of Besifloxacin. Biomedical Journal of Scientific & Technical Research (BJSTR)
Results and Discussion
Experimental Design
A 32-factorial design using BBD was applied for observing the effect of Three independent factors such as Mobile Phase Composition (% v/v of ACN: Methanol) (X1), Flow Rate (mL/min) (X2) and pH (X3) on three responses such as Theoretical Plates (Y1), Tailing factor (Y2),Retention time (Y3), Capacity factor (Y4), Area (Y5) as parameters for calculation of proposed method. The Chromatographic conditions and Ranges fixed for selected factors are given in Table 1. The sum of total 17 runs were obtained for the fixed variables by selecting a three center repetitions which are generally carried out in order to know the experimental error variance and to test the predictive validity of the model. Each combination of Mobile Phase Composition, Flow Rate, and pH suggested by BBD were finally run on the system; observed for the responses such as theoretical plates, tailing factor, retention time, capacity factor and area are represented in Table 2. All Experiments were performed in randomized order to minimize the effects of uncontrolled factors that may introduce a bias on the response. Among the various models, the Quadratic model was suggested by the design with the maximum least square 3/9
Volume 4- Issue 4: 2018
Krishna Gupta. Biomed J Sci & Tech Res
regression for response Y1, response Y2, response Y3, response Y5 and linear model was suggested for response Y4 as compared to other models.The model was examined using Lack of Fit test, which indicated insignificant lack of fit value corresponding with higher p-value as compared to the model F-value. Furthermore, the model was validated by the application of Analysis of Variance (ANOVA)
to both the responses and variables to examine the significance of model which showed that both the responses achieved significant differences in their values. From Table 3 the Model F-value of 9.26 implies the model is significant.There is only a 0.39% chance that a “Model F-Value” this large could occur due to noise. Values of “Prob> F” less than 0.0500 indicate model terms are significant.
Table 1: Selection of Independent factors and their Levels. Factor A
Name MP
B
FlowRate
C
Units
Type
v/v
Numeric
pH
Numeric
mL/min.
pH
Low actual
High actual
Low coded
High coded
Mean
55
-1
1
50
3.5
-1
1
3
45
Numeric
0.8
1.2
2.5
Table 2: Box Behenken Design using factors and their responses.
-1
1
Std. Dev. 3.43
1
0.137 0.343
Std. Runs
Sr. No.
Blocks
Volume of org solvent
Ph
Flow Rate (mL/min)
Theoretical Plates
Tailing Factor
R.T.
Capacity factor
Area
6
1
Block 1
55
3
0.8
7396.43
2.147
3.788
0.87
716749
15
3
Block 1
50
3
1
10001.3
1.349
4.925
1.336
718758
17
2
8
4
12
5
11
6
5
7
2
8
16
9
7
10
14
12
13
11
9
13
4
14
1
15
10
16
3
17
Block 1 Block 1 Block 1 Block 1 Block 1 Block 1 Block 1 Block 1 Block 1 Block 1 Block 1 Block 1 Block 1 Block 1 Block 1
50
3
55
3
1.2
2.5
1.2
50
3.5
45
3
50
1
1.2 0.8
55
2.5
45
3
1.2
3
1
50
3
50
3
50 50
2.5
45
2.5
55
3.5
50
3.5
45
3.5
1 1 1
0.8 1 1
0.8 1
10001.3
1.349
7218.84
2.361
12611.3
1.825
6771.88
2.11
5494.11
2.378
10001.3
1.349
5132.88
2.279
7900.03
2.3
10001.3
1.349
5291.07
2.235
10001.3
1.349
8571.16
1.825
5870.49
2.248
14798.7
1.699
11167.9
1.49
Table 3: ANOVA results for response Y1 Theoretical plates.
4.925
1.336
2.799
1.037
3.238 4.368 5.155 3.159 4.925 4.258 4.925 4.925 5.073
1.501 0.968 1.909 0.982 1.336 1.926 1.336 1.336 1.56
3.194
0.696
4.961
1.479
6.025 5.311
2.553 2.072
718758 467194 456182 681588 617663 544377 718758 480484 718758 718758 660930 583157 586592 695440 591135 p-Value
Sr. No.
Source
Sum of Squares
Df
Mean Square
F values
1
Model Significant
1.09E+08
9
1.21E+07
9.26
0.0039
2
A-Mp org
5.58E+05
1
5.58E+05
0.43
0.534
3
B-pH
7.25E+07
1
7.25E+07
55.56
0.0001
4
C-flow rate
2.90E+05
1
2.90E+05
0.22
0.652
5
AB
8.64E+05
1
8.64E+05
0.66
0.4426
6
AC
1.67E+06
1
1.67E+06
1.28
0.2954
7
BC
3.36E+06
1
3.36E+06
2.58
0.1524
8
A2
2.83E+07
1
2.83E+07
21.66
0.0023
Prob>F
9
B2
3.19E+05
1
3.19E+05
0.24
0.6363
10
C2
7.01E+05
1
7.01E+05
0.54
0.4873
11
Residual
9.14E+06
7
1.31E+06
12
Lack of Fit
9.14E+06
3
3.05E+06
13
Pure Error
0
4
0
14
Cor Total
1.18E+08
16
Biomedical Journal of Scientific & Technical Research (BJSTR)
4/9
Krishna Gupta. Biomed J Sci & Tech Res
Volume 4- Issue 4: 2018
In this case B, A2 are significant model terms.From Table 4 the Model F-value of 37.17 implies the model is significant.There is only a 0.01% chance that a “Model F-Value” this large could occur due to noise. Values of “Prob> F” less than 0.0500 indicate model terms are significant.In this case B, A2, B2, C2 are significant model terms.Values greater than 0.1000 indicate the model terms are not significant.From Table 5, the Model F-value of 15.08 implies the model is significant. There is only a 0.09% chance that a “Model Table 4: ANOVA results for response Y2 Tailing factor.
F-Value” this large could occur due to noise. Values of “Prob> F” less than 0.0500 indicate model terms are significant.In this case A, C, A2, C2 are significant model terms.From Table 6, the Model F-value of 20.45 implies the model is significant. There is only a 0.01% chance that a “Model F-Value” this large could occur due to noise. Values of “Prob> F” less than 0.0500 indicate model terms aresignificant. In this case A are significant model terms. p-Value
Sr. No.
Source
Sum of Squares
Df
Mean Square
F values
1
Model significant
2.74
9
0.3
37.17
< 0.0001
0.52
1
0.52
63.11
< 0.0001
0.023
2.82
0.1368
2
A-Mp org
4.80E-03
4
C-flow rate
2.35E-03
6
AC
0.021
3
B-pH
5
AB
7
0.023
BC
8
A2
10
C2
9
0.016 0.93
1
4.80E-03
1
2.35E-03
1
0.021
1 1
0.016
1
0.59 0.29 2.6
1.92
117.1
< 0.0001
13
Pure Error
0
Sr. No.
Source
Sum of Squares
Df
Mean Square
F values
1
Model significant
12.75
9
1.42
15.08
3
B-pH
0.46
1
0.46
4.91
Lack of Fit
14
0.057
Cor Total
2.8
1
0.084
7
8.19E-03
4
0
3
A-Mp org
7.62
4
C-flow rate
6
AC
2.12E-03
8
A2
0.88
10
C2
5
2.33
AB
7
0.14
BC
9
11 12
0.26
B2
9.06E-03
Residual
0.66
0.92
Lack of Fit
13
0.66
Pure Error
14
0
Cor Total
13.41
Table 6: VA results for response Y4 Capacity factor. Sr. No.
Source
1
Model Significant
3
B-pH
2
16
1
0.0009
24.75
0.0016
1
2.12E-03
0.023
1
0.88
9.33
1 1
0.14 0.26
1
9.06E-03
7
0.094
4
0
1 3 16
3
3
0.012
1
Biomedical Journal of Scientific & Technical Research (BJSTR)
Prob>F
2.33
1
7.62
p-Value
< 0.0001
Df
2.97
0.0151
81.1
Sum of Squares
A-Mp org
10.24
0.019
Table 5: ANOVA results for response Y3 Retention time.
2
0.208
0.96
0.057
12
0.1506 < 0.0001
Residual
11
0.609
113.81
0.084
1
0.4688
0.93
B2
0.96
Prob>F
1
0.92
1.49
0.0623 0.2614 0.885
2.76
0.1408
0.096
0.7653
9.84
0.0185 0.0165
0.22
p-Value
Mean Square
F values
1
20.45
< 0.0001
0.012
0.25
0.6231
2.97
60.71
Prob>F < 0.0001
5/9
Volume 4- Issue 4: 2018
Krishna Gupta. Biomed J Sci & Tech Res 4 5 6 7 8
C-flow rate
0.019
Lack of Fit
0.64
Residual
Pure Error Cor Total
1
0.019
9
0.071
0.64
13
0
4
3.64
16
Values greater than 0.1000 indicate the model terms are not significant. From Tables 7 & 8, the Model F-value of 8.22 implies the model is significant. There is only a 0.56% chance that a “Model F-Value” this large could occur due to noise. Values of “Prob> F” less than 0.0500 indicate model terms are significant.In this case C, BC, A2, C2 are significant model terms. The model was evaluated for the effect of individual factors on the responses in the form of Counter
0.049
0.38
0.5479
0
plots indicating response surfaces of all five responses Y1, Y2, Y3, Y4 and Y5 showed in Figures 4-8 respectively. The counter plot indicates that the effects showed only on four responses i.e Response Y1 (Theoretical plates), Response Y2 (Tailing factor), Response Y3 (Retention time) and Response Y5 (Area) which showed the Quadratic response but response Y4 (Capacity factor) has no effect so it showed the Linear response.
Figure 4: Normal plot, counter plot and surface response plot for response Y1 Theoretical plates.
Figure 5: Normal plot, counter plot and surface response plot for response Y2 Tailing factor.
Figure 6: Normal plot, counter plot and surface response plot for response Y3 Retention time.
Biomedical Journal of Scientific & Technical Research (BJSTR)
6/9
Krishna Gupta. Biomed J Sci & Tech Res
Volume 4- Issue 4: 2018
Figure 7: Normal plot, counter plot and surface response plot for response Y4 Capacity factor.
Figure 8: Normal plot, counter plot and surface response plot for response Y5 Area. Table 7: ANOVA results for response Y5 Area. Sr. No.
Source
Sum of Squares
Df
Mean Square
1
Model significant
1.34E+11
9
1.49E+10
B-pH
2.72E+09
1
2.72E+09
2
A-Mp org
3 4
C-flow rate
6
AC
5
AB
7
BC
8
A2
9
B2
10
C2
11
Residual
12
Lack of Fit
13
Pure Error
14
Cor Total
1.58E+08
1
4.58E+10
1
2.93E+08
1
3.16E+09
1
1.69E+10
1
4.02E+10
1
8.42E+09
1
1.07E+10
1
1.27E+10
7
1.27E+10
3
0
4
1.47E+11
16
Table 8: Summary of Validation parameters. Sr. No.
Parameters
1
Linearity range (μg/mL)
3
Correlation coefficient
2 4 5 6 Biomedical Journal of Scientific & Technical Research (BJSTR)
0.0056
1.5
0.2603
0.087
4.58E+10
25.24
3.16E+09
1.74
1.69E+10
0.0015 0.6998 0.2287
9.31
22.16
1.07E+10
5.92
1.82E+09
0.7762
0.16
4.02E+10 8.42E+09
Prob>F
8.22
1.58E+08 2.93E+08
p-Value
F values
0.0186 0.0022
4.64
0.0682 0.0452
4.23E+09 0
Values 2.5-15
Regression equation
y=58177x
LOD (μg/mL)
0.0116
Accuracy (% recovery)
99.13-100.58% (0.69%)
LOQ (μg/mL)
0.999
0.2564
7/9
Volume 4- Issue 4: 2018
Krishna Gupta. Biomed J Sci & Tech Res 7
Precision (peak area % RSD)
9
Interday 5 RSD (n=6)
8
Intraday % RSD (n=6)
Note: LOD = Limit of detection; LOQ = Limit of quantifi cation; RSD = Relative standard deviation
0.68%
0.70 % 0.90%
Assay
Acknowledgment
The absence of additional peaks in the chromatogram indicated no interfearence of the formulation excipient used in the Suspension. The developed method showed good chromatographic separations with a mean percentage recovery of 99.13-100.58%.
The authors are thankful to Glenmark Pharmaceuticals, (Mumbai, India) for providing Besifloxacin HCl gift samples for this work. We are also thankful to the Principal, S.K.B College of pharmacy, Kamptee for providing necessary help for carrying out the work.
The data obtained was plotted as peak area against concentration, which showed that the coefficient of correlation (r2) value of 0.999.
1. Hovding G (2008) Acute bacterial conjunctivitis. Acta Opthalmol 86: 5-17.
Linearity
System Suitability Study
RSD (%) was determined for peak area was found to be 0.68%.
Accuracy
The method showed the percentage recovery was between 99.13-100.58% and RSD value was 0.69% respectively.
Precision
The method showed good precision and RSD (%) for repeatability and intermediate precision was 0.70 and 0.90% respectively, which were within the NMT 2% limit.
DL and QL
The DL and QL values were found to be 0.0116 and 0.2564 μg/ mL indicated the higher sensitivity of the developed method.
Solution Stability
The results of solution stability study after 24h, %RSD was found to be 0.82.
Forced Degradation Studies
Peak purity test results confirmed that the Besifloxacin HCl peak is homogeneous and is pure in all the forced degradation study samples. Thus proposed HPLC method is specific for Besifloxacin HCl.
Conclusion
A robust method for Besifloxacin HCl was developed using a Quality by Design approach. QbD method development software in conjunction with RP-HPLC system automation allows for rapid screening and optimization across a wide range of mobile phases and pH ranges and flow rates while evaluating the effects on factors such as theoretical plates, Tailing factor, retention time, capacity factor and Area on the separation.
Biomedical Journal of Scientific & Technical Research (BJSTR)
References
2. Tarabishy AB, Jeng BH (2008) Bacterial conjunctivitis: A review for internists. Cleve Clin J Med75: 507-512. 3. Chung CW, Cohen Ej (2000) Eye Disorders: Bacterial conjunctivitis. West J Med 173: 202-205. 4. Sheikh A, Hurwitz B (2006) Antibiotics versus placebo for acute bacterial conjunctivitis. Cochrane Database Syst Rev (2): CD001211.
5. Rose PW, Harden A (2005) Chloramphenicol treatment for acute infective Conjunctivitis in children in primary care: A randomized double blind placebo - Controlled Trial. Lancet 366: 37-43.
6. (2009)Dermatologic and Ophthalmic Drugs advisory committee meeting briefing document. Besifloxacin 0.6% w/v ophthalmic suspension for the treatment of Bacterial Conjunctivitis. 7. (2009) US Deptof Health and Human Services. NDA 22-308. NDA approval.
8. Tepedino ME, Heller WH, Usner DW (2009) Phase III Efficacy and safety study of besifloxacin ophthalmic suspension 0.6% in the treatment of Bacterial Conjunctivitis. Curr Med Res Opin25: 1159-1169. 9. Besivance (package inserts) (2009) Tampa, Fla: Bausch and Lomb Incorporated.
10. Zhang JZ, Ward KW (2008) Besifloxacin a Novel Fluoroquinolone antimicrobial agent, exhibits potent inhibition of pro-inflammatory cytokinines in Human THP-1 Monocytes. JAntimicrob Chemother 61: 111-116. 11. Ward KW(2007)Non-clinical pharmodynamics, pharmacokinetic, safety of BOL- 303224-A, and a novel fluoroquinolone antimicrobial agent for topical ophthalmic use. J Oculpharmacol Ther 23: 243-256. 12. Bausch Lomb (2009) Product monograph-besifloxacin ophthalmic suspension, 0.6% w/v 123400: 1-27. 13. Marcia CNC, Amanda TB, Juliana MMA Talanta Elsevier, Science Direct, 119: pp. 367-374.
14. Jain P, Kar M, Jain DK (2015) International Journal of Pharmaceutical Sciences Letters 5(3): 579-580. 15. Singh CL, Singh A, Santosh BM (2015) World Journal of Pharmaceutical Research 4(15): 2057-2067.
8/9
Krishna Gupta. Biomed J Sci & Tech Res This work is licensed under Creative Commons Attribution 4.0 License
Submission Link: https://biomedres.us/submit-manuscript.php
Volume 4- Issue 4: 2018
Assets of Publishing with us • Global archiving of articles
• Immediate, unrestricted online access • Rigorous Peer Review Process • Authors Retain Copyrights • Unique DOI for all articles
https://biomedres.us/
Biomedical Journal of Scientific & Technical Research (BJSTR)
9/9