as Android phones and iPhones, are becoming increasingly ... rent mobile phone market (i.e., Android OS mostly captured ...... Interfaces 4(1), 3-10, 2010.
Design of Touch Dynamics based User Authentication with an Adaptive Mechanism on Mobile Phones Yuxin Meng, Duncan S. Wong and Lam-For Kwok Department of Computer Science City University of Hong Kong, Hong Kong SAR, China
{yuxin.meng, duncan, cslfkwok}@cityu.edu.hk ABSTRACT Behavioral-biometric based authentication schemes on mobile phones usually begin by establishing a normal-behavioral model using machine learning classifiers and then identify behavioral anomalies through comparing current behavioral events with the established model. If an anomaly is detected, this kind of schemes will require the user for validation (i.e., input correct PIN). In this paper, we first propose a lightweight touch-dynamics-based user authentication scheme on a touchscreen mobile phone, which consists of only 8 touch-gesture related features. In addition, we further design an adaptive mechanism that can periodically select a better classifier to maintain the authentication accuracy during user authentication. As a study, we implement a cost-based metric that enables this mechanism to choose a less costly classifier. In the evaluation, the experimental results of involving 50 participants indicate that our proposed user authentication scheme can achieve an average error rate of 2.46% and that the adaptive mechanism can maintain the authentication accuracy at a relatively stable level.
Categories and Subject Descriptors D.4.6 [Operating Systems]: Security and Protection—Access controls, Authentication; H.5.2 [Information Interfaces and Presentation]: User Interfaces—Input devices and strategies
General Terms Security, Design, Algorithms
Keywords Behavioral Biometrics, Touch Dynamics, User Authentication, Access Control, Mobile Security and Usability
1.
INTRODUCTION
Mobile phones, especially touchscreen mobile phones such as Android phones and iPhones, are becoming increasingly
Permission to make digital or hard copies of all or part of this work for personal or classroom use is granted without fee provided that copies are not made or distributed for profit or commercial advantage and that copies bear this notice and the full citation on the first page. To copy otherwise, to republish, to post on servers or to redistribute to lists, requires prior specific permission and/or a fee. SAC’14 March 24-28, 2014, Gyeongju, Korea. Copyright 2014 ACM 978-1-4503-2469-4/14/03 ...$15.00.
common in our daily lives. The Android OS and the iPhone iOS have shared a nearly combined 87.8 percent in the current mobile phone market (i.e., Android OS mostly captured 69 global mobile phone market share in 2012) [11]. With the popularity of touchscreen mobile phones, more and more users are likely to use them as frequent storage medium for sensitive information (e.g., passwords, trade secrets, credentials, photos) [3, 9] and to use them for security sensitive tasks (i.e., authorizing commercial transactions [25]). In this case, mobile phones have become an attractive target for hackers and malware [14, 23]. For example, an attacker can easily reverse engineer and manipulate any application from the mobile market, and then utilize these plagiarized applications to gain personal profile [20]. In addition, mobile phones are easily lost or stolen [24]. The stored personal and sensitive information in these lost or stolen mobile phones can be exploited for malicious use by others [18]. Therefore, in order to enhance mobile security and protect users’ data, it is very crucial to develop a powerful user authentication scheme for mobile phones. Behavioral-biometric based authentication uses measurements from human actions such as keystroke dynamics [1] and mouse dynamics [21] for authenticating users. Such schemes are continuous authentications [3] which can mitigate the issue of one-time authentication by continuously verifying whether a user is legitimate or not. In addition, the implementation of the behavioral-biometric based authentication usually does not need additional hardware. Both keystroke dynamics and mouse dynamics were studied in a desktop, but only keystroke dynamics has been investigated on mobile phones [2, 27]. As touchscreen mobile devices are rapidly becoming a key computing platform (i.e., 800 million mobile phones are expected to be touch-enabled by 2014 [13]) and more research works recently focus on this field such as FAST [3] and Touchalytics [5], we believe that developing user authentication schemes based on touch dynamics is becoming more and more important on touchscreen mobile phones. Contributions. In this paper, we propose a lightweight touch-dynamics-based user authentication scheme with less workload in data processing, which consists of only 8 touchgesture related features, and we further design an adaptive mechanism that selects a better classifier to authenticate users. The major contributions of our work can be summarized as follows: • We propose a new and lightweight touch-dynamicsbased user authentication scheme which is composed of 8 touch-gesture related features such as the number
of touch movements/single-touch/multi-touch per ses2.1 Lightweight Touch-Dynamics-based Authension, the average time duration of touch movements/singletication Scheme touch/multi-touch per session, average speed of touch To reduce the workload of processing touch-gesture removement and touch pressure. lated data, we propose a lightweight touch-dynamics-based authentication scheme that consists of only 8 touch-gesture • To maintain the accuracy of classifiers in authenticatrelated features as follows. ing users, we further design an adaptive mechanism that enables to adaptively select a better classifier by 1. The number of touch movements per session (denoted measuring their performance with appropriate metrics. NTM) In this work, we conduct a study of measuring classifiers by means of a cost-based metric which can select 2. The number of single-touch events per session (denoted the least costly classifier. NST) • To investigate the performance of our proposed authentication scheme and the adaptive mechanism, we conducted an experiment with a total of 50 users on Android phones. The study results indicate that our proposed authentication scheme can achieve an average error rate of approximately 2.46%1 , and that the adaptive mechanism can maintain the authentication accuracy at a relatively high and stable level. The rest of the paper is organized as follows. We describe our proposed touch-dynamics-based authentication scheme and the cost-based adaptive mechanism in Section 2. Section 3 illustrates the implementation in detail. We then evaluate our proposed authentication scheme and the adaptive mechanism in Section 4. We discuss the limitations in Section 5 and describe related work in Section 6. Finally, we conclude our work with future directions in Section 7.
2.
OUR PROPOSED METHOD
In this section, we first propose a lightweight and efficient touch-dynamics-based authentication scheme, which consists of 8 touch-gesture related features. The purpose of proposing such a lightweight scheme is for reducing the time consumption in data processing. For example, when compared with our previous work [16] which used 21 features, our current scheme greatly reduces the number of nested loops for generating one so-called authentication signature from the collected features from 37 (or more) down to only 8. This greatly reduces the processing time and makes the entire authentication scheme lightweight. In practice, it is a challenging task to select an appropriate machine learning classifier in authenticating users since the performance of a particular classifier may be fluctuant varied with the used datasets [12]. We therefore design an adaptive mechanism that can select an appropriate machine learning classifier in an adaptive way. The main purpose of this mechanism is to maintain the authentication accuracy by selecting a better classifier. As a study, we implement this mechanism using a costbased metric. The merits of this mechanism are: 1) adaptively selecting a less costly classifier which can reduce the information loss during the establishment of normal-behavior models (where the smaller the cost-based metric, the less information loss during the establishment); and 2) maintaining the authentication accuracy at a relatively high and stable level since the most accurate classifier (with the least cost-based metric) could be used in the authentication. The relationship between the accuracy and the cost will be illustrated in Section 4.3.2. 1 In this work, error rate is the average of false acceptance rate and false rejection rate.
3. The number of multi-touch events per session (denoted NMT) 4. The average time duration of touch movements per session (denoted ATTM) 5. The average time duration of single-touch per session (denoted ATST) 6. The average time duration of multi-touch per session (denoted ATMT) 7. Average speed of touch movement (denoted ASTM) 8. Average touch pressure (denoted ATP) The reason of adopting the features like the number of touch movements/single-touch/multi-touch per session and the average time duration of touch movements/single-touch/ multi-touch per session is that these features are relatively easier to compute with less workload regarding time consumption compared to speed calculation (we give an analysis later). In addition, it has been shown in [16] that these features are good in characterizing the touch behavior of a user, and hence potentially can provide a sufficient and effective differentiation among users. According to [16], it is noticed that the calculation of gesture speed (i.e., calculating the speed of a touch gesture for a direction) is more time consuming when compared with that for gesture frequency counting or time duration computation, since more nested loops are required. In this work, we therefore implement a more compact speed-related feature, named average speed of touch movement (denoted ASTM), which only requires one nested loop in the computation. This feature can be computed as below: √ Pn AST M =
i=2
(Xn −Xn−1 )2 +(Yn −Yn−1 )2 Sn −Sn−1
n
(n ∈ N ) (1)
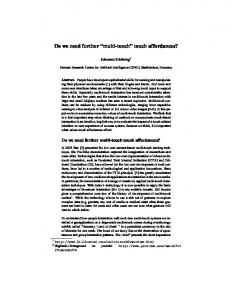
where (Xn , Yn ) and (Xn−1 , Yn−1 ) are two points in a touch movement, Sn and Sn−1 are the corresponding event system time for these two points and n is the number of recorded points during a touch movement. In Fig. 1, we show the average speed of touch movement (ASTM ) for 8 users. It is noticeable that different users have different average speed in performing the touch movement so that we can use this feature to characterize and hence distinguish different users. Additionally, we further employ a feature of average touch pressure (denoted ATP) in our lightweight user authentication scheme, which measures the pressure on average when a touch event on the touchscreen.
A v e r a g e S p e e d o f T o u c h M o v e m e n t ( p ix /s )
1 6 0
Table 1: A brief comparison between our scheme and [16]. Comparison Our Scheme Scheme in [16] # of features 8 21 Data processing 8 nested loops > 37 nested loops for one AutSig
1 4 0 1 2 0 1 0 0 8 0 6 0 4 0 2 0
0 .2 5
rections are to be calculated. One nested loop is consumed for calculating the directions and another nested loop is required for calculating averaged values, and hence each of these 16 features already requires 2 nested loops. Plus another 5 features, at least 37 nested loops are needed during the feature computation. We give a brief comparison between our scheme and [16] in Table 1. The table shows that our scheme can greatly reduce the time consumption in data processing.
0 .2 0
2.2
0 U s e r1
U s e r2
U s e r3
U s e r4
U s e r5
U s e r6
U s e r7
U s e r8
U s e r
A v e ra g e T o u c h P re s s u re (A T P )
Figure 1: The average speed of touch movement (ASTM) for 8 users.
0 .1 5
0 .1 0
0 .0 5
0 .0 0 U s e r1
U s e r2
U s e r3
U s e r4
U s e r5
U s e r6
U s e r7
U s e r8
U s e r
Figure 2: The average touch pressure (ATM) for 8 users. The feature of touch pressure has been studied on a mobile phone [22] and showed positive results of authenticating users. Note that in real-world applications, the quality of this feature is depending on the sensors in mobile phones. But with the increased capability of mobile phones, current sensors are able for providing such feature [7, 22]. In Fig. 2, we show the average touch pressure (ATP ) for 8 different users. It is noticeable that different users have different values of ATP, so that it can be used to characterize the touch behavior of a user. Therefore, an authentication signature (AutSig) of our proposed user authentication is composed of the 8 features above and can be represented as follows. AutSig = {NTM, NST, NMT, ATTM, ATST, ATMT, ASTM, ATP} Discussions on time consumption. Generally, for a user authentication scheme, time consumption of data processing mainly depends on the number of touch gestures and relevant defined features. If given a session record, the number of touch gestures can be determined. In this work, our scheme consists of 8 touch-gesture related features and each feature can be easily computed using operations of counting and one nested loop. With the same set of data as used in [16], our scheme proposed above in this paper only requires 8 nested loops to finish processing the data set while the method proposed in [16] requires at least 37 nested loops to finish processing the data set. The scheme in [16] takes 21 touch-gesture related features rather than 8. Also in 16 out of these 21 features, touch di-
Cost-based Measurement
The designed adaptive mechanism is used to select a better classifier in an adaptive way. In this work, as a study, we tune and implement a cost-based metric (called relative expected cost) in the process of classifier selection, based on our work [15]. This metric enables to measure the performance of different classifiers from the view of cost. Next, we provide some definitions related to the costbased measurement based on those given in [6] and [15]. Definition1. A Cost Ratio (C) is calculated as C = Cβ /Cα , where Cα represents the cost of identifying an imposter as a legitimate user and Cβ represents the cost of identifying a legitimate user as an imposter. Definition2. A cost-based decision tree can be built that is similar to [6]. The probability of P 1 means the probability that the detector reports a legitimate user, P 2 means the conditional probability of legitimate user given that the detector identifies as a legitimate user, P 3 means the conditional probability of legitimate user given that the detector identifies as an imposter. By applying Bayes’ Theorem, P 1, P 2 and P 3 can be calculated as below: P1 = (1 − α)(1 − P ) + βP
(2)
P2 = (1 − α)(1 − P )/[(1 − α)(1 − P ) + βP ]
(3)
P3 = α(1 − P )/[α(1 − P ) + (1 − β)P ]
(4)
where α represents false positive rate (FP, P (I|L)), β represents false negative rate (FN, P (L|I)) and P represents the prior probability of detecting an imposter. Note that α and β are two parameters of a classifier. Definition3. The Initial Expected Cost (Ciec ) is defined as the sum of the products of the probabilities of the detector’s outputs and the expected costs conditional on the outputs, which can be calculated as Ciec = min{CβP, (1 − α)(1 − P )} + min{C(1 − β)P, α(1 − P )}, based on [6]. Based on [8], we notice that the Ciec suffered from some limitations in real scenarios. For instance, it has nothing to α , (1 − α) ≈ (1 − P ) ≈ 1. To do with α and β if CP < 1−β solve the issue, similar to [15], we therefore tune a measure
Table 2: A sample of raw data collected from touchscreen inputs which is corresponding to Fig. 3 (b). Input Type X-Coordinate Y-Coordinate Timing Pressure Press Down 122.71380 588.37286 1090828 0.090196080 Press Move 126.11902 581.70825 0.101960786 Press Move 133.05556 568.37897 0.125686300 Press Move 143.64955 552.66050 0.125686300 Press Move 157.64876 530.02600 0.125462100 Press Up 159.54180 527.91720 109212 0.125462100 of relative expected cost as follows. Definition4. The Relative Expected Cost (Crec ) is defined as a relative sum tuned from the Initial Expected Cost, which can be calculated as follows. Crec = CβP + α(1 − P )
(5)
Thus, we can use the Relative Expected Cost (Crec ) to evaluate the performance of different machine learning classifiers in detecting behavioral anomalies and to determine the most appropriate classifier. When we obtain the training dataset, the values of α, β and P can be computed in advance. Generally, a desirable (better) classifier should have a low (er) relative expected cost, which means relatively less information loss during the establishment of normal-behavior model. More details about the derivation of P 1, P 2, P 3 can refer to work [6] and [15].
3.
IMPLEMENTATION
In this section, we introduce the implementation of the proposed touch-dynamics-based user authentication scheme such as data collection and session identification.
3.1
Data Collection
To implement the touch-dynamics-based user authentication scheme, we used a Google/HTC Nexus One Android phone2 with a multi-touch capacitive touchscreen (resolution 480 × 800 px) to collect and process data. The major advantage of using this particular phone is that its stock Android OS can be replaced with a self-modified customized-Android-OS version. Specifically, we updated the phone with a modified Android OS version 2.2 based on CyanogenMod.3 The modification consists of changes to the application framework layer to record raw input data from the touchscreen, such as the timing of touch inputs, the coordinates x and y, the types of the input (e.g., press down, press up) and the touch pressure. In addition, we installed a separate application that enables us to easily extract the recorded data from the phone.4 The interface of the CyanogenMod Android OS can refer to Fig. 3 (a). In Fig. 3 (b), we show an instance (called Instance1 ) of raw data collection and highlight the important items with red boxes. For example, the first red box shows that an action of press down is detected and its corresponding timing (system-time) is ‘1090828’. Note that this timing 2 The CPU of this particular phone is 1GHz while the storage memory is 512M. 3 http://www.cyanogenmod.com/ 4 A Beta version of our customized-Android OS can be downloaded from Sourceforge: https://sourceforge. net/projects/touchdynamicsauthentication/files/ Android_OS/.
(a)
(b)
(c)
Figure 3: The implementation of the touchdynamics-based authentication scheme: (a) Interface: CyanogenMod Android OS; (b) Instance1: raw data collection; (c) Instance2: raw data collection. is relative to the last start-up of the Android phone, therefore, the duration of each touch input can then be computed by taking the difference in system-time. Then, from the following red boxes, the coordinates x (i.e., x =122.7138) and y (i.e., y=588.37286) are also recorded. The last red box presents the touch pressure (i.e., pressure=0.09019608).5 The records in Fig. 3 (b) show that there are a series of touch-press events following the touch press down, so that we can know that this is a touch movement. For the touch pressure, our application can capture slight changes even within a touch movement. For instance, Fig. 3 (b) shows that the touch pressure changes from ‘0.09019608’ to ‘0.101960786’, and from ‘0.101960786’ to ‘0.1256863’. In Fig. 3 (c), we show another instance (called Instance2 ) of touch movement by another user. It is visible that the values of touch pressure are different varying with different users. One sample of collected raw data corresponding to Fig. 3 (b) is presented in Table 2. The data collection in Fig. 3 also shows that no special hardware is required for our proposed scheme, the information can be collected by updating certain parts of the Android application framework.
3.2
Session Identification
During the authentication, the user authentication scheme has to extract an authentication signature for each session and compare different extracted authentication signatures 5
During the implementation, we used two log commands such as Slog.v and Slog.i to output the recorded data. Therefore in the log application, we can obtain two log items with different log titles (i.e., ‘V/Action Inputdevice’ and ‘I/InputDevice’) but they present the same information. We only use these two log commands to examine the application. In the data analysis, we only treat them as one.
across sessions. The scheme then can determine whether the current user is a legitimate user or not. Thus, session identification is a critical factor for an authentication scheme. Different from [16] where a 10-minute session (called timebased session) was used, in this work we define an eventbased session that includes a total of 120 touch gestures in each session. The main reason is that the number of touch gestures may be varied if using the time-based session (i.e., the number of collected touch gestures may be quite small in some sessions) while the number of touch gestures can be secured if using the event-based session. In this case, the use of event-based session is expected to improve the effectiveness of authentication through providing enough gesture data for analysis. Therefore, the beginning and the end of a session in this work can be determined as follows: • A session ends if the number of touch gestures of the current session has reached or exceeded 120. • A new session starts when a touch input is recorded and the last session has ended. The session start and session end events can be easily determined by analyzing the number of touch gestures in the raw data log.
4.
EVALUATION
In this section, we describe our experimental methodology, introduce the employed metrics of evaluating our proposed touch-dynamics-based authentication scheme and present the experimental results.
4.1
Methodology
In the study, we involved 50 Android phone users (24 female and 26 male) to participate in our experiments and among the participants, 80 percent of them were students while the others are senior citizens, engineers and businessmen. All the participants were regular mobile phone users and ranged in age from 16 to 55 years. In the data collection, we provided all the participants with an Android phone (Google/HTC Nexus One) equipped with our modified Android OS. Therefore, all participants used the same phone to ensure that all data was collected under the same settings. Before starting the collection, we described our objective to all participants and showed what kind of data would be collected. We further asked participants to use the Android phones the same way they would use their own phones in their normal lives, such as browsing websites, accessing files and operating on any applications. In particular, participants could do actual data collection outside of the lab, allowing them to get familiar with the phone first. They could also decide when to start the collection process (allowing them enough time to get familiar). All participants are required to finish 25 sessions within 3 days when they are using the phone. We thus collected raw data for altogether 1250 sessions of 120 touch events each, with an average of 25 sessions per user. All the features were then analyzed and extracted from the collected raw data.
4.2
Evaluation Metrics
In this work, we utilize the following two metrics to measure the authentication accuracy of our proposed touchdynamics-based authentication scheme:
• False Acceptance Rate (FAR): indicates the probability that an impostor is classified as a legitimate user. • False Rejection Rate (FRR): indicates the probability that a legitimate user is classified as an impostor. Ideally, an authentication accuracy of 100 percent is desirable while it is not realistic. In practice, a trade-off is usually made between the false acceptance rate (security) and the false rejection rate (usability). Generally, a false rejection is less costly than a false acceptance, since a higher false acceptance rate can lower the security level of the authentication system, whereas a higher false rejection rate can frustrate a legitimate user, which is still unfortunate but arguably less problematic than a lower security level. In terms of security and usability, both lower FAR and FRR are desirable.
4.3
Evaluation Results
In this evaluation, we mainly conducted two experiments. The first one is to evaluate the performance of our proposed authentication scheme, and the second one is to evaluate the performance of the adaptive mechanism.
4.3.1
Experiment1.
In this experiment, we selected 4 classifiers, such as Decision Tree (J48 ), Naive Bayes (NBayes), Radial Basis Function Network (RBFN ) and Back Propagation Neural Network (BPNN ), from the WEKA platform [26], which provides a set of machine learning classifiers, and we additionally selected another classifier of PSO-RBFN from [16]. We test each classifier with the collected data (e.g., authentication signatures) and get the FAR and FRR for each user. In particular, we used 17 sessions’ data (68% of the total sessions) in the training phase and the remaining for testing. The results of the FAR, FRR, average error rate (AER) and standard deviation (SD) are shown in Table 3. This table shows that in this experiment, the classifier of PSO-RBFN can achieve the best performance with an average error rate of 2.46% (where FAR=2.55%, FRR=2.37%). The reason is that PSO-RBFN can better deal with variations in a user’s touch behavior compared to other selected classifiers in this experiment. In addition, compared to the results obtained in [16], we find that all classifiers shown in Table 3 are performed better when using our proposed new scheme than using the scheme in [16]. For example, the AER of PSO-RBFN is improved from 2.92% to 2.46%, while for RBFN and BPNN, their AER is improved from 7.71% to 5.16%, and from 11.58% to 7.01% respectively. These results illustrate that our proposed touch-dynamics-based authentication scheme in this work is more effective (and even more efficient) in authenticating a user than the scheme in [16].
4.3.2
Experiment2.
To evaluate the adaptive mechanism, we used three classifiers of J48, IBK (KNN) and NBayes as a case study in this experiment. Note that the selection of these three classifiers is only to verify the adaptive property of the designed mechanism. The cost ratio C is set to 10.6 More details of the parameter settings and algorithm selection can refer to [15]. The results of classifier selection with cost values (relative expected cost) are presented in Table 4. 6 The cost ratio can be tuned according to different experiment settings.
Table 3: Evaluation results in Experiment1. Measure J48 NBayes RBFN BPNN PSO-RBFN FAR (%) 18.48 17.87 5.48 6.81 2.55 FRR (%) 17.78 15.81 4.83 7.21 2.37 Avg. err. rate 18.13 16.84 5.16 7.01 2.46 SD in FAR 15.34 11.15 4.53 5.02 0.98 SD in FRR 16.82 9.13 3.45 5.75 1.03
A v e r a g e E r r o r R a te o f A ll U s e r s
UserID User1 User2 User3 User4 User5 User6 User7 User8
Table 4: The results of classifier selection with cost values. 10 sessions 15 sessions 20 sessions 25 sessions J48 (1.3175) J48 (1.2029) IBK (1.2110) IBK (1.2018) IBK (1.2521) NBayes (1.3562) NBayes (1.2872) IBK (1.2039) IBK (1.2452) J48 (1.3451) J48 (1.3344) NBayes (1.4576) J48 (1.4476) NBayes (1.5466) J48 (1.3476) J48 (1.2231) J48 (1.4142) IBK (1.3320) IBK (1.3765) J48 (1.3028) NBayes (1.3262) NBayes (1.2281) NBayes (1.2081) IBK (1.2116) J48 (1.3112) NBayes (1.2341) NBayes (1.1734) NBayes (1.2123) NBayes (1.2843) NBayes (1.2672) NBayes (1.2590) NBayes (1.2143)
2 2 .0 2 1 .5 2 1 .0 2 0 .5 2 0 .0 1 9 .5 1 9 .0 1 8 .5 1 8 .0 1 7 .5 1 7 .0 1 6 .5 1 6 .0 1 5 .5 1 5 .0 1 4 .5 1 4 .0 1 3 .5 1 3 .0 1 2 .5 1 2 .0
T h e A d a p tiv e M e c h a n is m J 4 8 N B a y e s IB K
1 0 S e s s io n s
1 5 S e s s io n s
2 0 S e s s io n s
2 5 S e s s io n s
U p d a tin g
Figure 4: The performance comparison between the adaptive mechanism and other single classifiers.
In particular, we gradually increased the number of sessions in the process of classifier selection. We first used 10 sessions (where 5 sessions were used for training), we then continued to add 5 sessions (where the previous sessions were used for training) each time. Table 4 presents that for different users, the selected classifier may be different for each update. Take User1 as an example, according to the relative expected cost, J48 classifier is selected in the first and second time with the cost value of 1.3175 and 1.2029 respectively, while IBK classifier is selected in the third and fourth time with the cost value of 1.211 and 1.2018 respectively. Through analyzing the collected data, we find that the adaptive mechanism can choose and output a classifier which achieves the smallest relative expected cost. In [15], it is found that a smaller relative expected cost means less information loss during the establishment of classifier model, thus, a higher accuracy could be achieve. In this work, we also find that a classifier with the smallest relative expected cost can achieve the best classification accuracy. These results indicate that the designed mechanism can select a better classifier in an adaptive way. In addition, we compare the adaptive mechanism with the performance of only using the J48, NBayes and IBK respectively in Fig. 4. The average error rates are computed by using the sessions from all the 50 users. It is visible that for
each updating slots, the adaptive mechanism can achieve a better average error rate since it can select the best algorithm (from the pool) to authenticate users. Whereas for other classifiers, their performance is not stable. Take the classifier of NBayes as an example, we identify that its performance is fluctuant during the experiment. Therefore, these results indicate that the adaptive mechanism can maintain the authentication accuracy at a stable level (i.e., the authentication accuracy is at least the same as the best classifier in the pool).7 Workload of Adaptive Mechanism. During this experiment, we also evaluated the workload of the adaptive mechanism using the tool CPU-Z,8 which is a free application providing major CPU information about a device such as CPU load, CPU architecture, cores, clock speed, etc. Considering the adaptive mechanism with the above three classifiers, we find that the CPU workload was increased by a range from 2% to 4% in the experiment. Since the adaptive mechanism can maintain the authentication accuracy at a relatively high and stable level, we consider that the increased workload is acceptable and it is worth implementing this mechanism on a mobile device. Further Discussion. The developed touch dynamicsbased user authentication scheme is not intended to replace the existing authentication methods such as PINs, but attempts to complement previously developed authentication schemes on mobile phones and provide other means to authenticate a mobile phone user [5]. For instance, by working with a PIN-based authentication, both false acceptance rate and false rejection rate of such behavioral-biometric based user authentication schemes can be further decreased in realworld applications (e.g., FAR is less than 2% and FRR is close to zero) [27].
5.
LIMITATIONS AND POTENTIAL COUNTERMEASURES
7 The ‘stable’ here means that the adaptive mechanism can achieve relatively good performance than the other classifiers in the classifier pool. 8 https://play.google.com/store/apps/details?id= com.cpuid.cpu_z.
In this section, we discuss some open problems of our work and propose some potential countermeasures. Users Behavioral Habit. To authenticate a user using the behavioral-biometric based authentication schemes, a big problem is that the authentication accuracy may be decreased if the user performs very different from his/her daily inputs. This is a major limitation and an open problem for the behavioral-biometric based authentication. To mitigate this problem, we can employ or combine other authentication mechanisms (e.g., password-based authentication) to improve the security. For example, if the current authentication is failed, a user is required to input a PIN. In [27], this combined approaches have proven to be helpful and promising in real-world applications. Workload of Adaptive Mechanism. By using the adaptive mechanism, some additional workload may be added to the mobile phones. But this mechanism can indeed provide some benefits like maintaining the authentication accuracy at a high and stable level, which increases not only security but also usability with lower FAR and FRR. A possible solution to reduce the workload is that the phases of classifier training and algorithm selection are only performed when the phone is not frequently used (i.e., at night). To meet different requirements, it is better for users to set the updating time and frequency. In this work, we investigate the workload of adaptive mechanism and present positive results. Certainly, larger experiments should be conducted to further explore this issue. We leave it as one of our future work. Involved Users. For the behavioral-biometric based authentication schemes, involved users are a very important factor to affect the performance results of the scheme (i.e., the generated datasets are different). To mitigate this issue, conducting a larger user study with even more users is always desirable. In this work, we involved 50 users in the evaluation. We plan to conduct an even larger study in our following work to validate the results.
6.
RELATED WORK
With the increased popularity of touchscreen mobile devices, more research work has been conducted on this platform and focused on touch dynamics recently. For example, Numabe et al. [19], presented a finger identification approach on touch panels. They identified that when tapping a touch panel, the exact coordinates of a tap were depending on the used fingers. That is, different fingers could generate slightly different coordinates. They called this phenomenon tapping fluctuation and mainly used it to make touch input more versatile, by varying the function executed depending on which finger was used to tap the touchscreen. Then, Kim et al. [10] exploited the use of multi-touch to inhibit shoulder surfing, with the purpose of enhancing PIN input (e.g., at an ATM-Automated Teller Machine). In particular, for their schemes, a user begins by placing three fingers of each hand on the interface. The system uses the locations of these touch points to dynamically draw the grid of objects, and records pressure zones that are assigned to each finger. Fiorella et al. [4] provided a preliminary study about multi-touch input (e.g., rotation, translation, and scaling) for 3D object manipulation on mobile devices. Their statistic analysis of 27 users on an iPod-touch device
showed that their proposed multi-touch user interface could outperform the traditional button GUI. Fen et al. [3] recently designed a multi-touch gesture based mobile authentication scheme (called FAST), which could support both passive and continuous authentication for mobile users based on user’s touch gestures. Their experimental results showed that the FAST could achieve a FAR of 4.66% and a FRR of 0.13%. But the FAST relies on a digital sensor glove that they built to collect the additional gesture information. Later, Frank et al. [5] investigated whether a classifier could continuously authenticate users based on the way they interact with the touchscreen of a smart phone. By extracting 30 behavioral touch features, their classifier achieved a median equal error rate of below 4% when the authentication test was carried out one week after the enrollment phase. Based on the findings, they pointed out that their method could be implemented as a means to extend screen-lock time or as a part of a multimodal biometric authentication system. In our previous work [16], we proposed a touch gestures-based user authentication scheme on touchscreen mobile phones which consisted of 21 touch-gesture related features. The experimental results with 20 Android users show that the average error rate is about 3% by means of a classifier of PSO-RBFN. In this work, we propose a lightweight and efficient touch dynamics-based authentication scheme that consists of only 8 features to reduce time consumption of data processing, and we further design an adaptive mechanism aiming to maintain the authentication accuracy. In addition, this work employs an event-based session instead of a time-based session in [16]. These characteristics make our current work different from our previous one. The experimental results positively show that our proposed authentication scheme can achieve an average error rate of 2.46% (where FAR=2.55%, FRR=2.37%), which is lower than that in [16].
7.
CONCLUDING REMARKS
With the advent of touchscreen mobile phones, it is becoming more and more important to develop user authentication schemes based on touch dynamics. In this paper, we propose a new, lightweight and efficient touch-dynamics-based authentication scheme, which is composed of only 8 touch-gesture related features, to authenticate a user on mobile phones. In addition, we further design an adaptive mechanism to select a better classifier in authenticating users with the purpose of maintaining the authentication accuracy. As a study, we implement a costbased metric in the adaptive mechanism that enables to select the least costly classifier for authentication while we also show that a less costly classifier can achieve a better classification accuracy by reducing the information loss during the establishment of classifier model. In the evaluation, we involved a total number of 50 participants and collected raw data by means of Android phones. The experimental results show that our proposed authentication scheme can achieve an average error rate of 2.46% (where FAR=2.55%, FRR=2.37%) by means of a PSO-RBFN classifier in authenticating users, and that the designed adaptive mechanism is capable of maintaining the authentication accuracy at a relatively high and stable level. There are many possible topics for our following studies. Future work could include conducting an even larger user study to validate the obtained results and developing
an application that combines the behavioral-biometric based authentication with the password-based authentication (e.g, PIN) to further increase the performance of such a touchdynamics-based authentication scheme. In addition, future work could also include investigating the practical workload of our current feature extraction and the designed adaptive mechanism (e.g., actual processing time), and evaluating the mechanism by means of other possible metrics.
8.
ACKNOWLEDGMENTS
We would like to thank all participants for their hard work in the process of data collection and all anonymous reviewers for their helpful comments in improving this paper.
9.
REFERENCES
[1] F. Bergadano, D. Gunetti and C. Picardi, “User Authentication through Keystroke Dynamics,” ACM Transactions on Information and System Security 5(4), 367-397, 2002. [2] N.L. Clarke and S.M. Furnell, “Authenticating Mobile Phone Users Using Keystroke Analysis,” International Journal of Information Security 6(1), 1-14, 2007. [3] T. Feng, Z. Liu, K.-A. Kwon, W. Shi, B. Carbunary, Y. Jiang, and N. Nguyen, “Continuous mobile authentication using touchscreen gestures,” Proc. the 2012 IEEE Conference on Technologies for Homeland Security (HST), pp. 451-456, IEEE, USA, 2012. [4] D. Fiorella, A. Sanna, and F. Lamberti, “Multi-touch User Interface Evaluation for 3D Object Manipulation on Mobile Devices,” Journal on Multimodal User Interfaces 4(1), 3-10, 2010. [5] M. Frank, R. Biedert, E. Ma, I. Martinovic, and D. Song, “Touchalytics: On the Applicability of Touchscreen Input as a Behavioral Biometric for Continuous Authentication,” IEEE Transactions on Information Forensics and Security 8(1), 136-148, 2013. [6] J.E. Gaffney and J.W. Ulvila, “Evaluation of intrusion detectors: A decision theory approach,” Proc. of the 2001 IEEE Symposium on Security and Privacy, pp. 50-61, May 2001. [7] M. Goel, J.O. Wobbrock, and S.N. Patel, “GripSense: Using Built-In Sensors to Detect Hand Posture and Pressure on Commodity Mobile Phones,” Proc. the 25th Annual ACM symposium on User Interface Software and Technology (UIST), pp. 545-554, ACM New York, NY, USA, 2012. [8] G. Gu, P. Fogla, W. Lee, and B. Skoric, “Measuring intrusion detection capability: an information-theoretic approach,” Proc. the 2006 ACM Symposium on Information, Computer and Communications Security (ASIACCS), pp. 90-101, ACM New York, NY, USA, 2006. [9] A.K. Karlson, A.B. Brush, and S. Schechter, “Can I Borrow Your Phone?: Understanding Concerns When Sharing Mobile Phones,” Proc. the 27th International Conference on Human Factors in Computing Systems (CHI), pp. 1647-1650, ACM, New York, USA, 2009. [10] D. Kim, P. Dunphy, P. Briggs, J. Hook, J.W. Nicholson, J. Nicholson, and P. Olivier, “Multi-Touch Authentication on Tabletops,” Proc. the 28th International Conference on Human Factors in Computing Systems (CHI), pp. 1093-1102, ACM, New York, USA, 2010. [11] J. Koetsier, MobileBeat: Android captured almost 70% global smartphone market share in 2012, Apple just under 20%. (January 2013) Available at: http://venturebeat.com/2013/01/28/androidcaptured-almost-70-global-smartphone-marketshare-in-2012-apple-just-under-20/
[12] L. Kotthoff, I.P. Gent, and I. Miguel, “An Evaluation of Machine Learning in Algorithm Selection for Search Problems,” AI Communications 25(3), 257-270, 2012. [13] D. Lee, The state of the touch-screen panel market in 2011. (January 2013) Available at: http://www.walkermobile.com/March_2011_ID_ State_of_the_Touch_Screen_Market.pdf [14] McAfee And Carnegie Mellon University. Mobility and Security: Dazzling Opportunities, profound challenges. May 2011. Available at: http://www.mcafee.com/mobilesecurityreport [15] Y. Meng, “Measuring Intelligent False Alarm Reduction Using an ROC Curve-based Approach in Network Intrusion Detection,” Proc. the 2012 IEEE International Conference on Computational Intelligence for Measurement Systems and Applications (CIMSA), pp. 108-113, 2012. [16] Y. Meng, D.S. Wong, R. Schlegel, and L.-F. Kwok, “Touch Gestures Based Biometric Authentication Scheme for Touchscreen Mobile Phones,” Proc. the 8th China International Conference on Information Security and Cryptology (INSCRYPT), pp. 331-350, LNCS, Springer, Heidelberg, 2012. [17] Millennial Media. Mobile mix: The mobile device index. (2012) Available at: http://www.millennialmedia.com/research [18] Mobile and NCSA. Report on Consumer Behaviors and Perceptions of Mobile Security. (January 2012) Available at: http://docs.nq.com/NQ_Mobile_ Security_Survey_Jan2012.pdf [19] Y. Numabe, H. Nonaka, and T. Yoshikawa, “Finger Identification for Touch Panel Operation using Tapping Fluctuation,” Proc. the 13th IEEE International Symposium on Consumer Electronics, pp. 899-902, 2009. [20] R. Potharaju, A. Newell, C. Nita-Rotaru, and X. Zhang, “Plagiarizing Smartphone Applications: Attack Strategies and Defense Techniques,” Proc. the 2012 International Symposium on Engineering Secure Software and Systems (ESSoS), pp. 106-120, LNCS, Springer, Heidelberg, 2012. [21] M. Pusara and C.E. Brodley, “User Re-Authentication via Mouse Movements,” Proc. the 2004 ACM Workshop on Visualization and Data Mining for Computer Security (VizSEC/DMSEC), pp. 1-8, ACM, New York, USA, 2004. [22] H. Saevanee and P. Bhattarakosol, “Authenticating User Using Keystroke Dynamics and Finger Pressure,” Proc. the 6th IEEE Conference on Consumer Communications and Networking Conference (CCNC), pp. 1078-1079, IEEE Press, USA, 2009. [23] A. Shabtai, Y. Fledel, U. Kanonov, Y. Elovici, S. Dolev, and C. Glezer, “Google Android: A Comprehensive Security Assessment,” IEEE Security Privacy 8(2), 35-44, March-April 2010. [24] Symantec Enterprise: Norton Survey Reveals One in Three Experience Cell Phone Loss, Theft. (February 2011) Available at: http://www.symantec.com/about/news/release/ article.jsp?prid=20110208_01 [25] D. Van Thanh, “Security Issues in Mobile eCommerce,” Proc. the 11th International Workshop on Database and Expert Systems Applications (DEXA), pp. 412-425, IEEE, USA, 2000. [26] The University of Waikato. WEKA-Waikato Environment for Knowledge Analysis. Available at: http://www.cs.waikato.ac.nz/ml/weka/ [27] S. Zahid, M. Shahzad, S.A. Khayam, and M. Farooq, “Keystroke-based User Identification on Smart Phones,” Proc. the 12th International Symposium Recent Advances in Intrusion Detection (RAID), pp. 224-243, LNCS, Springer, Heidelberg, 2009.