Design perspectives in visualising complex information M. Chalmers UBILAB Union Bank of Switzerland, Bahnhofstr. 45, 8021 Zürich, Switzerland*
[email protected]
Abstract We use an increasing number and variety of systems to present information. Many of the early visualisation systems concentrated on scientific information where dimensions were low in number, objective and orthogonal e.g. in visualising fluid flow over a turbine, or population density over a nation. Recently, however, more complex information has been the subject of spatial models, for example databases of documents, patterns of economic and financial data, and design spaces for electronic circuits. Data dimensionality may be in the thousands, and each dimension may have complex interrelationships with many others. In designing systems for interaction with such data, a variety of topics become relevant which were mostly ignored in early systems. Following on from a brief overview of my own work and some of the lessons and problems arising from it, three points of view are offered—spatial, semantic and social— on the design of spatial information systems. It should be emphasised that these three do not partition the relevant issues. Just as in the more general topic of design, they weave through each other with many interconnections. By looking from each of these perspectives, it is suggested that we need to broaden the range of topics considered relevant to the design of information visualisation systems. Keywords Information visualisation, information design, perception, shared use of information.
1 BACKGROUND A number of groups have been working recently on the visualisation of sets of documents. There are many dimensions to the representation of each document: words are merely the most *. This work was carried out at Rank Xerox Research Centre Cambridge Laboratory (formerly EuroPARC).
This paper appears in Proc. IFIP 3rd Visual Databases Conference, Lausanne, Switzerland, March 1995. Proceedings in book form are to be published by Chapman-Hall.
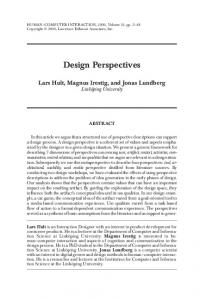
Figure 1 A view from far above an ‘island’ of documents constructed by Bead from just under 500 CHI and TOIS papers. A small cube and title represent each document. At this range we can see that many of the matches for the search word ‘interface’ (darker-coloured documents) occur in the same dense area. commonly used in automatically generating layouts of this type of information. Apart from being an important and widespread type of information, documents are an example of the more varied and complex information which is increasingly available in these days of burgeoning networks and connectivity. The complexity of this type of information suggets that applying visualisation techniques to such information might make access and use easier. Work on the Bead system has concentrated on producing layouts of sets of documents using a metric of similarity or ‘document distance’ between a pair of documents. (An example result is shown in Figure 1.) This metric is based on word co–occurrence, and is at the core of an annealing/optimisation technique based on simulated annealing. In this process the members of the set of documents iteratively push and pull on each other to create an emergent structure: a visualised model of the entire corpus. Similar documents which are far apart pull towards each other. Dissimilar documents which are too close together push away from each other. The system works to reduce these forces and energies i.e. it tries to minimise the energy of the system. As these forces gradually ease off, the model of the corpus settles into shape. Those interested in more details of this method are directed towards (Chalmers, 1992). Being an annealing-based technique, this process and the emergent structures are related to the Kohonen maps of (Lin, 1991). Some experimentation was done with regard to the various parameters to this process, for example the similarity metric which effects (amongst other things) the visually–important tightness (or ‘clumpiness’) of clustering. A good deal of work was done in an effort to make the underlying algorithm more scaleable, as the simpler algorithms have high computational complexity. Bringing down the order of complexity for each iteration to O(N logN) from O(N2) helped in this regard, and early work on a linear time algorithm gave grounds for optimism. This type of technique would appear to have wider applica-
Figure 2 Dropping down closer to the landscape we can see individual documents as well as some artificial landmarks (the pole at the spatial origin, and some distant islands). Another user is visible in the space — the ‘blockie’ figure near the pole. bility: by defining a distance metric and employing a similar layout/optimisation algorithm, other types of information can be laid out. Numerical optimisation can be rather a ‘black art’, and those looking for an introduction might try (Press, 1988). Initially Bead worked to create a 3D ‘point cloud’ where spatial distances approximated document distances as closely as possible. However, as discussed in (Chalmers, 1993), the visual complexity of such structures and the difficulties in orientation and navigation led to a major change in the modelling. Rather than try to push further dimensions into the system, an attempt was made to improve the design by making a simpler model of a corpus of documents in the form of a landscape. The model went from three dimensions down to nearly two. Graphical objects representing documents are placed in a space, and the objects meshed together with polygons to make an ‘island’. In these landscapes, all the words in the documents are used to make a single layout wherein similar documents tend to be close to each other. We can browse with the mouse to get details on individual documents. We also can see global features such as patterns of density, and areas of roughness (peaks and valleys) where the layout is rough and perhaps unreliable. Word searches lead to each document being coloured one colour if it matches and another colour if it does not. In this way we can pick out individual matching documents but also see what other nearby documents might be of interest. We also see information about the search word in that we see how it is distributed across the corpus. By searching and browsing, we can build up a notion of what themes and clusters there are and gain an overall model of where to go to find out about various types of information. Inherent in the structuring algorithm is a tendency for documents which are peripheral to the main themes of the corpus to be pushed outwards to lie on the ‘shoreline’ of the island. The shoreline, the peaks and valleys, and the patterns of word usage and document similarity are all features which can be used to help build
up familiarity with the model and to help in future navigation and retrieval tasks. At present the patterns of word searches are the only ‘higher-level’ representations of subsets of the corpus which are presented, and this is a hindrance to the scaleability of the interface. A related issue here is the legibility of text, as the 3D text objects in the modelled space are illegible from a distance, and also have an implied orientation for the reader’s viewpoint.. The DIVE toolkit (Fahlén, 1993) has been used to construct the shared virtual environment, and visualisation uses the DIVE Visualizer which offers a view onto a landscape which can be shared by others. Other Visualizers on the network show the same landscape and in each one one can see other people moving around the landscape and the changes in colour due to word searches being performed. Although various schemes for limiting or constraining the visiblity of such activities are feasible, at present all people in the space see all searches as in Figure 2, above.
2 SPATIAL REPRESENTATION AND PERCEPTION Those designing information visualisation systems should give attention to work on the perception of spatial form. In presenting information spatially, we potentially gain a great benefit by employing many of our innate perceptual skills. As pointed out in ecological models of perception (Gibson, 1979), however, the traditions of psychology have de–emphasised how features like dynamism, exploration and memory combine over time to help form our perceptions of the environment around us. In designing an information display, we should support movement and exploration through the space so as to let people build up their own models of the information. By moving and searching through a complex environment, looking in detail at some parts, and in overview at others, we make sense of it and make our own decisions about how to use it and work with it. Note that it is not enough to have an information space through which people can move. One has to give thought to what people will see from different positions and angles. Here the classic problems of levels of representation arise: cartographers speak of generalisation and specialisation of information in this regard. The information one presents in a high-level overview is not going to be the same as in a close-up view. When looking at a map of a city, one might look in detail at individual streets, buildings and parks, for example the individual squares and landes in the ‘Old Town’ of some city. A smaller-scale map might also show all of the city area, but the pattern and density of streets would show that the character of the city centre is old and urban even though detail like street names was mostly unavailable. Overlaid on the texture of the street pattern might be more general labels, such as names of city districts. To some extent this is the micro/macro issue discussed in (Tufte, 1990) but I would also refer here to the importance of local consistency in aiding orientation and navigation as discussed in The Image of the City (Lynch, 1960). The analogy or commonality between urban spatial structures and information-based spatial models will be revisited later. With a spatial model of more abstract information one should similarly be able to see detailed descriptions of individual items when up close. As one zooms out that detail should become ‘texture’, while more general or abstract labels for the area become apparent. This is in contrast to the approach where at a certain level of abstraction all detail is hidden e.g. seeing only a directory name and nothing of the files in that directory. By retaining some of the lowerlevel information you rely less on the ability of higher-level labels to summarise everything below. One can still use dynamic techniques in combination with such labelling e.g. seeing the
patterns of colour change on a map of documents as one makes a command to the effect of “all documents matching the word ‘interface’ now turn bright green”. Here we see an advantage of graphical layouts when compared to more traditional interfaces to information retrieval systems. One of the things that 2D and some 3D representations support is a space for relative comparisons. In many IR systems, retrieved documents (perhaps matching some keyword) are offered to the user in a ranked list i.e. relative to a query. The list, however, does not afford much information on the relations between members or the relationships with other non-matching but potentially relevant documents. The context of each document is hidden, as the internal structure of the corpus of documents is kept as a highdimensional ‘black box’. Browsing or exploring outwards from an interesting document is therefore a rather indirect and ill-framed process. One might be able to ask for ‘other documents like this one’ but again we have to blindly plunge our hand into some unknown part of the black box without being able to use any sense of overall setting and structure. We cannot easily use our prior experience with the corpus to build up a model of what is where i.e. use our spatial memory skills to guide future work. For such uses of an information space, a naturalistic 3D view seems a powerful but familiar way of controlling information detail. Perspective lets us gain an overview of distant regions and detail of what is close. Note that although the view may be 3D the structure has to be such that it allows for a mostly unimpeded view i.e. either 2D (a plane) or near to it (e.g. a rolling landscape). If information structures are too ‘strongly 3D’ with many parts occluded by others—for example in the Cone Trees of (Robertson, 1991)—then overviews are difficult to present. It becomes difficult to maintain orientation and navigation becomes more complex. In graphical displays, resolution is a very significant constraint. As we move through an information space and change our point of view, we continually reallocate this scarce resource to suit our information interests: things we are interested in we often move close to, while things of less interest can be further away. We should tie this in with the design of the information display. When information is distant we will have fewer pixels with which to show its character. We should tailor the display of such a distant region by suppressing some details, allowing others to become texture, and bringing in other higher-level labels or symbols to convey general properties. The character of a local region is only one of the spatial properties proposed in The Image of the City as being significant for the design of complex spatial structures such as cities and, for the purposes of this paper, information spaces. Lynch also discusses other features for orientation and navigation (for ‘imageability’) such as how landmarks and major edges (e.g. shorelines, rivers) act as reference points for orientation, how our routes in and out of a city, and our views from them, are often the basis for our growing knowledge of the city. Some modification of these ideas to the particular technological setting may be necessary (e.g. our practice of using ‘flying’ viewpoints over the space rather then usually being constrained to stay on the ground and enter an area by standard routes) but many of the principles of design that Lynch espouses are general enough to be applied in this new context. We should not forget, however, that imageability is, however, only one issue in design. We should not forget people’s uses and models of the space, and how their various tasks may be varied (sometimes to the point of contradiction) and concurrent. Apart from being a legible, unfolding structure it should also have significance for people in that the model should fit and support their behaviour as they follow their various tasks and interests. Issues of structure, fit and meaning are discussed in the following section.
3 STRUCTURE AND SEMANTICS The spatial environment of an information display benefits by having semantic structure. The design should ‘make sense’ somehow—although it should be borne in mind that there are many ways that it might make sense. For example, with books in a library the spatial layout usually relies on classification systems such as the Dewey Decimal. A book on a shelf is likely to be nearby to others which are similar in textual content. If we have a reference to a book and find it on the shelf then even if it is not what we want it may be a good spot to start browsing from. Other libraries use the date of accession as the primary spatial factor but still have subject and keyword-based indices available, but it seems better for the purposes of browsing and exploration to structure a layout so that local areas have similar content or character. The graphical representations of this information should also scale up so that in overview some sense of the character is conveyed to the more distant observer. Also, this consistency will aid when trying to create concise, descriptive labels or symbols to form higher-level representations for these distant regions. These higher level representations should themselves scale up. As we move towards handling large databases we will most likely have to consider hierarchies of representations so that we can offer manageable amounts of information to the users at each point in their work. We have to be able to support the dynamic patterns of browsing and searching that make up many information-seeking tasks (O’Day, 1993). By making available views of the information at different levels we maintain the context within which detail fits. By making higher-level abstractions reflect aggregations of lower-level detail we allow the user to work with large bodies of information. By making the transitions between levels smooth and continuous we retain context as we zoom in one some detail, and therefore maintain orientation. This suggests that the kind of low-level structuring we do to cluster items of similar character (i.e. at the ‘bookshelf’ level) should also happen at progressively higher levels (the entire stack, the row of stacks, the wing of the library). If consistency at these various levels is maintained then we can make sense of regions of information at any scale. To some extent we wish the model of the information to ‘feel right’: to make sense for the people who work with the information so that they can more easily go about their tasks. The ways in which we structure information should therefore reflect the ways in which they structure their work, if possible. Some of the ways in which people structure information representations for their tasks have been discussed in (Russell, 1993) and (Marshall, 1994). These papers emphasise how a group of people with a particular task in mind will iteratively customise the structure of a body of information in order to find a set of organising criteria and an associated representational structure to support their work. Information can sometimes be structured to suit a path through it if the tasks involving the information have a simple order e.g. chapters and their prerequisite materials in a textbook may determine its structure just as the enforced order of check-in, customs, and passport control define the route through an airport when boarding an aeroplane. Very little work in information retrieval has supported this type of endeavour. More often we have concentrated on much wider groups of people and more general tasks e.g. the users of a library, and the vast variety of queries they might have about the library’s contents. In this case it is unlikely that there will be a standard path through the information, nor a simple spatial structure for such a path. We so rarely focus on a particular group of users and their particular needs and styles of information use, but we should consider the fact that different groups
or individuals will wish to structure and use their information in their own ways. As we design spatial models for the increasing numbers of people who use information systems, we should be aware that we are building workspaces (or even ‘workplaces’) for them, and—in the many ways one might consider the word ‘fit’ to apply here—we ought to make the workplaces fit people and their work. We might wish to have a model of the information that is essentially the same as the user’s mental model. This might be feasible for one person, but perhaps only for a short period of time or for a particular task. As people use information they evolve and revise their mental model, and of course such dynamism is hard for a system to handle. An advantage of a more static type of information modelling is that constancy aids users in becoming familiar with a complex model i.e. they adapt their mental model to work with the model offered by the information system. There are of course some situations where such dynamism would be required e.g. visualising the results of a query or when trying out a new structuring scheme interactively. Still, if a large information resource changes too drastically too quickly then people can become confused and their work disrupted e.g. when a library changes its shelving layout to accommodate new stock. (Lynch and related writers such as Alexander also discuss the issue of dynamism and evolution of structure.) Slowly changing or static layouts also help people to help each other in that a shared model of information becomes a resource for mutual awareness, collaboration and sharing of duties. Some issues in social use of information are discussed in the following section.
4 SOCIAL AND SHARED USE OF INFORMATION In the earlier sections I have often used the word ‘work’ rather than ‘use’ when discussing how people interact with information. For many people, there is an aspect of their use that is often negelcted in the design of information systems, namely that any particular interaction with an information system is merely a part of a larger task of work. The interaction is a means to an end and not an end in itself, and the users bring their own particular experience, expertise, customs and associations to their information task. One side of this issue relates to customisation for the individual or work group, as well as the attempt to design information to take advantage of our perceptual and memory skills. The other side, however pushes further on the fact that for most people work is a collaborative or social activity. In day to day work, social protocols and habits pervade our use of information. Who gives us an item of information, who else is interested in it, who created it, who owns it, what will my boss think of it: we work with these issues as well as the ‘semantic’ content. These issues can change how we perceive and use information, making us adjust our perception of what is useful, significant or interesting. Social and organisational issues therefore should affect how we structure information representations. We should also be aware of how people will share information to build up social means of navigation. How often have you learnt about an article because of a personal recommendation by a colleague? How often do you consider the author’s reputation, review or sales figures when you look at a book you might read? Why do people often offer a list of ‘URLs they found interesting’ in their WWW home pages? Social use pervades many environments where database systems are used — systems which internally enforce strict rules of non–interference of data access. A person may well still sit up and tell their neighbour about where to look for some useful data. This would be a perfectly natural thing to do in a workplace, although the technology designed to support
it (e.g. a database) offers no direct and comfortable technological means of maintaining this commonplace example of everyday database use. Sometimes it seems as though there are no computer systems which, while not being CSCW systems per se, nevertheless are used in collaborative work. People continually share information on how to use information systems—from ‘.login’ files to shell scripts to good bulletin boards to read. A lot of people don’t read manuals or go on courses to learn about new systems and programs. They ask people they consider to be reasonably expert how to do things or they just look around nearby to see what their neighbours do. How would we use traditional information systems to answer a question like “what’s happening in low-temperature physics nowadays?” A friend of mine who works on the edge of this field tells of the many (perhaps 30) reviews of activity in LTP that are published each year. He says that he wants a system which “won’t tell me what reviews have been written.. it’ll tell me the review that was written.” i.e. the one considered the best by the people who know about such things. Voting schemes and ‘seals of approval’ can also provide for more formal declarations of awareness or activity in a topic and opinions on the quality of an item of information (Goldberg, 1992). Such metainformation might be woven into the structuring of a spatial model, but we should also consider more informal or transient types of metainformation. When you see someone browsing the books on the same library shelf as one you’ve been referred to, you can guess that the person may know something about the topic of your reference and may be able to help you. If someone writes an article or posts to a bulletin board, this is a public action that declares an interest or activity in a topic. We could take this type of information into a spatial information model but we could also offer a more direct representation. A shared information space would offer the opportunity to make visible both individuals exploring and working on particular areas of information, and also some cumulative information on their past or collective activity. We might see the ‘hot topics’ where people in the information space are more closely positioned or where they have left their ‘footprints’ behind. Ideally we should combine the direct and the indirect, as our glossy new spatial information systems will only be one of many tools used in the course of a person’s work. A great number of possibilities open up for research in this area, even though (or perhaps because) the inherent complexity and subjectivity of such issues are somewhat at odds with the tradition of scientific data analysis. However, if we accept that these issues are significant in the perception, structuring and use of complex information then we would be unwise to ignore them.
5 CONCLUSION As we work on prototypes of spatial information systems, it becomes more apparent that a wide range of issues influence the system design. From the mathematical techniques for automatic layout and document retrieval, through to perceptual issues to semantics and levels of representation, and on to social information use and the ‘organisational mind’—the range may seem daunting. Such a variety of issues was rarely if ever considered in earlier information systems but as we move to more interactive, graphical and networked systems we must take these issues on board. One possible means to achieve this is to consider our design and research tasks as being similar to that of architects and urban designers. They have built up a tradition of creating workplaces within which they accept that people do different jobs, follow different interests,
and interact in complex ways. They have to mix issues of aesthetic design, social opinion and organisational patterns while retaining a grasp on the technical and functional basics. Just as our systems will only be a small part of peoples’ information activities, a building is usually seen as part of a wider urban setting where people perform their own tasks their own ways. We can learn from the design problems, examples and theory of this field. We should widen and deepen the knowledge used in our own field, and as a result we may further our efforts to create better interfaces and systems.
6 REFERENCES Chalmers, M. and P. Chitson (1992), Bead: Explorations in information visualisation, Proc. ACM SIGIR’92, Copenhagen, published as a special issue of SIGIR Forum, ACM Press, 330–37. Chalmers, M. (1993), Using a landscape metaphor to represent a corpus of documents, Proc. European Conference on Spatial Information Theory, Elba, September 1993. Published as Spatial Information Theory, Springer Verlag LNCS 716, A. Frank & I. Campari (eds.), 1993, 377–90. Fahlén, L et al., (1993), A space based model for user interaction in shared synthetic environments, Proc. ACM InterCHI’93, 43–8. Gibson, J.J. (1979), The Ecological Approach to Visual Perception, Lawrence Erlbaum. Goldberg, D. et al. (1992), Using collaborative filtering to weave an information tapestry, Comm. ACM 35(12), 61-70. Lin, X et al. (1991), A self-organizing semantic map for information retrieval, Proc. ACM SIGIR’91, Chicago, published as a special issue of SIGIR Forum, ACM Press, 262–69. Lynch K. (1960), The Image of the City, MIT Press. O’Day, V. and R. Jeffries (1993), Orienteering in an information landscape: how information seekers get from here to there, Proc. ACM InterCHI’93, 438–45. Marshall, C., F. Shipman and J. Coombs (1994) VIKI: Spatial hypertext supporting emergent structure, to appear in Proc. ACM ECHT’94. Press, W.H., B.P. Flannery, S.A. Teukolsky & W.T. Vetterling (1988), Numerical Recipes in C, Cambridge University Press. Roberston, G.G., J.D. MacKinlay and S.K. Card (1991) Cone trees: animated 3D visualizations of hierarchical information, Proc. CHI’91, ACM, New York, pp. 189–94. Russell, D.M. et al. (1993) The cost structure of sensemaking, Proc. ACM InterCHI’93, 269– 76. Tufte, E. (1990) Envisioning Information, Graphics Press.
7 BIOGRAPHY Matthew Chalmers obtained a B.Sc. (Hons) from Edinburgh University and then a Ph.D. in ray tracing and multiprocessor programming from the University of East Anglia. He was an intern at Xerox PARC and later joined Rank Xerox EuroPARC where his work on information visualisation began. In January 1995 he moved to Ubilab to carry on this line of work and to help set up a new group in the area of interaction with complex information.