Katherine Fu
Design Team Convergence: The Influence of Example Solution Quality
e-mail:
[email protected]
Jonathan Cagan1 e-mail:
[email protected]
Kenneth Kotovsky e-mail:
[email protected] Carnegie Mellon University, 5000 Forbes Avenue, Pittsburgh, PA 15213
1
This study examines how engineering design teams converge upon a solution to a design problem and how their solution is influenced by information given to them prior to problem solving. Specifically, the study considers the influence of the type of information received prior to problem solving on team convergence over time, as well as on the quality of produced solutions. To understand convergence, a model of the team members’ solution approach was developed through a cognitive engineering design study, specifically examining the effect of the introduction of a poor example solution or a good example solution prior to problem solving on the quality of the produced solutions. Latent semantic analysis was used to track the teams’ convergence, and the quality of design solutions was systematically assessed using pre-established criteria and multiple evaluators. Introducing a poor example solution was shown to decrease teams’ convergence over time, as well as the quality of their design solution; introducing a good example solution did not produce a statistically significant different effect on convergence compared with the control (with no prior example solution provided) but did lead to higher quality solutions. 关DOI: 10.1115/1.4002202兴
Introduction
Understanding the engineering design process from a cognitive perspective is highly valuable. The insights gained can shed light on ways to be more efficient and successful as design engineers, as well as to inform the building of computational tools to aid engineers during the design process. Most of the designs that happen in the industry today cannot be accomplished by a single designer. The increasing complexity of the products demanded by customers and the inability of any one design engineer to be an expert in all necessary fields require that a team of designers be engaged 关1兴. Thus, understanding the effects of external influences on the cognitive mechanisms employed by members of design teams is critical to understanding and improving the engineering design process. The effective performance of engineering design teams has been shown to be correlated with successful product development 关2兴. The work presented in this study does not consider such factors as personality dynamics among design team members on problem solving. Here, the groups were randomly assigned to conditions, resulting in a uniform distribution of such factors. Instead, this study is concerned with controllable external conditions that could stimulate or inhibit the production of better solutions in more efficient ways by any team of design engineers. The key question to be answered is: “How is the convergence and quality of solutions produced by groups of engineering designers affected by the information they are initially given and, more specifically, by a poor example and good example solution?” Here, convergence refers to the process of reaching alignment around a common understanding of the design problem and/or its solution共s兲 among the members of an engineering design team. The study of how designers, working both individually and in teams, respond to the introduction of information beyond the design problem statement has been pursued from a variety of perspectives. Work has been done to understand how the introduction of 1 Corresponding author. Contributed by the Design Automation Committee of ASME for publication in the JOURNAL OF MECHANICAL DESIGN. Manuscript received July 7, 2009; final manuscript received July 21, 2010; published online November 3, 2010. Assoc. Editor: Bernard Yannou.
Journal of Mechanical Design
analogies affects the ideation process and outcomes 关3–6兴, with some studies specifically examining how the introduction of analogies with different levels of applicability to the design problem affect individual designers 关7,8兴. It has been shown that when designers have “open goals” 共i.e., unsolved problems兲 in mind when exposed to information that could be relevant to the design problem, those open goals can aid problem solving 关9,10兴; this open goal effect is achieved by giving designers supplemental valuable information or hints consisting of distant or unobvious information, only after solving has already begun. Tseng et al. found that giving individuals information that was analogous but distantly related to the design problem caused them to produce more solutions with a wider range of solution types and a higher level of novelty when open goals existed; in the absence of open goals 共i.e., prior to the introduction of the problem to be solved兲, highly similar analogous information was more easily applied than distantly related analogous information 关8兴. A potential negative effect of introducing analogical information or examples that has been extensively explored is design fixation 关11–14兴, or the “blind adherence to a set of ideas or concepts limiting the output of conceptual design” 关11兴. Jansson and Smith showed that introducing examples can cause designers to generate solutions that mimic the examples to the point of violating the design problem objectives 关11兴. Ward and co-workers showed that designers included aspects of examples in their solutions, even when explicitly told not to, implying that they have little control over the degree to which they are influenced by examples they see 关15,16兴. A number of studies have shown that team coherence and convergence on a common representation of the problem, goals, and/or solution are correlated with better design performance 关17,18兴. This finding holds true for long-term team design work. Initially, fast team convergence on a solution may have a negative influence by limiting the range of possible solutions examined. The complex interplay of team convergence, quality of the design solution produced, and time is one of the main issues addressed in this study. In order to track the “thought worlds” 关19兴 of engineering design groups, Dong et al. gathered documentation from design groups over an extended period of time, including emails, reports, personal journals, and memos 关18兴. These texts were then analyzed using latent semantic analysis 共LSA兲, a computational tool that extracts contextual meaning from documents through sta-
Copyright © 2010 by ASME
NOVEMBER 2010, Vol. 132 / 111005-1
Downloaded 03 Nov 2010 to 128.237.239.232. Redistribution subject to ASME license or copyright; see http://www.asme.org/terms/Terms_Use.cfm
tistical computations 关20–24兴. In order to track how close the designers’ points of view were to one another at four different times during the study, the metric of level of semantic convergence was computed using cosine similarity on the resulting LSA matrix. A method similar to that used by Dong et al. is employed in this study, but it is applied over a much shorter period of time 共minutes instead of months兲 and with limited text information 共paragraphs instead of volumes兲. LSA spaces created with a small corpus of information 共similar to the size used in this study兲 have been shown to produce positive results 关25兴. One contribution of this study will be to use the “thought tracking” method of Dong et al. to investigate how supplementary information affects groups and their convergence, extending the technique to shorter time periods and with limited records of the event 共i.e., shorter and fewer numbers of documents兲. Our decision to use LSA to extract similarity between documents and measure group convergence is based on the fact that it has been used effectively in prior work to study similar phenomena 关18兴. Alternative methods to LSA include latent Dirichlet allocation 共LDA兲, which uses a generative model based on Bayesian statistics 关26兴. Most importantly, we seek to understand how convergence of teams is affected by the quality of the example solutions they view at the start of problem solving. Because example type influences the individual problem solver 关8兴, we seek to understand whether and how example quality will affect the overall team convergence, i.e., the uniformity of representation of the current best solution. This is important because team convergence is an indicator of the degree to which team members are aligned in their understanding of the problem being solved 关21兴, and the speed of team convergence is a central issue addressed by the technique of brainstorming. Using a design problem with multiple criteria for success, we studied teams through a formal cognitive experiment that introduced a poor example, a good example, or no example at the start of problem solving. Throughout the task, team participants collaboratively solving the problem provided written accounts of their individual representations of their “current best solution or solution approach.” Using LSA to analyze the writings, we sought to understand how teams converge on a common solution and how this convergence is affected by the information they are initially given. This work is an initial exploration of group design that attempts to expand knowledge about the properties of design team convergence and how it is influenced.
their coherence as a group and their convergence on a final design solution. The negative characteristics of the poor example were predicted to influence the teams to include similar features in their designs. It was additionally hypothesized that exposure to the good example would cause convergence to increase and would have a positive effect on the final design solution quality. The thinking behind this was that the teams would potentially accept and perhaps mimic the good example, leading to high convergence throughout the design process and on a final design solution, as well as to high quality solutions. It is important to note that this work was approached and performed as exploratory work into the mechanisms involved in group design, how groups converge during design, and their output as a group.
2
2.3.1 Control Groups. The control group was given only the design problem statement, as follows. Design problem: Device to shell peanuts. In places like Haiti and certain West African countries, peanuts are a significant crop. Most peanut farmers shell their peanuts by hand, an inefficient and labor-intensive process. Our goal is to build a low-cost, easy to manufacture peanut sheller targeted at individuals and small cooperatives that will increase the productivity of the peanut farmers. Further, this peanut sheller should be manufacturable with materials that are readily available in the target communities. Our target throughput is approximately 50 kg/h 共110 lbs/h兲. Customer needs.
Experimental Method
2.1 Experiment Overview. The purpose of the experiment was to gain an understanding of how teams converge and cohere during the design problem solving process, as influenced by supplementary information given at the outset of problem solving. The independent variable was the type of supplementary information that was given to the participants using three different conditions—a good example solution to the design problem, a poor example solution to the design problem, or no example solution as the control condition. The dependent variables were the resulting level of semantic convergence as measured by LSA and the quality of the final design solutions that were produced by the groups. The researchers controlled the scholastic background 共mechanical engineering兲 and level 共senior undergraduate兲 of the participants, the degree to which each pre-established team had worked together, the amount of time to solve the design problem, the amount of time to record written accounts, the tools and facilities provided, and the compensation for participation. This experiment focused on the influence of different types of external information on team convergence to a final design solution and on the quality of the final design solution. It was hypothesized that exposure to the poor example would suppress convergence and have a negative effect on final design solution quality. The thinking behind this was that the poor example would potentially cause disagreement among group members about the constraints and customer needs, and thereby lower 111005-2 / Vol. 132, NOVEMBER 2010
2.2 Participants. This experiment was conducted at Carnegie Mellon University. Ninety-two senior undergraduate mechanical engineering students participated in the design study for 1 h in groups of three to four students at a time. The students participated in teams that were predetermined according to the engineering design course in which they were enrolled, meaning that all of the teams had similar levels of familiarity and experience in working together to solve engineering design problems. Three conditions were imposed by giving different information in the instructions: the control condition, with eight groups; the poor example condition, with eight groups; and the good example condition, with seven groups. The groups were randomly assigned to one of the three conditions in the experiment. Although the sample size of groups was necessarily limited compared with the size of the overall participant pool, this is compensated for by the fact that each individual participant contributed data to the overall study. 2.3 Materials and Design. Each group was given two physical spaces in which to work, one for group solving that was equipped with pens, pencils, blank pages of paper and a voice recorder, and one for individual writing that was equipped with one laptop per participant spaced about 2 ft apart. These precautions were taken to keep the participants from sharing ideas during the writing sessions and to ensure that the written accounts were an accurate snapshot of each individual’s perspective alone, rather than a shared team perspective. This allowed for a more realistic and unbiased interpretation of the team’s level of convergence around the current best solution during the design process.
• • • • •
Must remove the shell with minimal damage to the peanuts. Electrical outlets are not available as a power source. A large quantity of peanuts must be quickly shelled. Low cost. Easy to manufacture.
The design problem chosen for this study was used previously by Linsey et al. to study design teams and collaboration 关27兴. The problem, explained in further detail in the next section, was to design a device to shell peanuts 关28兴. This problem was chosen for its high level of engineering content and for its relevance to the important issues of poverty, hunger, development, and sustainability. Some solutions to this problem currently exist, including the Transactions of the ASME
Downloaded 03 Nov 2010 to 128.237.239.232. Redistribution subject to ASME license or copyright; see http://www.asme.org/terms/Terms_Use.cfm
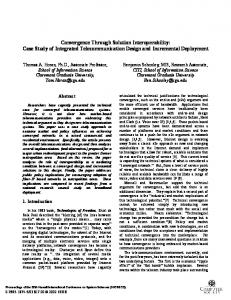
Fig. 1 Schematic of example solution, given to subjects in poor example condition †31‡
“full belly sheller” 关29兴, which will be discussed later, and the “low-cost peanut sheller” 关30兴, which was developed at MIT. 2.3.2 Poor Example Groups. Participants in the poor example condition were additionally shown a poor example solution to the given design problem, as seen in Fig. 1. The poor example in this study was used first by Linsey et al. to measure the effect of a poor example on individual ideation 关31兴; this example is considered poor because it uses an unsustainable and expensive energy source and is inefficient, not portable, and expensive and infeasible to manufacture. 2.3.3 Good Example Groups. Participants in the good example condition were shown a good example solution, as seen in Fig. 2, in addition to the design problem statement. This example is considered good because it uses the sustainable and readily available energy source of human power, and is simple and cheap to manufacture, portable, and relatively efficient. The sketches in Figs. 1 and 2 were intended to be of equal rendering quality. 2.4 Procedure. The participants were first asked to sign consent forms, and then each participant was given her/his own set of instructions. The instructions were read aloud to the participants, after which they were given a few extra minutes to read them silently. In addition to and integrated into the instructions, the poor example condition was given the example solution shown in Fig. 1, and the good example condition was given the example solution shown in Fig. 2. The participants were told that the group within the study that produced the best design would be awarded a $50 gift certificate to a local restaurant as an incentive to take the task seriously and do their best work. They were informed of the overall schedule of the experiment, specifically that there were 30 min total to create a design solution to the given problem as a group. The 30 min were divided into three discrete 10 min group solving sessions, between which they would be asked to write a
short paragraph individually on the laptops provided. For the collaborative design problem solving, they were told to use the provided blank pages to record their work and solution, which should include a sketch, labels of major elements, and a one to two sentence description of how the design works. They were not allowed to speak to one another during the reading of the instructions in order to avoid starting the collaborative design problem solving before an initial individual written account had been gathered from each of them. The initial written account was obtained before any collaboration began to serve as a benchmark of each participant’s uninfluenced state, and used later to inform the metric of level of semantic convergence 共used to measure team convergence兲 by tracking individuals and their influence on one another through the design process. Participants were then asked to choose the laptop that they would use throughout the study and individually spend 5 min answering the following prompt: In your own words, without consulting the instructions sheet or any other materials, please describe your current approach to a solution or your current best solution and how it works in three to five sentences. The participants received a 1 min warning before the 5 min had elapsed, as they did with all other timed portions of the study in order to avoid incomplete sentences, thoughts, and/or designs. They then moved to the solving space and began interactively solving the design problem as a group for 10 min. After the first 10 min solving session, they returned to the laptops to individually answer the following prompt: At this point in your solving, please describe your current best solution or solution approach and how it works in three to five sentences. Please use your own words, without consulting the instructions sheet or any other materials. The participants were asked not to consult the instructions or any other materials to avoid copying of the design problem, con-
Fig. 2 Schematic of example solution, given to subjects in good example condition
Journal of Mechanical Design
NOVEMBER 2010, Vol. 132 / 111005-3
Downloaded 03 Nov 2010 to 128.237.239.232. Redistribution subject to ASME license or copyright; see http://www.asme.org/terms/Terms_Use.cfm
Fig. 3 Pictorial timeline of events
straints, example solutions, or notes from other members of the group and to encourage producing an account of their own individual solution ideas at that point in time. The participants then solved the design problem as a group for a second 10 min period, after which they answered the same prompt as shown above. After a third 10 min group solving session, the participants answered the same prompt for a final fourth time. They were then given 5 min to write and sketch, by hand, one final design solution as a group in the group solving space. The final design solution was requested as a single collaborative submission in order to emphasize the importance of the group attempting to come to a consensus during the design process and to avoid any ambiguity in analysis that would result from multiple accounts of the final design solution. A pilot study was run prior to the experiment with three small teams of two students to verify that three 10 min solving sessions were sufficient to develop a solution and that 5 min of individual typing on a laptop was sufficient to capture the preceding 10 min of problem solving. Figure 3 is a pictorial explanation of the timeline of events. Participants then returned all materials, including the instructions and the final group design. Each participant was awarded $10 as compensation for their effort and time. The two levels of compensation served separate goals. The $10 compensation was to motivate the students to participate in the first place, since participation was voluntary. The $50 gift certificate promised to the team that produced the best solution was intended to motivate the students to do their best work and remain engaged in the task throughout the experiment.2
3
Analysis and Results
3.1 Analysis Method. The texts collected during the four writing sessions from each participant in all three conditions, in addition to the instruction texts and the texts from the final group designs, were used to create a custom LSA space. The average document size for each individual writing session was 104 words. LSA is initiated by forming a word-by-document matrix, where the columns represent the individual text passages, the rows represent the words that appear in the documents, and the cells are populated by a tally of the number of times each word appears in each document. Next, an “entropy weighting” step was performed, which is a two-part transformation on the word-bydocument matrix that gives a more accurate weighting of the word-type occurrences based on their inferred importance in the passages. Then, singular value decomposition 共SVD兲 is performed on the transformed matrix, resulting in three matrices 共U, S, and V兲. By multiplying S and the transpose of V, and using cosine 2 The $50 gift certificate was awarded randomly, and the overall best design was not intended to be assessed.
111005-4 / Vol. 132, NOVEMBER 2010
Fig. 4 Illustration of six pairwise comparisons made with LSA for one group of four participants, averaged for each writing session
similarity, a matrix of document-to-document coherence values, or levels of semantic convergence, is produced. These values range from ⫺1 to 1, where ⫺1 signifies a perfect negative correlation, 1 signifies a perfect positive correlation, and 0 signifies that there is no correlation. Thus, if two documents were exactly the same, a value of 1 would be produced for cosine similarity 关24兴. The LSA space was created using the union of all words in all documents. The dimensionality of the LSA space was chosen to be 366, the total number of documents used to create the space. Though this is a relatively small number of texts to comprise the corpus used to create the LSA space, as compared with traditional LSA procedures, spaces created with a small corpus 共similar to the size used here兲 have been shown to produce positive results nonetheless 关25兴. Successful LSA evaluation of this space would enable its use in short design sessions, such as the ones included in this study. The texts were compared with each other using this LSA space, which created a specific context in which the words within the texts relate to one another. The code to process the documents into the word-by-document matrix was implemented in PERL, a language appropriate for handling text, and the entropy weighting, SVD, and cosine similarity operations were performed using MATLAB. 3.2 Team Convergence Assessment. The texts from participants in one group during a single writing session were compared with one another using LSA, and an average of all of the pairwise comparisons was taken to generate an average level of semantic convergence for the group at that point in time. The level of semantic convergence is an indicator of how similar the descriptions of their current state of the design solution are. This analysis was performed on all of the groups in all conditions for all writing sessions. An illustration of the average of the pairwise comparisons for one group of four participants at the time of each writing session is shown in Fig. 4. Each arrow between two participants represents a pairwise comparison that was made. The six bars below represent the six comparisons that were made, which were averaged for each of the four writing session times, corresponding to the four columns. As can be seen in Fig. 5, the average level of semantic converTransactions of the ASME
Downloaded 03 Nov 2010 to 128.237.239.232. Redistribution subject to ASME license or copyright; see http://www.asme.org/terms/Terms_Use.cfm
Fig. 5 Average level of semantic convergence within groups; error bars show ±1 standard error
gence within the groups increased as solving progressed. Due to inhomogeneous variances indicated by Levene’s test 共F = 2.661, p ⬍ 0.007兲, a two-way analysis of variance 共ANOVA兲 to examine the effects of the two independent variables could not be run without violating assumptions. Instead, two Kruskall–Wallis nonparametric one-way ANOVAs 共␣ = 0.05兲 were run, which showed that the independent variables of introducing example solutions 共p ⬍ 0.049兲 and time 共p ⬍ 0.001兲 were correlated with significant effects on the level of semantic convergence. These results validate the fact that the introduction of example solutions had a significant effect on the level of semantic convergence and that the level of semantic convergence within the team significantly changed over time. A repeated measures ANOVA 共␣ = 0.05兲 examining the good example condition showed that the ⬙between writing sessions⬙ effect was signifcant 共F = 3.525, p ⬍ 0.031兲, meaning that the overall effect of time as measured by the four writing sessions had a significant effect on the level of semantic convergence. The least significant difference 共LSD兲 post hoc comparisons showed a significant increase in the level of semantic convergence between the first 共M = 0.449兲 and fourth 共M = 0.542兲 writing sessions 共p ⬍ 0.005兲. All other pairwise comparisons between the writing sessions were found to be insignificant for the good example condition, including the apparent dip in the level of convergence between writing sessions 2 and 3. The control condition repeated measures ANOVA 共␣ = 0.05兲 showed that the ⬙between writing sessions⬙ effect was significant 共F = 4.312, p ⬍ 0.014兲, meaning that the overall effect of time as measured by the four writing sessions had a significant effect on the level of semantic convergence. The LSD post hoc comparisons showed a significant difference in the level of semantic convergence when comparing writing session 1 共M = 0.458兲 with writing session 2 共M = 0.515, p ⬍ 0.047兲, writing session 1 with writing session 3 共M = 0.539, p ⬍ 0.007兲, and writing session 1 with writing session 4 共M = 0.547, p ⬍ 0.004兲. Qualitatively analyzing Fig. 5, even though the increase in convergence was only marginally significant, the poor example condition seems to be nearly parallel to the other two conditions over all sessions, with the major difference being that it started at a lower level. In essence, the teams in the poor example condition were handicapped by their initial exposure to the poor example, causing them to be at an overall lower level of semantic convergence through the duration of the group solving. The repeated measures ANOVA 共␣ = 0.05兲 for the poor example condition alone showed that the general ⬙between writing session⬙ effect was insignificant 共F = 1.411, p = 0.260兲; this means that the overall effect of time, as measured by the four different writing Journal of Mechanical Design
sessions, on the level of semantic convergence was insignificant. However, LSD post hoc comparisons indicated that the poor example condition marginally significantly increased in average level of semantic convergence over time 共p = 0.055兲 when comparing the first writing session 共M = 0.423兲 to the fourth writing session 共M = 0.507兲. All other pairwise comparisons between the writing sessions were found to be insignificant for the poor example condition. Figure 6 shows examples of pairs of documents from the writing sessions with low convergence and high convergence. The convergence was measured by comparing all six pairs of documents from the writing sessions. Another comparison made was that of all of the individual writing session texts from each writing session to the corresponding group’s single final design solution text, an illustration of which is shown in Fig. 7. This comparison can be thought of as tracking the group’s averaged collective convergence to their final consensus. From Fig. 8, it is clear that the groups converged to their respective final design solution over time, with the good example and control conditions having higher overall levels of semantic convergence than the poor example condition. A two-way ANOVA 共␣ = 0.05兲 was run, which confirmed that the effect of the type of example solution introduced 共F = 3.533, p ⬍ 0.035兲 and the effect of time 共F = 6.237, p ⬍ 0.002兲 on the average level of semantic convergence to the final design solution description text were both significant. The interaction of the two independent variables was not significant. Looking more closely using LSD post hoc comparisons, the poor example condition effect 共M = 0.378兲 was found to be significantly different from both the good example condition 共p ⬍ 0.040兲 and the control condition 共p ⬍ 0.018兲. The good example condition 共M = 0.434兲 and the control condition 共M = 0.442兲 did not produce significantly different effects on the level of semantic convergence to the final design solution. This is an important result, as it shows that the introduction of a poor example solution has a strong suppressive effect on convergence to a final design, while a good example solution has a neutral effect on convergence to a final design. An additional comparison was made between each individual’s first writing session text and the design problem text, and averaged for each group, to attempt to gauge if the starting points were significantly different from the representation of the design problem that was initially given in the design problem statement. A one-way ANOVA 共␣ = 0.05兲 indicated that the overall between condition effects were not significant 共F = 2.078, p = 0.151兲, and the LSD post hoc comparisons showed a marginally significant difference 共p = 0.055兲 only between the poor example condition 共M = 0.415兲 and the control condition 共M = 0.445兲. The other two pairwise comparisons to the good example condition 共M = 0.430兲 were statistically insignificant. 3.3 Final Design Quality Assessment. The 23 final designs, one for each group 共eight each for the control and poor example conditions and seven for the good example condition兲, were evaluated using a decision matrix, or Pugh chart, with the “full belly peanut sheller” as the comparison solution 关29兴. The full belly peanut sheller, an existing actual solution to the real world problem, also served as the inspiration for the good example solution used in the study, and thus the comparison of designs from the good example condition to the full belly peanut sheller as the datum could be biased by the similarity of the solutions, potentially stemming from fixation effects. Keeping this effect in mind for discussion later, the designs were evaluated by a mechanical engineering doctoral student with experience in the field of engineering design. The attributes on which the designs were evaluated were created using the customer needs and engineering requirements presented to the participants in the instructions and are as follows: NOVEMBER 2010, Vol. 132 / 111005-5
Downloaded 03 Nov 2010 to 128.237.239.232. Redistribution subject to ASME license or copyright; see http://www.asme.org/terms/Terms_Use.cfm
Fig. 6 Example pairs of documents from the writing sessions with low convergence and high convergence
• • • • • • •
Removes the shell without damaging the peanut Separates the shell and the nut Amount of peanuts shelled per hour Availability of the energy source共s兲 identified Amount of energy required or the number of people needed to operate it Ease/feasibility of manufacture Size/portability
Specific ranges of values and criteria for rating a design for each attribute were defined on a scale from ⫺2 to +2, with zero being on par with the datum solution, ⫺2 being much worse, and +2 being much better. In order to test the reliability of the evaluation performed by the experimenter, a second mechanical engineering doctoral student with experience in the field of engineering design evaluated 25% of the designs. Inter-rater agreement3 between the two experimenters on that 25% was found to be 89.6%, which is an acceptable level to judge the quality of the evaluations as legitimate and unbiased. Noting that the y-axis shows negative quality scores, the length of the bars in Fig. 9 can 3 The inter-rater reliability calculation was done by taking the difference between the two quality ratings for each attribute, which ranged from ⫺2 to 2, and then by dividing that difference by 4 to obtain an effective “percentage” difference within the span of the scale. For example, if one rater gave a design a value of 1 and the second rater gave a design a value of 0, the percentage difference within the span of values was calculated to be 0.25, i.e., 共1 − 0兲 / 4. These values were summed across the attributes for each design evaluated and then averaged for the set of double coded designs. Finally, this value was subtracted from one to get the percent agreement, as opposed to the percent disagreement if it had not been subtracted from one.
111005-6 / Vol. 132, NOVEMBER 2010
Fig. 7 Illustration of four comparisons between individual group members and collaborative final design solution text made with LSA for one group of four participants, averaged for each writing session
Transactions of the ASME
Downloaded 03 Nov 2010 to 128.237.239.232. Redistribution subject to ASME license or copyright; see http://www.asme.org/terms/Terms_Use.cfm
Fig. 8 Average level of semantic convergence to final design solution description text; error bars show ±1 standard error Fig. 10 Energy sources for removing shell
be thought of as the degree of poor quality of the final designs. The graph shows that the good example condition had the best 共least negative兲 average quality rating 共M = −0.142兲, which was significantly different from both the control condition 共M = −2.75, p ⬍ 0.035兲 and the poor example condition 共M = −4.25, p ⬍ 0.003兲 based on the LSD post hoc comparisons of a one-way ANOVA 共F = 6.528, p ⬍ 0.008兲. The control and poor example conditions did not lead to significantly different quality ratings of the final designs produced 共p = 0.188兲. In order to examine solution quality from a different perspective, the energy sources used in the designs were tabulated. The energy sources chosen in the final design solutions can be an indicator of how well the solution fits the problem presented 共i.e., a location with limited natural resources, limited funds to pay for the device and the energy to power it, or limited skilled labor to manufacture and assemble the device兲 and, thus, perhaps how well the team members understood the constraints of the design problem before them. For this tabulation, the problem was functionally divided into two separate parts: one, removing the shell; and two, separating the shell from the nut. This metric was first used by Linsey et al. to examine fixation effects of a poor example solution 关31兴. Figures 10 and 11 show these results for part one and part two, respectively. Inter-rater agreement was calculated by double coding 25% of the designs, which was performed by two mechanical engineering doctoral students with experience in design. The percentage of agreement about whether a particular energy source was present or not was calculated for each of the designs, and the average was taken. An inter-rater agreement of 83.3% was achieved, a level that allows the judgments to be accepted as unbiased and legitimate. The control and good example condition final design solutions
Fig. 9 Average quality of final design solutions; error bars show ±1 standard error
Journal of Mechanical Design
used entirely sustainable energy sources, while the poor example condition final design solutions used a variety of different energy sources, including many that are not sustainable, such as the gas engine used in the poor example given to those teams. Clearly, sustainable energy solutions are preferred in Haiti and West African countries. A key difference between the good example solution and the poor example solution was that the good example did not include a sorting functionality, actually making the good example solution not better in all respects than the poor example solution. This perhaps complicates the quality evaluation, which includes the sorting functionality as one of the attributes on which the designs are judged. The good example condition may have a lower average quality rating than it otherwise would, due to the influence of the good example on the representation and boundaries of the design problem, which could have indicated to participants that a sorting functionality is outside the scope of the design problem since it was not included in the example. Therefore, the quality was analyzed again, eliminating the sorting functionality from the evaluation. Based on the LSD post hoc comparisons of a one-way ANOVA 共F = 7.951, p ⬍ 0.003兲, the trends remained the same, but the statistical significance level increased for the difference between the good example condition 共M = −0.857兲 and the control 共M = −3.75兲 with a new p value of 0.023; between the good ex-
Fig. 11 Energy sources for separating nut and broken shell as identified in final designs in each condition
NOVEMBER 2010, Vol. 132 / 111005-7
Downloaded 03 Nov 2010 to 128.237.239.232. Redistribution subject to ASME license or copyright; see http://www.asme.org/terms/Terms_Use.cfm
Fig. 12 Average number of features from poor example and good example included in final designs in each condition
ample condition and the poor example condition 共M = −5.5兲 with a new p value less than 0.001; and between the poor example condition and the control with a new yet still insignificant p value of 0.138. In sum, the analysis yields the same results, with amplified levels of statistical significance when the sorting functionality attribute is omitted from the quality evaluation. In addition, the sorting functionality issue raises the question of mimicry—in that, the poor example condition might have produced poor quality solutions due to mimicry of the poor qualities of the poor example, and the good example condition might have produced good quality solutions due to mimicry of the good qualities of the good example. Therefore, features and characteristics of the good example and the poor example were tabulated and examined to determine whether they were included in the final designs. The features and characteristics of the good example that were examined for mimicry included hand crank, rotating cone shape, rotational motion about a stationary axis, human powered, cast cement, and vertical axis of rotation. Those of the poor example were hopper, conveyor, collection bin, press, reciprocating motion, gas powered, and grate/sieve. Figure 12 shows the tabulation of the average number of features from the good example and poor example that were included in the final design in each condition. Inter-rater agreement was calculated by double coding 25% of the designs, again performed by two mechanical engineering doctoral students with experience in design. The percentage of agreement about whether a particular feature was present or not was calculated for each of the designs, and the average was taken. The inter-rater agreement was 85.7% for inclusion of features from the poor example and 83.3% for inclusion of features from the good example, allowing the ratings to be deemed as unbiased and acceptable. The control condition was evaluated to give a baseline reference for the frequency with which the features or characteristics would be included anyway, without exposure to any example solutions. The good example shows no apparent difference across conditions in terms of number of features included, which implies that the teams in the good example condition were not mimicking the good example features and achieving high quality through that means. These results were confirmed with LSD post hoc comparisons of a one-way ANOVA 共F = 0.22, p = 0.978兲, with no significant difference when comparing the control condition to each of the other two conditions for the average number of features included from the good example. The poor example had a more significant effect. The LSD post hoc comparisons of a one-way ANOVA 共F = 4.637, p = 0.22兲 indicated that the poor example condition 共M = 3.75兲 led to marginally significantly higher average inclusion of features than the control condition 共M = 2.5, p = 0.056兲. The good example condition and the control condition did not have significantly different average inclusions of features from the poor example. As stated previously, the full belly sheller, used as the good 111005-8 / Vol. 132, NOVEMBER 2010
example, did not include a collection bin or method of separating or sorting the nut from the broken shell, making it a “good” solution, but one with flaws and room for improvement. With this particular shortcoming in mind, along with other defining characteristics found in both the good and poor example solutions, the final designs were additionally examined to see if they included sorting functionality or a collection bin. Two mechanical engineering doctoral students with experience in design evaluated the designs and achieved 85.7% agreement on a sample of 25% of the final designs. An analysis of components and attributes of the designs highlighted three key features: the energy source tabulations 共as presented above兲, the inclusion or exclusion of a collection bin, and the inclusion or exclusion of a sorting method. All eight 共100%兲 of the final designs produced by each of the control and poor example conditions’ groups included a collection bin, while only one out of the total of seven 共14.2%兲 final designs produced by the good example condition groups included a collection bin. In addition, six out of eight 共75%兲 of the final designs produced by the groups in each of the control and poor example conditions included a grate or sieve component to achieve the sorting functionality. Only three out of seven 共42.8%兲 of the good example condition final designs included a grate or sieve component for sorting.
4
Discussion
The results demonstrate that the introduction of a poor example solution to the given design problem prior to solving correlated with a decrease in design team convergence and had a negative effect on solution quality. The groups who were given the poor example converged as a team significantly less than those who were not given any example and those who were given a good example solution. The good example condition did not produce significantly different levels of convergence over time from the control condition, but did correlate with significantly higher quality final design solutions when compared with the control condition. In general, these results indicate that introducing a poor example has a strong suppressive effect on the convergence of groups 共to one another and to their collective final design兲 during design problem solving and on final design solution quality. The introduction of the good example did not produce opposite results in levels of semantic convergence, but produced results on par with those of groups who received no example solution, although it did produce an increase in design quality. These results raise several important questions. First, why does a poor example have a different effect on the level of convergence than a good example? One possible explanation is that the poor example solution caused some individuals to fixate on parts of the solution, inhibiting them from broadly searching the design space. In addition, in the case of the poor example, some team members may have realized that the example was feasible but was not consistent with the requirements and priorities outlined in the problem statement. Less convergence can be thought of as more disagreement within a group. With some group members rejecting the poor example while potentially fixating on the feasible components of it and others potentially not realizing it is a poor example altogether, the resulting level of semantic convergence of the team would be lower. The groups given the poor example immediately became more dissimilar 共as compared with the groups given no example兲 to the given design problem text, as represented by the lower average level of semantic convergence of the design problem text to the first writing session texts. This was a relative decrease in convergence when compared with the control and good example groups, which they did not recover from over time. Though the prompt requested an account of the participants’ current best solution or solution approach, the design choices made 共i.e., the materials chosen, the appropriateness of the solution for the location and resources available, the manufacturing methods inherently necessary to fabricate the components, the general regard for Transactions of the ASME
Downloaded 03 Nov 2010 to 128.237.239.232. Redistribution subject to ASME license or copyright; see http://www.asme.org/terms/Terms_Use.cfm
the listed constraints, etc.兲 are indicative of the participants’ representation of the design problem, constraints, and customer needs as exhibited by the characteristics and features of their design and how the words they used to describe these attributes align with the problem description, as determined by the LSA space. These results indicate that the poor example caused groups to have a representation of the design problem that was different than that of groups that were given no example, and further from the representation of the design problem that was initially given to all of the groups. This could indicate that giving a poor example prior to solving 共but after an open goal is established兲 causes groups to have a negatively influenced or biased view of the design problem they are solving. Other questions that these results raise is: Why does the poor example lead to final design solutions that are only of marginally worse quality than the control condition, which saw no example solution, and why does the good example lead to significantly better final design solutions than the control condition? The solutions that were generated by the groups given the poor example and groups given no example solution were significantly worse than those produced by the groups given the good example, in that they were judged as generally less feasible, more expensive, used nonsustainable energy sources, and are harder to manufacture, less portable, and consumed more energy. Part of this result could be explained by fixation or partial fixation on aspects of the examples. Note that the full belly sheller was used as both the good example solution and the datum solution for comparison in the Pugh chart since the full belly sheller is the current best solution that exists in practice. The potential for confusion arises when the solutions produced in the good example condition are judged as high quality. It is difficult to know whether this success is the result of mimicry of, or fixation on, the given good example or the result of the ability of a good example to allow a more inspired search of the design space. To clarify this confusion, the analysis of inclusion of features from the example solutions was performed 共see Fig. 9兲, which showed that the good example condition did not include any more features from the good example than the other conditions did. This indicates that the subjects in the good example condition were unlikely to have been fixated on the features of the good example solution. However, it is interesting that the poor example condition groups did include significantly more features in solutions than the control or good example condition groups, indicating that perhaps the subjects in the poor example condition did indeed fixate on the poor example solution. These results point to a difference in the effects of a good example solution compared with a poor example solution; that is, poor example solutions may cause more fixation than good example solutions. This potential finding is open to future investigation. The good example condition did correlate with significantly improved quality of the solutions generated and resulted in an overall positive effect on the design teams. Another way to look at the fixation that may have occurred is by casting it as an artifact of the level of understanding of the design problem, its scope, constraints, and guidelines. It is interesting to note that the groups in the good example condition did not, for the most part, include a collection or sorting functionality, perhaps because the example they were given did not specifically address these functions. The control condition groups, however, did include collection and sorting functions in the final designs though they did not see any example problem encouraging or negating the necessity of these functionalities in a complete solution, nor did the problem statement or customer requirements specifically mention the need for sorting or collection. The poor example condition, similar to the control condition, caused groups to include these functions, perhaps because they were addressed in the poor example given to the groups in that condition. This effect could be judged as a form of fixation on the particular representation of the design problem. The fixation could have been caused by a misrepresentation of the problem and appropriate solutions to Journal of Mechanical Design
it. For the poor example condition groups, the misrepresentation manifested as unrealistic cost/manufacturing/sustainability/ resources. For the good example condition groups, the misrepresentation manifested through not addressing the full functionality necessary for the design to be applicable to the real world need. In this regard, the control condition groups achieved the best middle ground in that they created solutions with sustainable energy sources and addressed the unarticulated but necessary function of sorting and collection by including collection bins and sorting mechanisms in most of the designs. It is important to note that this type of fixation, combined with the fact that inclusion of sorting functionality was one of the attributes on which the designs were evaluated, could have led to artificial inflation of the quality level of the poor example condition. The secondary quality analysis, discussed in the final design quality assessment section, which did not include the sorting functionality among the quality evaluation attributes, affirmed the results with increased levels of statistical significance across the board. Perhaps the largest question that remains to be answered given these results is: Is convergence good or bad for final design solution quality, and how does that relate to example solution quality? The literature 关32,33兴 claims that divergence is good in the early stages of ideation. That may be so, but we hypothesize this to be that case when the team has a common understanding of the design problem they are solving. In that case, the design team’s understanding of the problem should be converged, even though their choice of best solution may not be. The initial assessment of the poor example influence shows that the team’s understanding of the problem is not converged initially, as compared with the good example or control conditions. As stated previously, this might be because some of the members anticipate that nonsustainable energy solutions are viable, while others do not, or because the nonsustainable energy solutions confuse them because they do not fit with the objectives of the design problem at hand. Perhaps a variety of perspectives 共divergence兲 is good early in ideation, allowing for a broad search of the design space and challenging discussion among the team members, and later, a variety of perspectives is less desired as they begin to hone in on a final design. However, as just discussed, there is a distinction between the divergence of understanding of the design problem at hand and the divergence of the choice of the best solution approach. The question of when and at what level convergence is beneficial or detrimental to solution quality remains open; what we have shown is that it is possible to track the development of convergence fairly densely in time 共what has been termed “microgenetic study” in other contexts 关34兴兲 in order to not only follow its development, but also to track the influence of environmental inputs on convergence and investigate its relation to design quality. There are other outcomes from this work, as well. This work and other research 关8–10,31兴 has clearly demonstrated that exposure to examples or hints once an open goal is established can influence solution outcome. However, this work further demonstrates that good examples can have positive correlation with solution quality. Most importantly, these results contribute to an initial exploration of the impact and power of group convergence and the larger issue of group thinking during the design process. An additional important outcome of this study is corroboration that LSA can be effective in tracking convergence with much smaller numbers of documents and text and spanning much shorter time periods than previous work has used. This opens up the potential to use the technique in laboratory settings to investigate the detailed evolution of aspects of design thinking or ideation, as was done in this study. The fact that the participants were novice designers may have had an effect on the results. It is common in mechanical engineering undergraduate education programs for example solutions to be offered to students, and these example solutions serve to teach students how to solve problems properly. In other words, more NOVEMBER 2010, Vol. 132 / 111005-9
Downloaded 03 Nov 2010 to 128.237.239.232. Redistribution subject to ASME license or copyright; see http://www.asme.org/terms/Terms_Use.cfm
often than not, the participants’ experience with example solutions has most likely been one in which they could trust the solution to be high quality and appropriate to emulate. This may have led to more mimicry of the poor example than might have happened with expert designers, who are trained to challenge and critique example solutions or similar types of materials. Similarly with the good example solution, the participants excluded sorting functionality from their designs, perhaps because it was not included in the scope of the example. This is a potential direction for the extension of this work. Another factor to consider in analyzing the design solution quality results is the solving time. The groups were given three 10 min collaborative solving sessions, after which they were directed to submit one final design solution as a group. It is possible that the teams that were exposed to the poor example could eventually catch up in the level of convergence to the other two conditions if the solving time was extended significantly. However, implications can be broached and potentially extrapolated to longer-term problem solving with regard to how the beginning of the ideation process is affected by the introduction of examples of varying quality. The results indicate that seeing a poor example solution to the design problem before starting to solve it is correlated with less initial agreement within the team regarding the best solution approach and poorer quality solutions; that a good example could be beneficial to the quality of solutions generated, though it does not necessarily correlate with the level of agreement within the team; and that this difference persists at least over the time period investigated. Further research is needed to understand how convergence might develop over a longer solving time and whether this might also affect solution quality. Additional future research on team convergence might include examining how group members influence each other’s representations 共and, more specifically, how the group members experience, recognize, and work to break fixation together兲, the effect of introducing an example solution at a different time in the group solving process 共e.g., once fixation in problem solving has occurred兲, the effect of extending the solving time by adding more sessions and/or increasing the length of the sessions, or the effect of exposure to multiple examples compared with just one.
5
Conclusions
Engineering designers are greatly affected by the information they are given at the outset of collaboratively solving a design problem. The most important implication of the study is that the introduction of any type of example solution just prior to collaborative solving does not increase team convergence 共in the case of the introduction of the good example兲,and if anything, decreases convergence 共in the case of the introduction of the poor example兲. However, the introduction of a good example solution may lead to higher quality design output. There is evidence in the literature that, generally, providing example solutions may lead groups to fixate on the representation of the design problem as framed by the example solution, causing them to include/exclude certain features or functionality in their final design that are not in line with the constraints or context of the problem simply because they were included/excluded from the example solution itself. However, it was shown in this work that exposure to a good example solution did not lead to significant mimicry of features from the example, while exposure to the poor example did lead to significantly higher inclusion of features from the example. In general, we found that convergence and its timing are significant aspects of group design, and that initial events 共here, exposure to a good or poor example兲 can be correlated with team convergence and can, perhaps independently, be correlated with the quality of the final design solution produced by the group. This work begins to explore the influence of group convergence in the design process and, in particular, the influence of examples of different qualities on these properties and outcome quality. It raises many rich ques111005-10 / Vol. 132, NOVEMBER 2010
tions regarding these issues, though further studies are necessary to fully answer these questions and determine the possible implications of this work for design practice. This research also shows that LSA is a powerful tool that is sensitive enough to detect variations in levels of semantic convergence over short periods of time and with limited information, making it more feasible to study the design process in a detailed fashion as it operates in a laboratory setting.
Acknowledgment The authors thank Dr. Julie Linsey for her comments on this work, Ian Tseng for his assistance in coding the data, and the participants in the study. This work was supported by NSF under Grant No. SBE0738058, as well as the ARCS Foundation, Pittsburgh Chapter.
References 关1兴 Ullman, D. G., 2003, The Mechanical Design Process, 3rd ed., McGraw-Hill, New York. 关2兴 Griffin, A., 1996, “PDMA Research on New Product Development Practices: Updating Trends and Benchmarking Best Practices,” J. Prod. Innovation Manage., 12共5兲, pp. 374–391. 关3兴 Dahl, D. W., and Moreao, P., 2002, “The Influence and Value of Analogical Thinking During New Product Ideation,” J. Mark. Res., 39共1兲, pp. 47–60. 关4兴 Goldschmidt, G., and Smolkov, M., 2006, “Variances in the Impact of Visual Stimuli on Design Problem Solving Performance,” Des. Stud., 27, pp. 549– 569. 关5兴 Linsey, J. S., Wood, K. L., and Markman, A. B., 2008, “Modality and Representation in Analogy,” Artif. Intell. Eng. Des. Anal. Manuf., 22, pp. 85–100. 关6兴 Christensen, B. T., and Schunn, C. D., 2005, “Spontaneous Access and Analogical Incubation Effects,” Creat. Res. J., 17共2–3兲, pp. 207–220. 关7兴 Christensen, B. T., and Schunn, C. D., 2007, “The Relationship of Analogical Distance to Analogical Function and Preinventive Structure: The Case of Engineering Design,” Mem. Cognit., 35, pp. 29–38. 关8兴 Tseng, I., Moss, J., Cagan, J., and Kotovsky, K., 2008, “The Role of Timing and Analogical Similarity in the Stimulation of Idea Generation in Design,” Des. Stud., 29, pp. 203–221. 关9兴 Moss, J., Kotovsky, K., and Cagan, J., 2007, “The Influence of Open Goals on the Acquisition of Problem-Relevant Information,” J. Exp. Psychol., 33共5兲, pp. 876–891. 关10兴 Moss, J., Cagan, J., and Kotovsky, K., 2007, “Design Ideas and Impasses: The Role of Open Goals,” ICED 07: International Conference on Engineering Design, Paris, France, August 28⫺31.114, pp. 1–10. 关11兴 Jansson, D. G., and Smith, S. M., 1991, “Design Fixation,” Des. Stud., 12, pp. 3–11. 关12兴 Smith, S. M., and Blankenship, S. E., 1991, “Incubation and the Persistence of Fixation in Problem Solving,” Am. J. Psychol., 104共1兲, pp. 61–87. 关13兴 Purcell, A. T., and Gero, J. S., 1996, “Design and Other Types of Fixation,” Des. Stud., 17, pp. 363–383. 关14兴 Chrysikou, E. G., and Weisberg, R. W., 2005, “Following the Wrong Footsteps: Fixation Effects of Pictorial Examples in a Design Problem Solving Task,” J. Exp. Psychol. Learn. Mem. Cogn., 31共5兲, pp. 1134–1148. 关15兴 Marsh, R. L., Ward, T. B., and Landau, J. D., 1999, “The Inadvertent Use of Prior Knowledge in a Generative Cognitive Task,” Mem. Cognit., 27共1兲, pp. 94–105. 关16兴 Smith, S. M., Ward, T. B., and Schumacher, J. S., 1993, “Constraining Effects of Examples in a Creative Generation Task,” Mem. Cognit., 21共6兲, pp. 837– 845. 关17兴 McComb, S. A., and Green, S. G., 1999, “Project Goals, Team Performance, and Shared Understanding,” Eng. Manage. J., 11共3兲, pp. 7–12. 关18兴 Dong, A., Hill, A. W., and Agogino, A. M., 2004, “A Document Analysis Method for Characterizing Design Team Performance,” ASME J. Mech. Des., 126, pp. 378–385. 关19兴 Dougherty, D., 1990, “Understanding New Markets for New Products,” Strategic Manage. J., 11共3兲, pp. 59–78. 关20兴 Dong, A., and Agogino, A. M., 1997, “Text Analysis for Constructing Design Representations,” Artif. Intell. Eng., 11, pp. 65–75. 关21兴 Dong, A., 2005, “The Latent Semantic Approach to Studying Design Team Communication,” Des. Stud., 26, pp. 445–461. 关22兴 Landauer, T. K., Foltz, P. W., and Laham, D., 1998, “Introduction to Latent Semantic Analysis,” Discourse Process., 25, pp. 259–284. 关23兴 Foltz, P. W., Kintsch, W., and Landauer, T. K., 1998, “The Measurement of Textual Coherence With Latent Semantic Analysis,” Discourse Process., 25共2&3兲, pp. 285–307. 关24兴 Deerwester, S., Dumais, S. T., Furnas, G. W., and Landauer, T. K., 1990, “Indexing by Latent Semantic Analysis,” J. Am. Soc. Inf. Sci. Technol., 41共6兲, pp. 391–407. 关25兴 Strait, M. J., Haynes, J. A., and Foltz, P. W., 2000, “Applications of Latent Semantic Analysis to Lessons Learned Systems,” Intelligent Lessons Learned Systems: Papers from the AAAI Workshop, D. W. Aha and R. Weber, eds., AAAI, Menlo Park, CA, pp. 51–53.
Transactions of the ASME
Downloaded 03 Nov 2010 to 128.237.239.232. Redistribution subject to ASME license or copyright; see http://www.asme.org/terms/Terms_Use.cfm
关26兴 Griffiths, T. L., Steyvers, M., and Tenenbaum, J. B., 2007, “Topics in Semantic Representation,” Psychol. Rev., 114共2兲, pp. 211–244. 关27兴 Linsey, J. S., Green, M. G., Murphy, J. T., Wood, K. L., and Markman, A. B., 2005, “Collaborating to Success: An Experimental Study of Group Idea Generation Techniques,” Proceedings of the ASME Design Theory and Methodology Conference, Long Beach, CA. 关28兴 “Think Space: Peanut Sheller,” http://www.thinkcycle.org/tc-space/ tspace?tspace_id⫽41963, accessed Jan. 2008. 关29兴 “Full Belly Project,” http://www.fullbellyproject.org, accessed Jun. 2008. 关30兴 DelHagen, W., Hussam, S., Mohdramli, R., and Yi, A., 2003, “A Low-Cost Peanut Sheller for Use in Developing Nations: Final Application for IDEAS,”
Journal of Mechanical Design
关31兴 关32兴 关33兴 关34兴
http://web.mit.edu/ideas/www/past%20 proposals/peanut.pdf, accessed Jun. 2008. Linsey, J. S., Tseng, I., Fu, K., Cagan, J., Wood, K. L., and Schunn, C. D., 2010, “A Study of Design Fixation, Its Mitigation and Perception in Design Faculty,” ASME J. Mech. Des., 132, p. 041003. Kelly, J., and Karau, S., 1999, “Group Decision Making: The Effects of Initial Preferences and Time Pressure,” Pers. Soc. Psychol. Bull., 25共11兲, pp. 1342– 1354. Osborn, A., 1957, Applied Imagination, Scribner, New York. Siegler, R. S., and Crowley, K., 1991, “The Microgenetic Method: A Means for Studying Cognitive Development,” Am. Psychol., 46共6兲, pp. 606–620.
NOVEMBER 2010, Vol. 132 / 111005-11
Downloaded 03 Nov 2010 to 128.237.239.232. Redistribution subject to ASME license or copyright; see http://www.asme.org/terms/Terms_Use.cfm