superconducting Transition Edge Sensor bolometers .... transition, the darkness corresponds to a quasi-logarithmic magnitude of the bias current through the ...
Design techniques for improved noise performance of superconducting Transition Edge Sensor bolometers J. G. Staguhn1,2, D. J. Benford1, J. A. Chervenak1, S. H. Moseley1, Jr., C. A. Allen1, R. Stevenson1, W.–T. Hsieh1,3 1 NASA/Goddard Space Flight Center, Greenbelt, MD 20771, USA 2 SSAI, 5900 Princess Garden Pkwy. Lanham, MD 20706, USA 3 Raytheon ITSS, Forbes Blvd., Lanham, MD 20706, USA ABSTRACT We have investigated the noise performance of MoAu-bilayer TES bolometers designed for infrared detectors. A set of devices with variations in geometry were fabricated at the NASA/GSFC detector development facility. These detectors have different bilayer aspect ratios and have varieties of normal metal regions deposited on top of the bilayer to study the effects of geometry on noise. These normal metal regions are oriented either parallel or transverse to the direction of current flow, or both. The lowest noise detectors are found to have normal metal regions oriented transversely. Our detectors with the most favorable design feature negligible excess noise in the in-band region, only slight excess noise in the out-of-band region, and low 1/f noise. The detectors are successfully used in the Submillimeter Broadband Spectrometer FIBRE which is used for astronomical observations at the Caltech Submillimeter Observatory. Keywords: Bolometers, TES, Fundamental noise, submillimeter Astronomy
INTRODUCTION The development of large format (>100 element) cryogenic bolometer arrays is a requirement for future astronomical imaging and low resolution spectroscopy in the far-infrared and submillimeter. Recent research has led to a new approach to building arrays of many bolometers. Instead of a semiconducting thermistor, a superconducting transition edge sensor (TES) is used to read out the detector temperature. A TES bolometer has a faster response time than an identically-designed, same-sensitivity semiconducting bolometer (or a more sensitive bolometer for the same response time) due to the strong negative electrothermal feedback intrinsic in a voltage-biased TES [1]. TES bolometers are inherently low impedance devices, so they are well matched to being read out by DC SQUID amplifiers [2]. These amplifiers have a large noise margin over the TES Johnson noise and bolometer phonon noise. This permits the bolometer to be read out in a multiplexed fashion by a suitable SQUID multiplexer [3], potentially vastly reducing the amplifier size and the wire count. In light of these advantages, we have been developing the technologies for fabricating multiplexed superconducting TES bolometer arrays. Attempts to find robust materials systems and fabrication methods for transition edge sensor (TES) microcalorimeters and bolometers have encountered differing amounts of noise magnitudes and functional dependences. The phononnoise limit predicted for TES devices has been approached for certain devices and proved elusive to other designs [4]. The approaches that have been tried include a variety of materials, geometries, and fabrication techniques [5], [6]. These have resulted in constraints on bias conditions, quantum efficiency of photon detection, etc. Ideally, the mechanisms for noise in TES bolometers will be elucidated so that, for example, an imposed geometric ordering can quell the noise sources in more of the materials, independent of deposition method, film quality, etc. A less ideal situation would be a higher degree of constraints on materials, deposition techniques, or detector geometries. In this work, we have taken a system of materials that intrinsically has a large excess noise source. We have shown that certain geometries of normal metal boundary conditions imposed on the bilayer reduce the excess noise problems. This result may be relevant to other materials systems and detector geometries.
390
Millimeter and Submillimeter Detectors for Astronomy II, edited by Jonas Zmuidzinas, Wayne S. Holland, Stafford Withington, Proceedings of SPIE Vol. 5498 (SPIE, Bellingham, WA, 2004) · 0277-786X/04/$15 · doi: 10.1117/12.552102
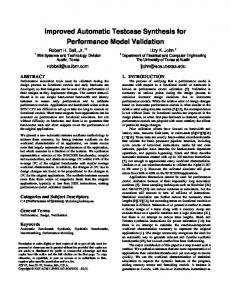
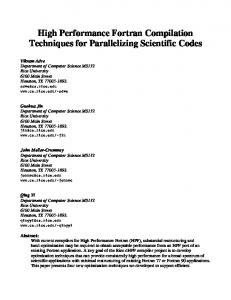
BOLOMETER DESIGN The bolometers we have produced for our performance studies are based on a linear 1x8 design, using a pop-up-detector architecture first presented elsewhere [7] (Figure 1). The TES consists of a molybdenum and gold superconducting bilayers. Each pixel has a different Au normal metal bar geometry; two different 1x8 arrays were manufactured. The thermal conductivity G of these devices was about a factor of ten higher than in those devices produced for astronomical observations. A subset of the resultant 16 geometries is shown below in Figure 2. A description of the fabrication process is given elsewhere [8].
Figure 1. Photo of single bolometer in a linear 1 by 8 array. C0R0
C1R0
C0R1
C1R1
C0R2
C1R2
C0R3
C1R3
C0R4
Figure 2. Devices tested to date, showing (L) lateral bars and (R) interdigitated transverse normal metal bars (black).
DEVICE CHARACTERIZATION Several standard measurements were used to characterize the devices. These include: a. four-wire resistance vs. temperature measurements, with variable current excitation; b. current-voltage (IV) curves, with variable base temperatures; c. complex impedance measurements, with variable bias conditions, as described by Lindeman et al. [9]; d. noise measurements, with variable bias conditions. Some representative results of these measurements are tabulated in Table 1; We show below a sample of R(T), I(V), R(V), P(V) (Figure 3). Transition sharpness a, excess thermal conductivity and excess noise for all devices are tabulated in Table 1. Devices from chip C0 have more uniformity of parameters, and sharper R(T) transitions. Devices labeled C1 have less sharp transitions and have less noise. A relation between sharpness of the transition and the amount of excess noise of TES was also observed elsewhere [10].
Proc. of SPIE Vol. 5498
391
Table 1. Summary of measurements on TES bolometers. Geometry C0R0
RN [m�]
TC [K]
a
G(TC) [W/K]
Bias Power [pW]
539
504.5
5506
0.84·10-9
61
-9
65
C0R1
419
505.8
2771
1.10·10
C0R2
500
506.0
6787
0.87·10-9
63
-9
te [ms]
Excess Noise† ~3.5 ¥ ~2.5 ¥
C0R3
422
~490
-
1.12·10
52
~2.5 ¥ ~2.5 ¥
C0R4
554
~490
-
0.92·10-9
60
~7.5 ¥
C1R0
361
-
-
-
31
-
C1R1
212
436.1
89
-
30
-
C1R2
420
445.0
148
0.44·10-9
37
�50%
C1R3
401
~435
-
0.38·10-9
35
�50%
† Excess noise is estimated maximum noise level relative to the theoretical prediction, at any frequency in the range 100Hz-25kHz.
Figure 3. Measurements of devices, illustrating parameter variations.
NORMAL METAL BAR GEOMETRIES
Figure 4.Picture of the Mo/Au TES with normal metal bars brighter at the edges along the direction of current flow. The length of the device is ~2 mm. By placing normal metal regions in the active region of the superconducting detector the boundary conditions for the superconducting order parameter can be constrained. Two ideas have circulated concerning the use of normal metal regions. NIST’s normal metal edge conditions [11] and SRON’s normal metal regions placed over the inner regions of the bilayer [12] are used to separate superconducting and normal regions. Until recently our group has used normal metal bars at the edge of the TES that are parallel to the current. The mask set used for those devices is similar to C0R2
392
Proc. of SPIE Vol. 5498
current noise density [pA/�Hz]
250
200
150
100
50
0 0
5000
10000
15000
20000
25000
Frequency [Hz]
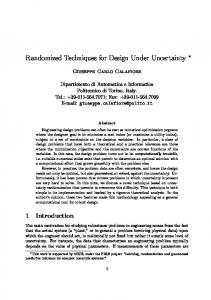
Figure 5. Measured current noise density of the bar device shown in Fig. 4. The solid lines are measurements on the transition, the darkness corresponds to a quasi-logarithmic magnitude of the bias current through the detector with TES resistance ranging from ~5 m� (dark) to ~ 300 m� (light grey). The light dashed line corresponds to the superconducting state, the dark dashed line shows the noise in the normal state.
Figure 6. Picturet of the Mo/Au TES with normal metal bars perpendicular to the current flow. The length of the device is ~2 mm.
supercond.
250
current noise density [pA/�Hz]
4 m� 8 m� 45 m�
200
120 m� 250 m� 150
normal
100
50
0 0
5000
10000
15000
20000
25000
Frequency [Hz]
Figure 7. Measured current noise density of the “modified Zebra” device shown in Fig. 6. in Figure 2. Figure 4 shows a photo of the tested device with this bar geometry. The noise measurements of the device in the superconducting state, on the transition and in normal state (the normal resistance of this device is 480 m�) are displayed in Figure 5. The significant excess in the out-of-band (> 4.5 kHz) noise in the data taken on the transition is evident. Other parameters can be found in Table 1. Figure 6 shows a photo of our “modified Zebra” (C1R2 in Figure 1) with normal metal bars oriented perpendicular to the current flow direction. The device was fabricated on the same wafer as device C0R2. A drawback of a conventional “Zebra” detector, where the normal stripes span the width of the film, is the creation of parasitic normal resistance when biased low on the transition. Our “modified Zebra” pattern has attempted to utilize the boundary conditions imposed on the interior of the superconducting region of the detector
Proc. of SPIE Vol. 5498
393
50 supercond. 45
current noise density [pA/�Hz]
4 m� 40
10 m� 54 m�
35
145 m� 30
300 m�
25
normal
20 15 10 5 0 1000
6000
11000
16000
21000
Frequency [Hz]
Figure 8. Theoretical noise of the device shown in Fig. 6. The parameters used for the calculations can be found in the text. without creating regions of parasitic normal resistance. Figure 7 shows the noise measurements for this device in the superconducting state, on the transition, and in the normal state (420 m�). A significant reduction in excess noise, particularly out-of-band noise, is observed. This indicates that the normal metal bar geometry confines regions driven normal by the bias current, and makes them sufficiently spaced to prevent interaction; hence it is an efficient method for excess noise reduction. The device shown in Figure 6 had a 400 �/square Bi film for broadband submillimeter absorption added, which did not result in the increase out-of-band excess noise. Figure 8 shows the fundamental noise expected for the device which was calculated by using the following parameters: Tbase= 300 mK, Tc= 445 mK, Rshunt = 3.7 m�, Rstray = 3.7 m�, stray inductance Lstray = 55 nH, ISQUID_noise = 6 pA/�Hz, and perfect electrothermal feedback on transition with an electrical time constant yielding a bandwidth of 6.0 kHz [13]. The excess in the measured noise of the “modified Zebra” device approaches a factor of two over the fundamental noise level only at the high resistance part of the transition where the fundamental noise of the TES is lowest.
CONCLUSION AND OUTLOOK One of the physical processes considered responsible for the creation of excess noise in TES is the random motion of superconducting and normal regions in these devices which creates a broadband noise source that appears as out-ofband excess noise. We have investigated methods for geometric ordering of the normal regions within the superconductor by means of depositing normal metal bars perpendicular to the current direction on dedicated devices. Indeed our measurements show that TES test devices with normal metal bars perpendicular to the current flow have significantly reduced excess noise as compared to devices with normal metal bars only deposited along the edges of the device. The reduction of noise goes along with a broadening of the transition, which, however, practically does not impact the performance of the TES. The new bilayer/normal metal bar design is being implemented in current and future astronomical instruments, including FIBRE [14], SPIFI [15], ZEUS [16], SAFIRE [17], and the GBT 3 mm camera [18]. We are furthermore improving our model of the tested devices by calculating the noise without the assumption of perfect electrothermal feedback on the transition close to the superconducting state. The excess noise model for the “modified Zebra” device will include a hanging heat capacity of the low Tc Mo leads (CMo/CTES ~ 0.2). The superconducting boundary condition at the edge of this device may also create some excess noise. It is likely that further improvements in the TES design will allow the production of TES devices, which will perform at the fundamental noise limit.
REFERENCES [1] [2] [3] [4]
394
K.D. Irwin, APL 66 (15), 1995, 1998 R.P. Welty & J.M. Martinis, IEEE Trans. On Applied Superconductivity 3 (1), 1993, 2605. K.D. Irwin et al., American Institute of Physics Conference Proceedings (AIP), 605, 301. J.A. Chervenak, et al., 2003 , “Absorber-Coupled Superconducting Transition Edge Sensors for Submillimeter Imaging”, in Proceedings Far-IR, Sub-mm & mm detector technology workshop, ed. Wolf, J., NASA/CP-211408.
Proc. of SPIE Vol. 5498
[5] Hoevers, H F et al., 2000, Appl. Phys. L., 2000, 77, 26, 4422. [6] J.M. Gildemeister, A.T. Lee, P.L. Richards, 2001, Applied Optics. 40, 34, 6229. [7] D.J. Benford et al., IRMMW, 21 (12), 2000, 1909. [8] J.A. Chervenak et al., 2004, Nuclear Instruments and Methods in Physics Research, Section A (NIMPA), 520, 460. [9] M. Lindeman et al., 2004RscI, 75, 1283 [10] J.N. Ullom, et al., 2004, ApPhL., 84. 4206 [11] G. Hilton et al., 2001, IEEE Appl. Supercond., 11(1), 739. [12] W.M. Bergmann Tiest et al., 2002, American Institute of Physics conference Proceedings (AIP), 605, 199. [13] D.J. Benford et al., 2004, Nuclear Instruments and Methods in Physics Research, Section A (NIMPA), 520, 270. [14] J.G. Staguhn et al., 2003, SPIE, 4855, 11. [15] M.R. Swain et al., 1998, SPIE, .3354, 480. [16] T. Nikola, et al., 2003, SPIE 4855, 88 [17] D.J. Benford, et al., 2003, SPIE, 4875, 13. [18] D.J. Benford et al., 2004, Nuclear Instruments and Methods in Physics Research, Section A (NIMPA), 520, 387
Proc. of SPIE Vol. 5498
395