ISSN (Online) : 2319 - 8753 ... Second National Conference on Trends in Automotive Parts Systems and Applications (TAPSA-2014) ... Lack of training, Lack of resources, Huge cost involvement as experts needs to be hired, Time consuming.
ISSN (Online) : 2319 - 8753 ISSN (Print) : 2347 - 6710
International Journal of Innovative Research in Science, E ngineering and Technology An ISO 3297: 2007 Certified Organization,
Volume 3, Special Issue 2, April 2014
Second National Conference on Trends in A utomotive Parts Systems and Applications (TAPSA-2014)
On 21st& 22nd March, Organized by Sri Krishna College of Engineering & Technology, Kuniamuthur, Coimbatore-641008, Tamilnadu, India
DESIGNING A METHOD FOR SOLVING QUALITY, COST & DELIVERY PROBLEM’S IN SMEs To Enable Implementation of Agile / Lean Manufacturing Mr.T.Varun Kumar1, Gopinath.K 2, Vijay Radhakrishnan.V 3 and Yasodharan.K 4 1
Research Scholar(PT), Dept. of Mechanical Engg, Roever College of Engg &Technology,Perambalur, India 2, 3, 4 P.A. College of Engg & Technology, Pollachi, India
ABSTRACT: To solve the Quality, Cost and Delivery problems prevailing in the Indian SMEs, We visited some of the companies with a feedback form and gathered the feedback from the workers and supervisors of that SME. This is to know the awareness of them about the Lean/Agile techniques. And this feedback brought into light that none of the SMEs are aware of these techniques. The main reason they are not interested in these technique is because they cannot afford to those costly methods. To solve this affordability problem we designed a Dynamic and effective tool which is affordable by everyone and easily understood even by people who has poor educational background. Our project mainly focuses on making the implementation of Agile/Lean Manufacturing System easily in SMEs. This will play a major role in increasing the quality of the products and productivity of those enterprises.
Keywords: -Small Medium Enterprise (SME), Agility, Agile Manufacturing System (AMS). 1.0 INTRODUCTION India is one of the fast developing countries in the world. Indian economy is mainly driven by small and medium scale enterprises. Most of the SMEs are owned by Indian citizens. SME sector of India is considered as the backbone of economy contributing to 45% of the industrial output, 40% of India’s exports, employing 60 million people, create 1.3 million jobs every year and produce more than 8000 quality products for the Indian and international markets. With approximately 30 million SMEs in India, 12 million people expected to join the workforce in next 3 years and the sector growing at a rate of 8% per year, Government of India is taking different measures so as to increase their competitiveness in the international market. There are several factors that have contributed towards the growth of Indian SMEs. Few of these include; funding of SMEs by local and foreign investors, the new technology that is used in the market is assisting SMEs add considerable value to their business, various trade directories and trade portals help facilitate trade between buyer and supplier and thus reducing the barrier to trade with this huge potential, backed up by strong government support; Indian SMEs continue to post their growth stories. Despite of this strong growth, there is huge potential amongst Indian SMEs that still remains untapped. Once this untapped potential becomes the source for growth of these units, there would be no stopping to India posting a GDP higher than that of US and China and becoming the world’s economic powerhouse. However, they face a huge challenge due to open economy. Higher productivity, good quality & flexibility to changing market needs are “The need of the hour” for SMEs. But usage of agile/lean manufacturing technique is not focused in SMEs. Implementation of concepts like Agile/Lean Manufacturing in SMEs lack popularity due to the following reasons. Lack of training, Lack of resources, Huge cost involvement as experts needs to be hired, Time consuming activity, Efforts loses focus due to less ROI (Return on Investment), More efforts needed for documentation & analysis.
Copyright to IJIRSET
www.ijirset.com
521
ISSN (Online) : 2319 - 8753 ISSN (Print) : 2347 - 6710
International Journal of Innovative Research in Science, E ngineering and Technology An ISO 3297: 2007 Certified Organization,
Volume 3, Special Issue 2, April 2014
Second National Conference on Trends in A utomotive Parts Systems and Applications (TAPSA-2014)
On 21st& 22nd March, Organized by Sri Krishna College of Engineering & Technology, Kuniamuthur, Coimbatore-641008, Tamilnadu, India
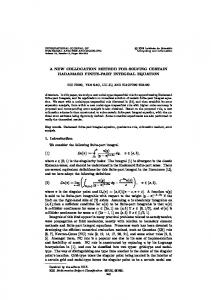
2.0 PROBLEM IDENTIFICATION We found that most of the MNC’s uses 8D methodology, 7QC tools, and six sigma, so they have a standard to implement lean / agile manufacturing in their organization. To know the awareness among employees of SMEs about these methods we prepared the feedback form and visited some of the SMEs and recognized their knowledge about these tools. And we found that some of the higher authorities in those company aware of that but low level employees/operators weren’t aware of it. Some companies have certifications due to compulsion from customers and due to requirements of system like ISO or external audit. From suggestions gathered we came to know that to create a standard in SMEs we have to adopt a tool that should be less time consuming and shouldn’t bare their resources. The barriers of using of the above tools in SMEs are listed below: 8 D method (time consuming approach) 7 QC tools (extensive documentation and statistical knowledge required) – SMEs normally can’t afford spending on experts Six Sigma approach – will be costly affair. So we design a simple and effective tool to rectify the problems faced by the SMEs and to create a Standard in their companies for implementing lean/Agile Manufacturing. 3.0 DESIGNING AN EFFFECTIVE TOOL Initially,first we have selected a particular Manufacturing Industry and then we studied the full processes in the companies. We created a tool to measure the QCDM (Quality, Cost, Delivery, and Morale) factors in a company. We designed a tool in the form of Speedometer that could be easily understandable by all the employees of the company. 3.1 QUALITY TOOL This tool denotes the quality of the company by identifying the defective parts. In consists of three colored regions namely - red, yellow, and green. The maximum number of allowable rejections taken as 100%, from 100% to 75% is taken as yellow region it is satisfactory region. From 75% to zero defects is taken as green region it is safe region. Above the 100% is taken as red region, this should me noticeable region. The numbers of products manufactured are noted down on the boxes given below the speedometer, this gives the weekly report of the product and noted in the yearly chart.The marker is marked with red region the problems are identified and denoted in list of issues chart.
Figure 3.1 Quality Tool
Copyright to IJIRSET
www.ijirset.com
522
ISSN (Online) : 2319 - 8753 ISSN (Print) : 2347 - 6710
International Journal of Innovative Research in Science, E ngineering and Technology An ISO 3297: 2007 Certified Organization,
Volume 3, Special Issue 2, April 2014
Second National Conference on Trends in A utomotive Parts Systems and Applications (TAPSA-2014)
On 21st& 22nd March, Organized by Sri Krishna College of Engineering & Technology, Kuniamuthur, Coimbatore-641008, Tamilnadu, India
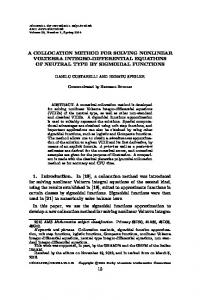
3.2 COST TOOL This tool denotes the cost of the company by identifying the cycle time to manufacture a product. Similar to the quality tool have three regions of red, yellow, and green. The allowable maximum cycle time is taken as 100% and safe, satisfactory and noticeable regions are marked similar to quality tool. The average cycle time of a product is noted down on the boxes given below the speedometer, this gives the weekly report of the product and noted in the yearly chart. The marker is marked with red region the problems are identified and denoted in list of issues chart.
Figure 3.2 Cost Tool 3.3 DELIVERY TOOL This tool denotes the delivery of the company by identifying the number of products delivered. Similar to the quality tool have three regions of red, yellow, and green. The desired number of products to be delivered is taken as 100% and safe, satisfactory and noticeable regions are marked similar to quality tool. The numbers of products delivered are noted down on the boxes given below the speedometer, this gives the weekly report of the product and noted in the yearly chart. The marker is marked with red region the problems are identified and denoted in list of issues chart.
Copyright to IJIRSET
www.ijirset.com
523
ISSN (Online) : 2319 - 8753 ISSN (Print) : 2347 - 6710
International Journal of Innovative Research in Science, E ngineering and Technology An ISO 3297: 2007 Certified Organization,
Volume 3, Special Issue 2, April 2014
Second National Conference on Trends in A utomotive Parts Systems and Applications (TAPSA-2014)
On 21st& 22nd March, Organized by Sri Krishna College of Engineering & Technology, Kuniamuthur, Coimbatore-641008, Tamilnadu, India
Figure 3.3 Delivery Tool 3.4 MORALE TOOL This tool denotes the number of suggestions given by an employee to improvise the company’s bottom line. Similar to the quality tool have three regions of red, yellow, and green. When the suggestions given by an employee is more than it is denotes as red region, because whenever there’s more suggestions it tells us there will be more problems in that company. When suggestions are less it is marked with yellow region. If there are no suggestions there will be no problems in the company and is marked in green region.
Figure 3.4 Morale Tool Copyright to IJIRSET
www.ijirset.com
524
ISSN (Online) : 2319 - 8753 ISSN (Print) : 2347 - 6710
International Journal of Innovative Research in Science, E ngineering and Technology An ISO 3297: 2007 Certified Organization,
Volume 3, Special Issue 2, April 2014
Second National Conference on Trends in A utomotive Parts Systems and Applications (TAPSA-2014)
On 21st& 22nd March, Organized by Sri Krishna College of Engineering & Technology, Kuniamuthur, Coimbatore-641008, Tamilnadu, India
4.0 DCAV CHART DCAV chart is a new type of tool which is simple and effective. It helps the small scale companies to raise their standards by proper documentation of day- to-day issues; it also makes the employees to find the core of the problems and guides the employees to communicate about the problem and to give a temporary and permanent solution to the problem. It enables the employees to be athletic in their work. The following shows the DCAV chart which gives the daily basis issues of a company.
Figure 4.1 DCAV CHART 4.1 DETECT The Detect chart is used only when any one the QCDM factors is marked with red region. Firstly, the problem is noted in the table under corresponding QCDM factor. Once the problem is detected the remaining columns are filled with respective data. 4.2 COMMUNICATE Now the problem is to be communicated and is taken to the higher officials and necessary actions are taken, from this the core of the problem is identified and is noted in the communicate column of the DCAV chart. 4.3 ANALYSIS
Then the problem is analyzed by using 5 why analysis. State the problem you have identified as a strategic problem to work Start asking “why” related to the problem. Like an inquisitive toddler, keep asking why in response to each suggested cause. Ask as many whys as you need in order to get insight at a level that can be addressed (asking five times is typical). You will know you have reached your final why because it does not make logical sense to ask why again.
Once the reason of the problem is identified immediate corrective action (ICA) is taken.
Copyright to IJIRSET
www.ijirset.com
525
ISSN (Online) : 2319 - 8753 ISSN (Print) : 2347 - 6710
International Journal of Innovative Research in Science, E ngineering and Technology An ISO 3297: 2007 Certified Organization,
Volume 3, Special Issue 2, April 2014
Second National Conference on Trends in A utomotive Parts Systems and Applications (TAPSA-2014)
On 21st& 22nd March, Organized by Sri Krishna College of Engineering & Technology, Kuniamuthur, Coimbatore-641008, Tamilnadu, India
4.4 VALIDATE To validate a problem into permanent corrective action (PCA), a brain storming session is conducted during daily meetings. Permanent solutions are implemented and verified during successive weeks. 5.0 SAFTEY CHART Safety charts are necessary for an industry to determine the safety level. Here the prescribed safety chart describes about the company’s safety level for a fiscal year. It has an “S” Shape which illustrates the number of months in a year and the boxes between the S denotes the days of the month. Whenever there’s any safety problem, it is marked in the corresponding boxes. Then the monthly box also is marked with red palette. This safety chart denotes the current safety level and it also helps to reduce the safety problems in an organization.
Figure 5.1 Safety Chart 6.0 QUALITY CHART Each organization must decide for itself how best to try to bring quality to their products. Not all firms come up with the same answer and for good reason. Firstly, there are several different ways of gaining competitive advantage. Secondly, businesses need to play to their strengths and not all businesses have the same strengths. Thirdly, many markets are segmented and what is important to one set of customers may be less important to another set. So businesses need to decide which segments of the market they are targeting. Ways of seeking to gain competitive advantage include:
offering lower prices offering clearly superior products at above average prices delivering products more quickly Offering superior customer service, including after sales service.
The 'appropriate use' quality comes from two sources. One is internal to the company. The company knows how important it is to offer optional extras, such as high quality carpeting, fitted furnishings and climate control systems to provide a quality working environment. Copyright to IJIRSET
www.ijirset.com
526
ISSN (Online) : 2319 - 8753 ISSN (Print) : 2347 - 6710
International Journal of Innovative Research in Science, E ngineering and Technology An ISO 3297: 2007 Certified Organization,
Volume 3, Special Issue 2, April 2014
Second National Conference on Trends in A utomotive Parts Systems and Applications (TAPSA-2014)
On 21st& 22nd March, Organized by Sri Krishna College of Engineering & Technology, Kuniamuthur, Coimbatore-641008, Tamilnadu, India
The other source of quality control is external e.g. national building requirements and standards. They also meet the demands of ISO 9001: Quality Management Systems. This is an internationally recognized standard which acts as a form of guarantee that everything the company does is managed to the highest quality standards.
Figure 6.1 Quality Chart 7.0 CONCLUSION AND FUTURE WORK This tool will be part of visual factory concept. It will get appreciation from customers and auditors.It requires less time and resource; Problems are communicated to appropriate levels and faster solution to problems are given. Concurrent effort along with TS/ISO requirements and ease the effort of documentation. By using this tool any small and medium Enterprises could develop their standards to implement lean/Agile manufacturing.We have now framed an effective tool to solve quality, cost, and delivery problems in SMEs. In future we going to Fix the chart and instruct employees to enter the daily report on the chart. This will show where the defects are occurred and rectifications are made as soon.
Figure 7.1QCDM measuring tool Copyright to IJIRSET
www.ijirset.com
527
ISSN (Online) : 2319 - 8753 ISSN (Print) : 2347 - 6710
International Journal of Innovative Research in Science, E ngineering and Technology An ISO 3297: 2007 Certified Organization,
Volume 3, Special Issue 2, April 2014
Second National Conference on Trends in A utomotive Parts Systems and Applications (TAPSA-2014)
On 21st& 22nd March, Organized by Sri Krishna College of Engineering & Technology, Kuniamuthur, Coimbatore-641008, Tamilnadu, India
REFERENCES 1. 2. 3. 4. 5. 6. 7. 8. 9. 10. 11. 12. 13.
ManilGogia and Dr. J.S. Oberoi, “Value Stream Mapping - An Effective Tool to Go Lean: A Case Study” International Journal of Engineering Research and Technology, 2012, ISSN 0974-3154 Volume 5, pp. 147-154. Chakravorty, S.S., 2010, An Implementation model for lean programmes, European Journal of Industrial Engineering, Vol. 4, No. 2 pp 228248. Rhonda R. Lummus, Robert J. Vokurka& Brad Rodeghiero, “Improving Quality through Value Stream Mapping: A Case Study of a Physician‟s Clinic” Journal of Total Quality Management, October 2006, Vol. 17, No. 8, 1063–1075. Rawabdab, Ibrahim A., 2005, “A Model for the Assessment of Wastes in Companies,” International Journal of Operations and Production Management, Volume 25, Issue 8 2005 Research Paper. L. and Martichenko R., (2006),“Lean Transportation Fact or Fiction”. An Executive WhitePaper. Pp2-7. Kilpatrick A.M.(1997), “Lean Manufacturing Principles”. A comprehensive framework forimproving Production Efficiency. Pp11-16. Chapman C. (2005), “Clean house with Lean 5S”. Quality Progress. Pp27-32. Sondalini M.(2011), “Concept of Total Productive Maintenance”. pp1-4. Schonberger R.J.(1982), Nancy R. Tague (2004). "Seven Basic Quality Tools". The Quality Toolbox. Milwaukee, Wisconsin: American Society for Quality. p. 15. Retrieved 2010-02-05. Imai, Masaaki (1986), Kaizen (Ky'zen), the Key to Japan's Competitive Success (1 ed.), New York: Random House, pp. 239– 240, ISBN 9780394551869, OCLC 13010323 Tennant, Geoff (2001). SIX SIGMA: SPC and TQM in Manufacturing and Services. Gower Publishing, Ltd. p. 6.ISBN 0-566-08374-4. Harry, Mikel; Schroeder, Richard (2000). Six Sigma. Random House, Inc. ISBN 0-385-49437-8. Harry, Mikel J. (1988). The Nature of six sigma quality. Rolling Meadows, Illinois: Motorola University Press. p. 25.ISBN 978-1-56946-009-2.
Copyright to IJIRSET
www.ijirset.com
528