Jl. of Technology and Teacher Education (2003) 11(4), 463-481
Designing a Technology-Based Science Lesson: Student Teachers Grapple with an Authentic Problem of Practice
SUSAN MCALEENAN BUTLER University of North Carolina-Greensboro, USA
[email protected] ERIC N. WIEBE North Carolina State University USA
This project used techniques from problem-based learning to aid students in developing a technology-based science lesson. In this case, the “problem” students were asked to solve, was that of combining curriculum knowledge and pedagogical skills to incorporate computer graphics animation technology within a science lesson and then teach the lesson to secondary students. Student artifacts as well as field notes kept by the researchers, minutes of research meetings, and written reflections from the researchers all served as data sources. Final assertions supported by the data were: (a) insufficient class time was devoted to the project, (b) lessons taught using the computer graphics technology were effective in teaching science concepts, (c) the pairing of content area specialists and graphics specialists proved to be the most successful organization for project groups, and (d) the student teachers displayed positive attitudes towards the use of multimedia presentations in the classroom. Researcher conclusions recommended the continuation of the project in an effort to increase the implementation of technology within the classroom, especially since a large majority of students showed improved achievement in science after the graphicsenhanced lessons. One important implication drawn from the project was the ability of the preservice teachers to positively influence the use of technology by the cooperating teachers.
464
Butler and Wiebe
PROBLEM-BASED LEARNING The project described in this article used techniques from problembased learning to aid students in developing a technology-based science lesson. In brief, the steps in the problem-based learning (PBL) process begin with an authentic problem. This problem is presented to students in the “meet-the-problem” documentation. The problem becomes more defined as students separate known facts about the problem topic from unknown issues and capture their thoughts on a “know/need to know” board. A problem statement or research question is then written. Data collection to illuminate unknowns begins and group analysis of these data are now incorporated into the process. After several cycles of data collection and analysis, possible solutions to the problem are formulated. The potential solutions are examined in the light of all the evidence collected and the most viable solution is then selected. The PBL experience culminates with the public sharing of the solution followed by a debriefing session (Figure 1). The university supervisor used these PBL techniques with the student teachers to support them during the design of a technology-based lesson plan. Creating lesson plans is a problematic activity for all beginning teachers who must grapple with such design problems as: ! ! ! !
What content should I teach before this topic? How long should I spend on this topic? What instructional activities will best support the teaching of this topic? How will I assess student knowledge of the topic before and after instruction?
The PBL steps provided a framework for addressing these questions and encouraged student teachers to work together to find viable answers to the design questions. In this case, the “problem” students were asked to solve, was that of combining curriculum knowledge and pedagogical skills to incorporate technology within a science lesson. PBL techniques were employed because: problems give rise to epistemic curiosity that will, in turn trigger the cognitive processes of accessing prior knowledge, establishing a problem space, searching for new information, and reconstructing information into knowledge that both fits into and shapes new mental models. In this sense, learning is not an accumulation of information, but a transformation of the individual who is moving toward full membership in the professional community” (Evensen & Hmelo, 2000, p. 4).
Designing a Technology-Based Science Lesson
465
Therefore, by giving prospective teachers a common problem of authentic practice, the instructor hoped to foster relevance of the course content and promote the professionalism of the students. Use of this PBL process is more unusual in teacher education than in other professions, according to Albion and Gibson (2000). They state “compared to other professions, PBL appears to have had relatively little impact on teacher education” (Albion & Gibson, p. 318). Therefore, while professions such as medicine, engineering, architecture, law, and business have frequently adopted PBL techniques to enhance student development of expertise within these professions, it is less common to find PBL techniques used in teacher education courses. The researchers in this project, however, believed that PBL techniques could provide the structure needed to aid student teachers in solving problems related to incorporating technology into their science lessons.
Figure 1. The process of problem-based learning
466
Butler and Wiebe
Students were required to teach a science lesson that used a Flash animation to illustrate a scientific concept. Flash software was selected chiefly because of its animation capabilities and because most students were unfamiliar with this application (as opposed to PowerPoint or some other more commonly used multimedia presentation program). The rationale for choosing such unfamiliar software was two-pronged: (a) The problem would then be more authentic to problems of practice, where teachers are asked to incorporate technology (in which they have had no previous training) into their teaching, and (b) The technological prior knowledge of each student would be approximately the same (close to nil). In this manner, the classroom problem would closely resemble an authentic task confronting many teachers, would approximate the preparedness of the teachers for implementing the task and would assure that all students began their work from a similar starting position. The use of PBL, then, was to present students with an authentic problem of practice and to give them a framework for confronting this problem. As this was the first exposure of the student teachers to PBL, writing lesson plans, and creating an animation, the instructor deemed it excessive to have students create PBL lesson plans. Rather, the students were asked to design a technology-based lesson plan in which a Flash™ animation could be used to elucidate an abstract scientific concept. RATIONALE FOR PROJECT While students now entering teacher education programs are likely to have used computers from their earliest years and possess at least basic computing skills, fewer than 25% of graduating teachers consider themselves ready to integrate technology into instruction (Handler, 1993). These new graduates join a teaching population where as few as 3% of teachers can be regarded as exemplary in their use of computers for instruction (Becker, 1994). The lack of effective modeling of technology in the classroom by the cooperating teacher has been a detriment to preservice teachers’ clinical experience (Parkinson, 1998). To combat such alarming statistics, teacher education programs have undertaken a multi-pronged approach to improving the use of technology within their curriculum. While the use of computer technology to generate text-based material for instruction is fairly commonplace, the creation of graphics-based material is less so. The inclusion of graphics in the production of instructional material elevates the instructional design process to being truly multimedia in nature. The addition of graphic media types more closely resembles the actual material being produced for use in classrooms and provides a richer
Designing a Technology-Based Science Lesson
467
cognitive apprenticeship for the learner-as-instructional designer (Liu, 1998). An additional benefit shown from these studies has been the enhanced intrinsic motivation seen in some populations of students who have responded positively to the broadened palette of mediums in which to pursue their design problem. The sophisticated nature of many computer graphics packages provide a rich and challenging medium for exploring computer technology, providing a true integration of mathematics, science, and technology (Wiebe, Clark, & Hasse, 2001). Use of computer graphic technology also has specific benefits for science education. Using graphics software for the production of instructional materials provides experiences in the representational nature of science, where students explore alternative ways of representing and communicating scientific concepts (Friedman & diSessa, 1999). Of particular importance is giving students the opportunity to not only use computer graphics as a way of interpreting empirical data, but also as an expressive medium for devising unique representations of conceptual understandings (Gordin, Edelson, & Gomez, 1996). By introducing nontrivial computer technology problem-solving activities into teacher education programs, technologically-savvy preservice teachers are in a position to make a positive impact on technology integration in the public schools. Several studies on the efficacy of such improvements to teacher education programs (Abdal-Haqq, 1995; Merkley & Schmidt, 1996; Zachariades & Roberts, 1995) have shown that “as technology is integrated into teacher education programs, preservice teachers take these innovations into our public schools where inservice teachers and their students may take part” (Roberts & Hsu, 2000, p. 135). This metaphor of preservice teacher-as-change agent was echoed by Marcovitz (1999, p. 373) who stated, “Technologically knowledgeable student teachers can provide direct support [to cooperating teachers] by being technical consultants, working on projects with students, and bringing teachers up-to-date information about the use of IT in classrooms.” Therefore, in an effort to act as advocates for the integration of technology into science classrooms, the faculty at North Carolina State University worked together to plan a sequence of technological experiences within the science education program that would enhance not only the students’ technological skills, but also the abilities needed to integrate technology into their teaching. One such technological experience was the planning and implementation of a computer graphics-based science lesson plan during the sophomore level “Introduction to Science Teaching” course.
468
Butler and Wiebe
RESEARCH FOCI The purpose of the research performed in this study was to inform future decisions concerning technological integration within the science education curriculum. Therefore, much of the research conducted in this project was evaluative in nature. That is, investigations were performed to ascertain: !
!
!
project implementation problems identified by the student teachers, cooperating teachers, and/or instructors of the “Introduction to Science Teaching” course; effectiveness of the computer graphics-based lessons in teaching science content; affective aspects of the project concerning concluding attitudes of the students towards incorporation of technology into education. PARTICIPANTS AND PROJECT DESCRIPTION
The participants in this study were all sophomore level students within a science education program who were enrolled in their first “Introduction to Science Teaching” course. Students within this course are required to attend two hours of instruction on campus each week and also to perform four hours of clinical service within a secondary science classroom each week. Within the secondary classroom, students generally work more as classroom aides than as teachers, but they do have the responsibility of teaching two lessons during the semester. One of these lessons was required to be a technology-based lesson using a computer graphics animation to teach an abstract science concept. The software used for this animation was Flash ; a professional multimedia development environment widely used for the creation of animations for web and CD-ROM based instructional materials. A further requirement mandated that the student teachers include both pre and postassessments of student learning for this lesson and videotape the lesson as it was presented. For the project, students: ! ! !
!
!
were given access to the Flash software; were assigned five Flash tutorials to complete; were given six class sessions to work on the assignment in the presence of three instructors; were provided one Saturday computer lab day with instructor support; and were encouraged to use the computer lab as needed.
Designing a Technology-Based Science Lesson
469
The project activities reflected guidance from problem-based learning techniques, to provide a structure for the student teachers to use in solving this design problem. For example, the documentation used to introduce students to the problem was a worksheet entitled “Planning for the Technology Project.” This worksheet explained the basic requirements of the project and then encouraged students to work closely with their cooperating teachers in choosing the science content to teach and in planning the lesson. Students then assembled in project teams of 2-3 students and began to discuss the assignment. A “Know/Need to Know” sheet was distributed to groups. On the “Know” side of this sheet, the instructor had listed the basic requirements for the project, including “Must use Flash , “Must create scientific visualization animation to illustrate an abstract science concept,” and “Have six class sessions to work on Flash animation.” To focus student attention on the task, the student groups were then encouraged to add to this “Know” side and to complete the “Need to Know” side. The instructor then compiled a list of frequently asked questions from the “Need to Know” side of the sheet and addressed them at the next class meeting. As students began to work on the Flash tutorials and began to actually plan their lesson presentation, the instructor of the “Introduction to Science Teaching” course as well as a science education graduate student circulated among groups to provide guidance in the areas of science content and pedagogy. Help with constructing the Flash animation was provided by the second author as well as a graduate student with strong computer graphics skills. As group work on the project continued, a “Talkback Sheet” was assigned to check the group planning process. Questions on this sheet asked students to identify the science concept or topic they planned to teach using Flash technology. The sheet also asked students to explain this scientific content (so their underlying science concepts could be verified by the science education instructor) and required students to list “key frames” of the Flash animation (so the instructors could verify the soundness of the animation strategy and could check progress on its construction). A final query on this “Talkback Sheet” asked students to identify areas of concern/frustration within the project. With the “Know/Need to Know” sheet and the “Talkback Sheet” providing structure for the problem-solving process, the student groups continued to work on solutions. They chose the science topic to teach, wrote lesson plans for the presentation, incorporated other technologies (such as embedding their animations in PowerPoint presentations), created supporting activities and worksheets for the secondary students, and identified dates and times for presentations. The groups negotiated the workload for each team member, addressed logistics of the presentation (e.g., What equipment is needed? Who will teach? Who will videotape the presentation, etc.), and then made the presentations.
470
Butler and Wiebe
(A)
(B)
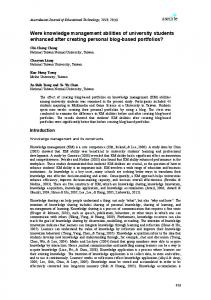
(C) Figure 2. Example screen captures from student-produced Flash animations. A) Covalent bonding, B) Cell division, C) The rock cycle
Designing a Technology-Based Science Lesson
471
Once the presentations were made, students turned in the Flash animation on a disk, a copy of their lesson plan, the videotape of the presentation, and a reflective critique of the project. Example screen captures from the Flash animations can be seen in Figure 2. In this critique, students performed a self-assessment of their contributions to the project, assessed the success of the lesson, and responded to surveys concerning personal attitudes towards information technology. DATA SOURCES ANALYSIS Fundamental data sources for this study included all teacher- or studentconstructed course-related documents and artifacts. Sample documents would include the course syllabus, completed worksheets (such as the “Planning for Technology” worksheet, the “Talkback Sheet,” the culminating reflective critique), student-constructed science lesson plans, and student requests for equipment. Student-generated artifacts would include the Flash animations and the videotapes of the lesson presentation. In addition to the data sources previously mentioned, field notes kept by the researchers, minutes of research meetings, and written reflections from the researchers and graduate students also served to enrich the investigation of the project. All data sources were analyzed by the researchers and used as the basis for assertions. These assertions were subject to revision or adaptation as more data were collected, in a process described by Huberman and Miles (1994, p. 431) as, “iterative procedure—a succession of question-andanswer cycles—that entails examining a given set of cases and then refining or modifying those cases on the basis of subsequent ones.” In this manner, the study was emergent in design, with data collection leading to assertions, leading to a further round of data collection, leading to revision/adaptation of an assertion, and so forth. The final assertions of the study arose through this continuous process of data collection and analysis. Culminating interviews with five of the participating students were used as data checks and quality controls for assertions (Guba & Lincoln, 1989). In these interviews, students responseed to and commented on assertions formulated by the researchers. The interview questions, in particular, solicited student feedback on the following topics: !
!
Technological Support: Which types of support were more useful/more used? Software Evaluation: Was Flash software appropriate for the project? User-friendly? How would you rate the utility/efficiency of Flash ?
472
!
!
!
!
Butler and Wiebe
Science Content: How was the topic for the science lesson chosen? How familiar were you with this topic? How did you prepare to teach this topic? Lesson Evaluation: How successful was the technology-based science lesson? Process Review: What are the “essential steps” in designing the animation for your presentation? Instructional Technology Attitudes: Should this project be continued? Would you use the software again? FINDINGS
As mentioned previously, assertions were generated as data were collected. Therefore, the final assertions of the study arose through a continuous process of data collection and analysis. This section of the article addresses four assertions which were eventually supported by the data and two which were refuted. Assertion One: Insufficient class time was devoted to the graphicenhanced lesson plan project.
Observations made during the pilot project and postproject surveys and interviews of selected students clearly revealed that a majority of students found the Flash project to be very challenging. With only six days allocated on the syllabus and one full day of computer lab time, 94% of student teachers felt that choosing Flash software was impractical. There was simply too much “start up” time needed. In fact, 38% of student teachers said they felt insufficient time was available to learn Flash, construct the animation, and still meet the other requirements of the course. Compressing the instruction of a complex software tool into such a short period of time led to 61% of student teachers reporting difficulty in learning Flash techniques and 22% reporting that the tutorials were not helpful in learning these techniques. For example, Molly reported: Even the tutorials were difficult…For me, the tutorials weren’t very helpful. They were difficult for me and the things that I learned in the tutorials, I wasn’t able to take them and apply them to my project… I don’t feel like I really learned how to apply it to a different situation.
Designing a Technology-Based Science Lesson
473
While the problem-based learning format for technology integration provided very specific goals for how this software was to be used in the instructional design problem, the short time span for introducing the software did not provide adequate time for students to fully appreciate the functionality and capabilities of the software and how it might be applied to solve their instructional design problem. In addition, difficulties were encountered as to how to select and/or design tutorial and instructional material for an accelerated introduction to these software tools. When faced with the task of designing an animation of a science concept, many students clearly were overwhelmed with the dual challenge of both designing an effective presentation while still attempting the master the basics of the technology. There were many instances of disconnect between what students proposed for their animation and what was possible or practical to do within the timeframe using Flash. Logistics issues also added to the challenges of this project. Restricted access to the Flash software limited the students’ ability to use the software outside of class. Twenty-two percent of the students made specific reference to the challenges of finding computers with Flash installed. Even while in class, computer technology difficulties often ate into valuable instructional time. Coupled with 50-minute class periods, this often led to only short periods of time when students could fully focus on this instructional design problem. An earlier pilot with a smaller cohort of preservice students allowed students to check out a laptop with the Flash software for the duration of the project. These students noted how valuable it was to have ready access to the software whenever they had time to work on the project and for however long they chose to work on it. Both groups of students, however, had access to laptops to take out into the public schools for their clinical experience. Partly as a result of these difficulties, only 6% of the students participating in the pilot project plan to use Flash again. This same 6% felt using Flash was worth the time spent on creating the presentation. For this small minority of students, Flash provided a powerful outlet for expressing scientific concepts. Patricia expressed this opinion as:
Yes, I think it [Flash] was really cool, and the time was worth it just to learn how to do it. I could use it for any number of other topics in science later on. Assertion Two: Lessons taught using the computer graphics technology were effective in teaching scientific concepts.
474
Butler and Wiebe
Though the process of making the Flash animation was challenging for a majority of the students, many found the technology effective in the presentation of the science topic they had chosen. A majority (59%) of the student teachers indicated that their lesson was well received, 50% of the student teachers believed Flash increased participation in the lesson, and 35% indicated that Flash was the best way to present the topic. In addition, 59% of the student teachers reported that the animations helped in making an abstract concept more concrete. Examples of comments from the student teachers included:
Patricia: My movie/animation was only 45 seconds, but for that time I had their [the secondary students’] attention…I could stand up in front of the room and dance and sing and I wouldn’t have all their attention! Molly: I did DNA replication. Flash is an excellent way to get that across. It’s hard to explain to students. You can tell them about it and tell them about it, but it’s hard for them to grasp if they can’t actually see it…When I did my assessment after I gave my presentation, I had the students write on the back of the test if they thought that the lesson was helpful and I got all positive comments; things like “this really cleared things up” or “I was actually able to see it in motion and that helped me understand the whole process.”
The use of computer graphics animations also provided an opportunity for the student teachers to reflect on the interrelationship of learning styles and instructional techniques. Many concluded that the presentation of science concepts would be enriched through the use of a variety of teaching strategies/media. This was articulated well by Steve, who stated: I’m a visual learner, so I’m all about the animations and different ways to visually present material….Seeing [static] pictures gets old. It’s like, well, what happens in-between? That’s the most important thing about Flash . You get to see what happens in-between. You see a picture of covalent bonds, like the atoms separated, [then in] the next frame you actually see them coming together. I know that when I see the “in-between” motions coming together, it really helps me remember it. I can’t take two different pictures and synthesize in my mind [what happened in between].
The use of diverse teaching strategies helped the secondary students (who were taught scientific concepts by the student teachers using the
Designing a Technology-Based Science Lesson
475
Flash-enhanced lessons) learn the material presented. In fact, according to pre and posttest data (tests given by the student teachers to the secondary students in their classes), 81% of the secondary students improved in achievement on the science topic addressed. A majority of the student teachers (76%) also reported that their secondary students met all the learning objectives outlined for the Flash presentation lesson. While this data appears overwhelmingly positive, it must be noted that the pre and posttests were constructed by the student teachers and were neither normed nor validated. The specific learning objectives were also written for each lesson and assessed by the student teachers, using individually constructed grading criteria. This study, then, does not purport to substantiate the reliability of these results. It is interesting to note, however, that the student achievement levels reported by the interns for the technology-based lesson plan were significantly higher than the student achievement levels for the traditional lesson plan. Assertion Three: The pairing of content area specialists and graphics specialists proved to be the most successful organization for project groups.
Students, by and large, worked in pairs for the creation of their Flash animations. While there was some deviation from this due to the needs of the cooperating teachers and attrition from the course, a great majority of students worked in pairs. The teams were self-selecting, with some ending up with advantageous synergies. Not surprisingly, teams that contained at least one member who had inclinations towards learning complex graphics software had more success with their final project. Molly described once such synergistic pairing: I had a partner who was really good at Flash ….So, I was able to sort of tell him what DNA replication was and what it needed to look like, and he was able to draw it and animate it. So, we made a pretty good team. I was the content specialist. I felt like I designed it and had it in my head how I wanted it to look and I was able to tell him that and he was able to do it on the computer.
This pairing of a content area specialist and visualization specialist, in fact, mimics configurations in many research organizations, where scientists work with visualization specialists and computer programmers to create graphic visualizations for inquiry and communication (Cox, 1988). Assertion Four: At the end of the course, student teachers displayed positive attitudes toward the use of multimedia presentations in the classroom.
476
Butler and Wiebe
This positive attitude was primarily demonstrated in the ending survey, where 83% of the student teachers rated the importance of the use of multimedia in the classroom between 1 and 3 on a 7 point scale (1= very important, 7 = unimportant). In addition, 94% felt that using computers in the classroom was important, relevant, and valuable, and 84% thought such computer use was needed in classrooms. The student teachers also felt that their own skills in using Flash software were increased by the project, with 78% indicating a Stage 3 level on the Stages of Adoption survey. (Stage 1 = Awareness, Stage 2 = Learning the Process, Stage 3 = Understanding and Application of the Process, Stage 4 = Familiarity and Confidence, Stage 5 = Adaptation to Other Contexts and Stage 6 = Creative Application to New Contexts.) Assertion Five: Student teachers chose science concepts to represent graphically in their lesson based upon their own interest in the subject.
This assertion was refuted by the data collected in the study. While it would have been optimal for students to be able to pick science topics that were of intrinsic interest to them and/or were concepts that they did not fully understand, the cooperating teacher’s instructional schedule usually dictated the topic chosen. In fact, 94% of the student teachers reported that they chose the topic for the lesson based upon the recommendations of the cooperating teachers. The other 6% chose topics they felt would be easy to convey with a Flash animation. Therefore no students chose topics to present based upon their own interest in the subject. Even though most of the topics were assigned to the student teachers by the cooperating teachers, 29% of the student teachers felt “confident” in teaching the subject, while only 6% reported struggling with the content. However, the majority of student teachers found that producing an animation of the science concepts challenged the depth and sophistication of their scientific knowledge. Therefore, many reported “restudying” or “researching” the topic in more depth before constructing the animation. For example, Molly stated: I had to learn more about DNA replication. I wanted to make sure that everything was scientifically correct….I had a good understanding of DNA replication, but then we wanted to show some of the enzymes and that’s what I wasn’t sure about.
Assertion Six: Challenges in teaching the graphics-enhanced lesson identified by the student teachers focused on technologyrelated concerns.
Designing a Technology-Based Science Lesson
477
Like Assertion Five, Assertion Six was refuted by the analysis of data collected in this study. Of the seven “challenges” identified by the student teachers, only two related to technology. For example, 12% of the student teachers reported problems in their ability to monitor the whole class while helping individual students with the technology. A further 6% of the student teachers expressed concerns about feeling “tied” to one area of the room by the technology they used. These student teachers did not feel free to circulate around the room. Although both these concerns related to technology, the student teachers tended to focus more on teaching behavior challenges than on technology challenges. For example, 31% of the group was concerned about the use of appropriate volume, tone, and pitch of voice in their presentations. Another 25% was primarily concerned with posing high order thinking questions to students. Three other concerns were each expressed by 19% of the student teachers. These included “teaching abstract concepts which could not be seen,” “the timing or pacing of the lesson,” and “allowing unison responses to questions.” Surprisingly, access to equipment and setting up the equipment for the presentation were not reported as challenges by any of the students. CONCLUSIONS Since the main purpose of this study was to inform future decisions concerning technological integration within the science education curriculum, conclusions from the study must reflect upon this purpose. The following bulleted list reflects “lessons learned” from this study: !
!
Project implementation problems which must be addressed in subsequent years include inadequate student access to the Flash software and to computer hardware. Additionally, the course will need to be restructured as there is presently insufficient class time available to enable students (who must learn the software application as well as use it to construct a graphic animation and then implement the graphics-enhanced science lesson) to feasibly finish the project. Finally, tutorials used in teaching students to use the Flash software need to focus more on basic rather than advanced skills. For diverse reasons, the computer graphics-based lesson was effective in teaching science content. For example, 59% of the student teachers reported that the presentation helped in making an abstract concept more concrete for students. Student interest and motivation were also
478
!
Butler and Wiebe
reported to be enhanced by the graphics-based lesson, according to 50% of the student teachers. These data provide strong arguments to continue this project, as the project activities clearly translated into enhanced motivation and scientific understanding by secondary students in science. Student teachers reported overall positive attitudes towards multimedia use in the classroom, but felt that the particular graphics software used for the project was ill-chosen. Students primarily expressed concern over the height of the learning curve for the Flash software. Therefore, before this project can be repeated either a new software application should be chosen or the project developers should restructure the Flash tutorials for more efficient learning.
The review of the goals of this project highlights a crucial disconnect between student expectations and the goal of introducing authentic technological problem-solving into preservice teacher education. Reflection on the data collected during this project indicates prevalent assumptions by the students that multimedia production using Flash or similar computer graphics animation tools are going to be an integral part of the practice of most science teachers. This assumption by the students grew from the emphasis placed on the use of the tools in this class, but is not substantiated by a review of current classroom practices. Judged on the basis as to whether preservice teachers taking this course were prepared to regularly make effective computer graphics animations for instruction when they enter professional practice, it is safe to say that this project fell short. However, judged against the goal of providing a challenging and authentic technological problem of similar scope and complexity they might face in professional practice, the project was much more successful. The project clearly provided this type of problem-solving experience and provided insight into the challenges of producing effective multimedia instructional material. One student, Molly, appropriately noted that she would like to use animations in her future teaching, but she would much rather have the textbook publisher provide the animations for her. However, knowing what goes into the production of an effective animation and how to effectively integrate it into a lesson plan became a valuable lesson in and of itself according to Lynn, who wrote: I think you should keep using Flash in [the “Introduction to Science Teaching” class]. I think we as science teachers need to be exposed to this kind of thing. If we’re not exposed to it, we don’t know what’s out there and we’re not going to know that these kinds of things are available to us. Right now, I’m thinking that there’s a lot of technology out there and I want to learn a lot of that before I leave. Also, I
Designing a Technology-Based Science Lesson
479
think if nothing else, if I never touch Flash again, I learned a lot about having to work hard and putting it all together at one time….The work that went into Flash , the work that went into getting all the information that we wanted to use in the lesson, writing the lesson plan, and learning to do that properly—it was a lot at a time, but it surely helped me to understand all the work that goes into teaching and getting into that habit of doing the work.
Overall, this project provided a glimpse at the difficulties of integrating sophisticated computer graphics tools into a preservice teacher education course. While tools such as Flash are typically taught as part of dedicated computer graphics or instructional design courses, this project explored the possibilities of providing “crash course” instruction in this technology as part of a focused, real-world problem of instructional design. The results revealed a need for careful, considered integration of the technology, and continued refinement as to how such tools can be used in preservice teacher education. Outcomes of this project did, however, provide glimpses as to how such tools and techniques were achieving the goals outlined earlier in the article. A minority of students found this experience provided a truly unique approach to technological problem-solving. These students concluded that computer-graphics tools such as Flash were a powerful expressive medium for teaching science concepts and that their experiences in the class provided them with an enhanced toolkit of technology to take with them into the classroom after graduation. IMPLICATIONS AND RECOMMENDATIONS FOR FURTHER RESEARCH Like Marcovitz’ study (1999), this research project found that preservice teachers could act as change agents in respect to the use of technology in classrooms. While some cooperating teachers expressed general disinterest in the project, others were energized by the introduction of new technologies into their classroom. One student particularly noted her cooperating teacher’s reaction to the project: I have a better appreciation now for what software like this can do. I think my teacher does too. As soon as I did my presentation, she began pulling out CDs and software that came with her book that she had never used before and showing things like that to the students to supplement her instruction, too. She saw how well the students responded to what I did.
480
Butler and Wiebe
This comment is powerful in that it shows the extent to which the preservice teachers can influence the teaching done by the cooperating teachers. While not all aspects of this project proved successful, the researchers strongly believe that the study did expose both preservice and inservice teachers to opportunities for enhancing teaching through the use of technology. This study reported enhancement of student achievement, interest, and motivation when graphics-based lessons were incorporated into the science curriculum. Follow-up studies should continue to track the effect of technology use on these parameters. In addition, textbook publishers may wish to increase the number of available animations to support concepts covered in the texts, so that abstract scientific concepts become more accessible to a broad range of learning styles. The problem-based learning steps lent support to the student teachers as they were struggling to solve authentic problems of teacher practice: writing effective lesson plans and incorporating technology into these plans. However, the PBL process was not internalized by these student teachers to such an extent that the lessons they created stressed problem-solving techniques. Therefore, a further study is warranted to examine how best to encourage student teachers to use such alternative teaching strategies as PBL within their own lessons. References Abdal-Haqq, I. (1995). Infusing technology into preservice teacher education. Washington, DC: Eric Clearinghouse on Teaching and Teacher Education. (ERIC Document Reproduction Service No. ED 389 699) Albion, P.R., & Gibson, I.W. (2000). Problem-based learning as a multimedia design framework in teacher education. Journal of Technology and Teacher Education, 8(4), 315-326. Becker, H.J. (1994). How exemplary computer-using teachers differ from other teachers: Implications for realizing the potential of computers in schools. Journal of Research on Computing in Education, 26(3), 291-321. Cox, D.J. (1988). Using the supercomputer to visualize higher dimensions: an artist’s contribution to scientific visualization. Leonardo, 21(3), 233-242. Evensen, D.H., & Hmelo, C. (2000). Problem-based learning: A research perspective on learning interactions. Mahwah, NJ: Lawrence Erlbaum. Friedman, J.S., & diSessa, A.A. (1999). What students should know about technology: The case of scientific visualization. Journal of Science Education and Technology, 8(3), 175-195.
Designing a Technology-Based Science Lesson
481
Gordin, D.N., Edelson, D.C., & Gomez, L.M. (1996). Scientific visualization as an interpretive and expressive medium. In D.C. Edelson & E.A. Domeshek (Eds.), Proceedings of the Second International Conference on the Learning Sciences, (pp. 409-414). Charlottesville, VA: Association for the Advancement of Computing in Education. Guba, E.G., & Lincoln, Y.S. (1989). Fourth generation evaluation. Newbury Park, CA: Sage. Handler, M.G. (1993). Preparing new teachers to use computer technology: perceptions and suggestions for teacher educators. Computers and Education, 20(2), 147-156. Huberman, A.M., & Miles, M.B. (1994). Data management and analysis methods. In N.K. Denzin & Y.S. Lincoln (Eds.), Handbook of qualitative research, (pp. 428-444). Thousand Oaks, CA: Sage. Liu, M. (1998). A study of engaging high-school students as multimedia designers in a cognitive apprenticeship-style learning environment. Computers in Human Behavior, 14(3), 387-415. Marcovitz, D.M. (1999). Support for information technology in schools: The roles of student teachers. Journal of Information Technology for Teacher Education, 8(3), 361-374. Merkley, D., & Schmidt, D. (1996). Integrating computer tool software into a preservice reading methodology course. Journal of Computing in Teacher Education, 13(1), 21-26. Parkinson, J. (1998). The difficulties in developing information technology competencies with student science teachers. Research in Science and Technological Education, 16(1), 67-78. Roberts, S.K., & Hsu, Y-S. (2000). The tools of teacher education: Preservice teachers’ use of technology to create instructional materials. Journal of Technology and Teacher Education, 8(2), 133-152. Wiebe, E.N., Clark, A.C., & Hasse, E.V. (2001). Scientific visualization: Linking science and technology education through graphic communications. Journal of Design and Technology Education, 6(1), 40-47. Zachariades, I., & Roberts, S.K. (1995). A collaborative approach to helping teacher education faculty model technology integration in their courses: An informal case. Journal of Technology and Teacher Education, 3(4), 351-357.
Acknowledgement The authors wish to acknowledge funding support for this study from a US Department of Education PT3 grant.