applications, it was expected that any measures developed might have .... used with 53 children aged 8, 9, and 10 who were taking part in a web design day. In.
Endurability, Engagement and Expectations: Measuring Children’s Fun Janet Read, Stuart MacFarlane, Chris Casey Department of Computing, University of Central Lancashire Preston, PR1 2HE, United Kingdom {jcread, sjmacfarlane, ccasey}@uclan.ac.uk
Abstract. This paper describes a toolkit for measuring fun with children aged between 5 and 10. The relationship of fun to usability is discussed and three dimensions of fun; Endurability, Engagement, and Expectations are described. A set of tools that can be used in empirical studies to measure these dimensions of fun is described in detail. These tools include a Smileyometer, a Fun-Sorter and an AgainAgain table. Three user trials, in which the tools have been used, are described and suggestions are made for the use of each of the tools with children. A discussion of the efficacy of the tools presents the findings that there is a sufficient subset that can be used to give a reliable measure of fun. Dependent on the nature of the event being evaluated and on the number of activities being compared; the subset will be differently constructed. The paper concludes with observations about the difficulties of measuring fun with children, and some areas for further work are presented.
1. Introduction This study was initially motivated by a desire to measure the usability of a novel interface that was being designed for children. In recent years, the usability of children’s products has become an area of growing interest. Work by Hanna, Risden, & Alexander, (1997) produced a set of guidelines for usability testing with children that incorporated general advice on the operation of usability studies and also gave some advice on measuring the engagement of the children by observing them at the computer. Later work described a range of techniques for usability research with children (Hanna, Risden, Czerwinski, & Alexander, 1999). These techniques included iterative laboratory tests and longitudinal tests that incorporated questionnaires that were given to the children to complete. More recently, Donker & Markopoulos, (2001) have investigated the use of thinking aloud, interviewing, and questionnaires as usability evaluation methods for children. Usability is a term that has historically been linked to work systems, (Dowell & Long, 1998) and the metrics that are used to measure it reflect this. User satisfaction, system effectiveness, and systems efficiency are all used to derive a usability score. Systems that are designed for entertainment, and systems that are designed for children, do not neatly fall into this usability paradigm. Children are not the same as adults, their motivations are different, and they have different desires and expectations. In 1999, Druin et al stressed that children have their own environments that adult researchers need to understand. This is not only essential when we design for children, it is also important when we use children to evaluate products.
Fun is a concept that seems to comfortably belong in a child’s environment. Although it is not a usability metric, fun may be a requirement for a product and it may also be a useful description of a user’s experience. There are systems, including games and edutainment products for which fun is a software requirement (Draper, 1999). In this respect, fun is a parallel feature to usability. Just as a user will find a product usable, so he may find it to be fun. In the same way, a product can be designed to be usable, and it can be designed to be fun. There has been some interest in measuring fun, both at the system and at the user end of an interaction. In much the same way that a predictive usability evaluation can be made of a system, heuristics have been developed to determine how much fun a system may be (Malone & Lepper, 1987). Recent work by Kersten-Tsilkalkina & Bekker, (2001) compared cooperative evaluation and co-discovery evaluation as means of assessing the usability of children’s products in which fun was a requirement. This paper presents a ‘toolkit’ for measuring fun with young children. It begins with a summary of the background research that informed the development of the tools, and then goes on to describe each tool. A series of user trials, in which the tools were used, are then outlined. A discussion of the results of the user trials is followed by the conclusion and some ideas for further work. 2. Designing the Fun ‘Toolkit’ The intention in this study was to design some metrics that could be used for the empirical evaluation of fun; with this as the focus, the tools were required to ‘elicit’ the amount of fun that was experienced by a child having participated in an event. Although the motivation was to build tools that could be used with computer applications, it was expected that any measures developed might have multiple uses. It was postulated that satisfaction theory might inform the design of the tools. The rationale for this was that for children, fun is one manifestation of what adults call satisfaction. It would seem entirely inappropriate to ask a young child to say how satisfied he or she was with a product. The question, ‘How much fun was it?’ seems to naturally fit the child’s environment. The authors recognise that Fun is much more than a child’s expression of satisfaction, but a discussion of optimal experiences and flow theory is beyond the scope of this paper. Expectancy theory suggests that satisfaction is a judgement based on the effects of expectations, performance, and disconfirmation (Oliver & Burke, 1999. Henry & Stone, 1995, Bandura, 1986, Chin & Lee, 2000). The‘Pollyanna Principle’ can be used to describe the feature by which we are more likely to remember pleasurable than nonpleasurable experiences (Matlin and Stang, 1978). In the HCI field, Whiteside, Bennett, & Holtzblatt, (1988) suggested that user satisfaction could be measured by scoring the frequency of help and documentation use, the per cent of favourable / unfavourable user comments, the number of good and bad features recalled by users, and the number of times the user expresses frustration or satisfaction. Measuring fun may be particularly problematic in cases where the interface is enchanting (Gell, 1992), or the user is easily enchanted. This is the often the case when children are interacting with technology.
3. Three Dimensions of Fun As an experience that the user has of a system, fun can be considered to have three dimensions. These dimensions have been previously identified as Expectations, Engagement, and Endurability (Read & MacFarlane, 2000). These dimensions are derived from expectancy theory, user expression of frustration / satisfaction and the Pollyanna principle. 3.1 Expectations
The term expectation is used in this context to describe the fun that is attached to an event, and the fun as it is affected by the prior expectations of the user. There are two components that are needed in this case; these are measures of the predicted and the reported experience. It is the difference between these that is particularly interesting. If we have high expectations and an event is subsequently perceived to be dull, then we feel let down; however, if our expectations are low and we perceive the event to be satisfactory, we are probably reasonably happy. The same tools can be used to measure both predicted and reported fun. For predicted fun, all that is needed is a different wording; viz. ‘How much fun will this be?’ Rather than ‘How much fun was that?’ Three tools have been developed to measure expectations. 3.1.1 The Funometer
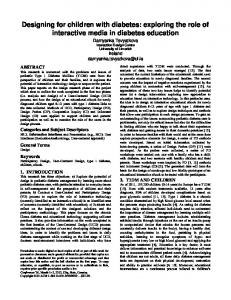
This was essentially the ‘Funometer’ as developed by Risden, Hanna, & Kanerva, (1997). This tool has a vertical scale, which has been designed to simulate a thermometer, and which the children would use in a similar way, with a vertical bar representing the amount of fun. Figure 1 shows two funometers, one that is awaiting completion, and one that has been completed.
Figure 1 The Funometer – before and after completion
3.1.2 The Smileyometer
This discrete variation of the Funometer was designed with the help of some children. It is based on a 1-5 Likert scale, and uses pictorial representations that the children contributed. This child intervention proved to be very informative. The researcher had supposed that the neutral state would have a face with a straight-line mouth. The children, who reported that this presentation would depict anger, did not like this, and they suggested a weak smile. It was also interesting to note that the researcher had considered faces with two smiles or two frowns for the extremes, but the children just wanted bigger examples of the mouth articulations. Words were added to the faces, and the faces were presented in a horizontal row. Children were asked to tick one face.
Figure 2 The Smileyometer 3.1.3 The Fun-Sorter
There are instances where the desire is to rank a series of connected activities, in order to establish which may be more appealing or which may be least fun. For this scenario, we use the term comparative fun. This is a practical rather than an absolute definition, as it is apparent that a non-comparative measure of fun will always be made with reference to any earlier similar experience that the user has had. In this taxonomy, the term comparative implies that there is a necessity put upon the user to make a comparison. That is, it is forced by the design of the measure. Repeated instances of the Funometer and the Smileyometer could be used to measure comparative fun. A variation on a repertory grid test (Fransella & Bannister, 1977) was devised to encourage children to ‘order’ activities. This Fun-Sorter has one or more constructs and a divided line (or table) that has as many spaces in it as there are activities to be compared. The children either write the activities in the spaces, or for younger children, picture cards can be made and placed on the empty grid.
Figure 3 – A partially completed Fun-Sorter, for 4 activities and with 3 constructs
3.2 Engagement
Engagement is a useful dimension of fun as an onlooker can observe it. This allows for some consistency across a user trial, as the observer is setting the parameters by which observations are graded. Observing children can be very difficult and time consuming. Video footage can be used but this can be intrusive. Hidden cameras and multiple angles are difficult to set up in a school classroom, and bringing the child to a usability lab will change the nature of the trial. Children may move out of the line of vision of the camera or the hardware may fail. It is sometimes less intrusive for the researcher to ‘jot down’ observations as they happen but this carries the risk that the researcher may fail to see things. It is, of course, possible to also miss things when using video footage, but this can be minimised by using multiple observees or by one observer making multiple observations. In addition to the researcher ‘missing’ things, the actions of the child may be mis-interpreted. Despite these limitations, it still seems useful to log actions and to attempt to interpret them in some way. Hanna et al., (1997) used observations to gauge how much children liked a product. They suggested that observed frowns and yawns were more reliable indicators than children’s responses to questions. The authors have measured engagement using video footage that was scored with reference to a set of positive and negative instantiations. The positive instantiations that were looked for were smiles, laughing, concentration signs (fingers in mouth, tongue out) excitable bouncing, and positive vocalization. Negative instantiations were frowns, signs of boredom (ear playing, fiddling) shrugs, and negative vocal instantiation. 3.3 Endurability
There are two facets to endurability. The first is related to the Pollyanna principle, that is, our likelihood to remember things that we have enjoyed. This facet might be termed remembrance. The other is that there is a desire to do again an activity that has been fun. This could be described as ‘returnance’. Two very simple tools were developed to measure these facets. Remembrance is only relevant in a comparative fun study. At some time after the event, children can be asked to list the activities that they have remembered. This was effected by offering a blank sheet of paper with the prompt ‘What did we do?’ on the top of the page. 3.3.1 Again-Again Table
‘Returnance’ has been measured using a simple Again-Again Table. This table lists the activities on the left hand side, and has three columns headed Yes, Maybe, and No. The child ticks either yes, maybe or no for each activity, having in each case considered the question ‘Would you like to do this again?’
Figure 4 – Part of an Again – Again table
4. Evaluating the tools These tools have been tested on three occasions. The first occasion was with 16 children aged 6 – 9 who were each presented with four different computer input methods to evaluate. In the second trial, 45 children aged 7 and 8 used some of the measures to provide feedback from an educational trip. Recently, the measures were used with 53 children aged 8, 9, and 10 who were taking part in a web design day. In each instance, the intention has been to validate, improve, or dismiss measures as appropriate. 4.1 The First Trial – (Engagement and Expectations)
This trial was part of an experimental study that was evaluating the usability of novel input methods for children. Each child in the trial carried out four different tasks, and they were then asked about their experiences. The tasks were presented in different orders for each child, and the child worked in their own school library with the researcher. This study was written up in Read, MacFarlane, & Casey, (2001b) As this was the first trial, a range of methods was used to measure expectations. The Smileyometer was used before, and then directly after, the child did each task. Over the two uses, 84% of children picked ‘Brilliant’. After the child had completed all four tasks, they were presented with four identical funometers alongside each other, and were asked to fill in one funometer for each task. It was observed that children using the set of funometers were not very discriminating – more often giving the same score to each task than giving different scores. The Fun-Sorter was used to compare the four methods under consideration. The constructs for this grid had been elicited from children who had initially been presented with some ‘adult’ constructs. This was quite difficult for the children with the result that some constructs turned out to be quite similar. In this trial, the constructs used were ‘Worked the best’, ‘Liked the most’, ‘Most Fun’, and ‘Easiest to use’. Completion of the grid was made easy for the children by presenting them with pictures that represented the four tasks on small pieces of card and asking them to lay the cards on an empty grid. Some children (who were generally older) were able to apply more sophisticated thought processes than others and could discriminate between ‘ease of use’ and ‘most fun’ for instance. Younger children were seen wanting the four rows on the grid to match up; that is making one task score ‘best’ on all four constructs. Two children were seen shifting cards around when it appeared that one task was ‘doing badly’ on all constructs; they reported feeling sorry for that task! Having cards for the children to manipulate made this ‘editable’ by the children, but there was extra work for
the researcher, who had to copy the results onto a paper record! The children found the Fun-Sorter easy to use. Engagement was measured by using observational data from video recordings. Positive scores were attributed to positive instantiations, and negative scores to negative instantiations. Generally, watching the children, more fun instances than negative instances were observed. The observational date was not very informative. Some children were more animated than others and the tasks that the children were carrying out in the trial allowed different sorts of animation. For instance, one task involved the use of speech input and so in this event, spoken utterances were not an option. Endurability was not measured in the first trial. 4.2 The Second Trial – (Expectations and Endurability)
The second trial involved a group of 45 children who were going on a school trip to a themed tourist attraction (Read, MacFarlane, & Casey, 2001a). At the tourist attraction, there were nine activities for the children. Examples of these were ‘U-boat’, ‘Puppet show’, and ‘lunch’. For this event, the Smileyometer and the Fun-Sorter were both used to measure expectations. The Smileyometer was used before and after the event. In this instance, 59% of the children gave a ‘Brilliant’ all the way rating: that is ‘Brilliant before, brilliant afterwards’. It was interesting to note that 76% of the children got exactly what they expected and a further 20% changed their position on the Smileyometer by just one place. This indicated that 96% of the children got almost what they expected! The children helped to design a Fun-Sorter with two constructs, these being ‘most fun’ and ‘most interesting’. A printed list of the day’s activities was provided for the children and they wrote these on a prepared empty Grid. In this trial, there were nine different activities (compared to four in the first) to place on the grid. This seemed to affect the completion of the grid. It was noted that children filled in the grid in one of two ways. Some children scanned the printed list and placed activities on the grid starting with the ‘most fun’ and then filling the spaces from the top-down. Other children scanned the printed list and placed activities at the top or bottom of the grid, thus moving towards the middle. Some of the top-downers gave up before they got to the bottom and some of the topbottom fillers got fed up before they got to the middle! This resulted in a number of incomplete grids, although the best choices were recorded in all cases. There was evidence of some lack of discrimination with some of the children as they applied the same strategy that had been seen in the first trial; that is, they filled in the ‘Fun’ and the ‘Interesting’ columns in the same order. It was not possible to measure Engagement in this trial but Endurability was measured. An Again-Again table was presented to the children and in response to ‘Would you like to do it again?’ children ticked ‘yes, maybe, no’ for each activity on the list. This worked quite well; children were able to make decisions and seemed to understand what was going on. A week after the task, children were asked to recall the separate activities that had made up the event. They were also asked to name the activity that they had liked the best. 81% recalled the activity that they had previously identified as liking
best, and 63% said that the activity they had liked the best was the same activity that they had identified as liking the best directly after the event. 4.3 The Third Trial - (Expectations)
A group of 53 children were participating in a web site design project and this was used for the third trial. These children were aged between 8 and 10. For this event, comparative fun measures were not taken, as the event did not break up into discrete and separable activities that could be compared. It was decided to use this event to test a hypothesis that had been formed after the second trial, that being that when children were asked about an event they generally reported the amount of fun that they had expected to have before the event. The Smileyometer was used before and after the event to measure Expectations, and in this instance, fifty matched replies were elicited, covering two age groups. (3 children missed either the before or the after and so were not counted). As in the previous two trials, brilliant all the way scored highly (58%), and again, very few children (16%) moved more than a point from where they had begun. Numbers 1 to 5 were attached to the smileys and it was interesting to note that the average expectation score for the 9/10 year olds was significantly lower than the average score for the 8/9 year olds (3.7 to 4.4). This was not surprising, but it did demonstrate that the Smileyometer was possibly useful to demonstrate the onset of cynicism as children approached their early teenage years! 5. Discussion of the Toolkit It seems that the Funometer may be more useful with older children. It was a mistake to present a row of these on a page, particularly for use with young children. The Smileyometer was very easy to use, and the faces that have been presented are acceptable to children. In the first trial, results from the ‘Funometer’ and the ‘Smileyometer’ were similar (N= 48, t = 0.99). This seems to indicate that one or the other but not both is needed. If either of these two tools is being used to compare activities, it is probably sensible to present one activity at a time in order to assist the child in discrimination. The Fun-Sorter seems to be most useful when comparing the relative merits of small numbers of activities (nine was probably too many in Trial 2). If only one construct is offered it could probably be used with young children particularly if picture cards are used to make the completion easy. Given the difficulties that children may have with understanding constructs; it is important to describe these things using words and phrases that they know. The Again-Again table gave results that were very similar to the Fun-Sorter. This suggests that it is fine to use just one of these two measures. Interestingly, children did not seem to feel the need to play fair on the Again-Again table, this may have been because it was about them and not about the activities; that is, the emphasis was different. This seems to indicate that one Again-Again table can be used to evaluate a number of activities. Where a large number of activities are being compared, the Again-Again table may be more useful than the Fun-Sorter. The advantage that the Fun-Sorter has is that it can be adapted to elicit other information, for instance how interesting or how easy an activity is, by adding relevant constructs.
It would seem that observations may be useful for comparative fun, less so for absolute fun. Comparing the experiences of children who are working on one task with one another is problematic due to their differing animation. For one child, carrying out multiple activities, observational data may be quite valuable, in these circumstances, it is important to ensure that all the activities being presented offer the same opportunity for each of the positive and negative instantiations that are being recorded. A sufficient measuring-fun toolkit would therefore include the Smileyometer or the Funometer; an Again-Again table or a Fun-Sorter together with observations (where appropriate) and remembrance metrics. 6. Conclusion The ‘Fun measures’ have proved easy for the children to use and they have been used in different situations to measure one or more of the fun dimensions. These measures have not been compared with traditional metrics, and this is an area that could be examined further. The three trials that have been used to test the ‘Fun measures’ to date have proved useful. The tendency of the children to record events as ‘Brilliant’ cannot be explained, but is clearly very important. On strong motive for including observational data is that it may help discriminate between activities when the children find it hard. It is also important to note the findings relating to the desire on the part of the children to ensure ‘Fair Play’. These two traits seem to be common among children but it is likely, as demonstrated in Trial 3, that there comes a time when these traits become less pronounced as the children become ‘adult-like’ in their perceptions and views. The difficulties that the younger children had with understanding and differentiating between constructs is also likely to change with maturity; although this is probably more ‘knowledge dependent ’ than the changes in the children’s perceptions which impinge on the Smileyometer scores. The discovery in the second and third trial that children got what they expected suggests that fun measures could almost be carried out before an event took place! Whilst this may appear nonsensical, further work using the metrics with less attractive events needs to be done to establish if this is always the case. It is possible that the child’s perception of the fun they experience is governed by their expectations; in which case, the design of an interface is of much less importance than the ‘advertising and promotion’ that precedes the child’s experience of it. These tools will continue to be used and validated and future work in the area of Children and Fun will focus on the relationship between fun and usability, and the features that make interfaces fun for children. References Bandura, A. (1986). Social Foundations of Thought and Action: A Social Cognitive Theory. Chin, W. W., & Lee, M. K. O. (2000). A Proposed model and measurement instrument for the formation of IS satisfaction: The case of end-user computing satisfaction. ICIS, New Orleans.
Donker, A., & Markopoulos, P. (2001). Assessing the effectiveness of usability evaluation methods for children. PC-HCI2001, Patras, Greece. Dowell, J., & Long, J. (1998). A conception of the Cognitive Engineering design problem. Ergonomics, 41(2), 126 - 139. Draper, S. W. (1999). Analysing fun as a candidate software requirement. Personal technology, 3(1), 1 -6. Druin, A., Bederson, B., Boltman, A., Miura, A., Knotts-Callaghan, D., & Platt, M. (1999). Children as our technology design partners. In A. Druin (Ed.), The Design of Children's technology (pp. 51 - 72). San Francisco, CA: Morgan Kaufmann. Fransella, F., & Bannister, D. (1977). A manual for repertory grid technique. London: Academic Press. Gell, A. (1992). The technology of Enchantment and the enchantment of technology. In J. Coote & A. Shelton (Eds.), Anthropology, Art and Aesthetics. Oxford: Clarendon Press. Hanna, E., Risden, K., Czerwinski, M., & Alexander, K., J. (1999). The Role of Usability Research in Designing Children's Computer Products. In A. Druin (Ed.), The Design of Children's Technology (pp. 4-26). San Francisco: Morgan Kaufmann. Hanna, L., Risden, K., & Alexander, K., J. (1997). Guidelines for usability testing with children. Interactions, 1997(5), 9-14. Henry, J. W., & Stone, R. W. (1995). The Impacts of End-User Gender, Education, Performance, and System Use on Computer Self-Efficacy and Outcome Expectancy. Kersten-Tsilkalkina, M., & Bekker, M. (2001). Evaluating usability and pleasure of children's products. International Conference on Affective Human Factors Design, Singapore. Malone, T. W., & Lepper, M. R. (1987). Making learning fun: A taxonomy of intrinsic motivations for learning. In R. E. Snow & M. J. Farr (Eds.), Aptitude, Learning and instruction. Hillsdale, NJ: Erlbaum. Oliver, R. L., & Burke, R. R. (1999). Expectation Processes in Satisfaction Formation. Journal of Service Research, 1(3), 196 - 214. Read, J. C., & MacFarlane, S. J. (2000). Measuring Fun. Computers and Fun 3, York, England. Read, J. C., MacFarlane, S. J., & Casey, C. (2001a). Expectations and Endurability Measuring Fun. Computers and Fun 4, York, England. Read, J. C., MacFarlane, S. J., & Casey, C. (2001b). Measuring the Usability of Text Input Methods for Children. HCI2001, Lille, France. Risden, K., Hanna, E., & Kanerva, A. (1997). Dimensions of intrinsic motivation in children's favorite computer activities. Society for Research in Child Development, Washington, DC. Whiteside, J., Bennett, J., & Holtzblatt, K. (1988). Usability engineering: Our experience and evolution. In M. Helander (Ed.), Handbook of Human-Computer Interaction. Amsterdam: North-Holland.