Holland. Switzerland. Luxemburg. Danemark. Eire. Austria. England. Germany. France ... Netherlands. Belgium ..... 25] M. Stonebraker, J. Frew, and J. Dozier.
INTERNATIONAL COMPUTER SCIENCE INSTITUTE 1947 Center St. � Suite 600 � Berkeley, California 94704-1198 � (510) 643-9153 � FAX (510) 643-7684
I
Designing and Integrating User Interfaces of Geographic Database Applications Agn�es Voisard� TR-94-015 March 1994
Abstract
In this paper, we investigate the problem of designing graphical geographic database user interfaces (GDUIs) and of integrating them into a database management system (DBMS). Geographic applications may vary widely but they all have common aspects due to the spatial component of their data: Geographic data are not standard data and they require appropriate tools for (i) editing them (i.e., display and modify) and (ii) querying them. The conceptual problems encountered in designing GDUIs are partly due to the merger of two independent elds, geographic DBMSs on the one hand, and graphical user interfaces (GUIs) on the other hand. Although these areas have evolved considerably during the past ten years, only little e�ort has been made to understand the problems of connecting them in order to e�ciently manipulate geographic data on a display. This issue raises the general problem of coupling a DBMS with specialized modules (in particular, the problem of strong vs. weak integration), and more generally of the role of a DBMS in a speci c application. After giving the functionalities that a GDUI should provide, we study the possible conceptual integrations between a GUI and a DBMS. Finally, a map editing model as well as a general and modular GDUI architecture are presented.
�
A previous version of this paper has been accepted for presentation at AVI'94, Bari, Italy, June 1994.
ii
Contents
1 Introduction 2 Map Editing and Querying Requirements 2.1 2.2 2.3 2.4 2.5
Map Display : : : : : : : : : : : : : : : : Basic Functionalities : : : : : : : : : : : : Visual Aspects : : : : : : : : : : : : : : : Windows and Interaction with End-Users Interaction with a Database : : : : : : : :
: : : : :
: : : : :
: : : : :
: : : : :
: : : : :
: : : : :
: : : : :
: : : : :
3 Strong vs. Weak Integration: Two Design Approaches 3.1 Connecting an External Module to a DBMS : : : : : 3.2 Integrating a Graphical User Interface into a DBMS 3.2.1 Strong Integration into a DBMS : : : : : : : 3.2.2 Weak Integration: Separated Conception : : 3.3 Conclusion : : : : : : : : : : : : : : : : : : : : : : :
: : : : :
: : : : :
: : : : :
: : : : :
: : : : :
: : : : :
: : : : :
: : : : :
: : : : :
: : : : :
: : : : :
: : : : :
: : : : :
: : : : :
: : : : :
: : : : :
: : : : :
: : : : :
: : : : :
: : : : :
: : : : :
: : : : :
: : : : :
: : : : :
4.1 A Model for Editing Maps : : : : : : : : : : : : : : : : 4.1.1 Maps in the Database : : : : : : : : : : : : : : 4.1.2 Images : : : : : : : : : : : : : : : : : : : : : : : 4.1.3 Stack of Images : : : : : : : : : : : : : : : : : : 4.1.4 Presentation : : : : : : : : : : : : : : : : : : : 4.1.5 Mapget : : : : : : : : : : : : : : : : : : : : : : 4.2 Architecture of a Geographic Database User Interface 4.3 Back to Map Display : : : : : : : : : : : : : : : : : : : 4.3.1 Overlaying Maps : : : : : : : : : : : : : : : : : 4.3.2 Multiple Representation Display : : : : : : : : 4.3.3 Map Display Mechanism : : : : : : : : : : : : :
: : : : : : : : : : :
: : : : : : : : : : :
: : : : : : : : : : :
: : : : : : : : : : :
: : : : : : : : : : :
: : : : : : : : : : :
: : : : : : : : : : :
: : : : : : : : : : :
: : : : : : : : : : :
: : : : : : : : : : :
: : : : : : : : : : :
: : : : : : : : : : :
4 A Modular Approach for Editing Maps
2 3 3 3 4 4 5
6
6 7 8 10 10
11
11 11 12 12 12 13 14 16 16 17 18
5 Conclusion
19
Bibliography
19
Appendix: Speci cations of the Editing Model
22
5.1 Database Level : : : : : : : : 5.1.1 Maps : : : : : : : : : 5.1.2 Legend : : : : : : : : 5.2 Editing Level: Main Module : 5.2.1 Images : : : : : : : : : 5.2.2 Stack-Images : : : : : 5.3 Connection Level : : : : : : :
: : : : : : :
: : : : : : :
: : : : : : :
: : : : : : :
1
: : : : : : :
: : : : : : :
: : : : : : :
: : : : : : :
: : : : : : :
: : : : : : :
: : : : : : :
: : : : : : :
: : : : : : :
: : : : : : :
: : : : : : :
: : : : : : :
: : : : : : :
: : : : : : :
: : : : : : :
: : : : : : :
: : : : : : :
: : : : : : :
: : : : : : :
: : : : : : :
: : : : : : :
: : : : : : :
22 22 23 24 24 25 26
1 Introduction An e�cient human-computer interaction is a task of increasing importance in many new database applications such as CAD/CAM, environmental management, or multimedia. In the area of geographic information systems (GISs), little e�ort has been made to provide both designers and end-users with appropriate tools for manipulating geographic data. We focus here on GISs using a database management system (DBMS) as a support. Although DBMSs sometimes provide basic features for handling geographic data, they are usually not designed to manipulate them graphically in an e�cient way. In addition, only a few of them [2, 24, 14] o�er a customizable and extensible graphical user interface (GUI). As far as geographic applications are concerned, some work has been done in the area of spatial query languages (see [22, 7, 11]) and graphical manipulation [17, 8]. However, to our knowledge, nothing has been done to understand in detail the problems of designing GUIs for geographic applications when connected to a DBMS. One of these problems is that such a design involves geographic DBMS features as well as graphical tools. A lot of progress has been made in both areas independently, but the bridge between them still has to be built. The goal of this paper is to investigate the problem of designing a geographic database user interface (GDUI), and to propose a toolkit-based solution that satis es a large number of users. This work is based on our experiment: First, GOODS/O2 [23], a GIS prototype built on top of the object-oriented system O2 (version V1) [9], whose user interface [28] was developed by extending the O2 regular interface generator Looks [19]. Second, an orthogonal approach consisting of a map editing kernel [20] connected to the geographic DBMS GeO2 [6] developed on top of the O2 product [2], whose basis was the map editing model presented in [29] and extended in [30]. GISs are concerned with many di�erent elds, such as planning, resource management, tra�c control, etc., which may have an impact on the functionalities of a GUI (data input, cartography, animation, use of graphic tools for statistics, etc.). We focus here on basic functionalities that such an interface should provide, namely map editing and querying. The geographic entities we consider are 2-dimensional (polygons), 1-dimensional (lines) and 0-dimensional entities (points). This paper is organized as follows. In Section 2, we list the requirements of a GDUI for a better understanding of the problems. In Section 3, we discuss two design approaches radically opposed: In the rst one a strong integration of the graphic components into the DBMS is considered, while in the second approach a map editing kernel as separated as possible of the DBMS is designed (weak integration). In Section 4, we propose a model for graphical map manipulation embedded into a general map editing kernel architecture, which shows our favorite solution for coupling a GDUI with a geographic DBMS. Finally, Section 5 draws some conclusions. 2
2 Map Editing and Querying Requirements We now present the basic features that a GUI should provide for map editing and querying. The terminology not being standard in this domain, we rst start with an informal de nition of the terms used throughout this paper. The main objects we consider are maps stored in a database (sometimes called \thematic maps" or \themes" or \layers" in the literature). The geometry of a map can have either a vector form or a raster form. We focus here on maps whose geometry is stored in a vector format. Generally speaking, maps are collections of geographic objects. For instance, a country is a geographic object. A geographic object has usually two parts, an alphanumeric one, or description (e.g., the name and population of a country), and a spatial one corresponding to its geometry (e.g., a polygon or a set of polygons). In addition, a geographic object can be atomic or complex (made of other geographic objects). A city composed of streets and buildings is a complex object. A map is more than a complex geographic object since it includes information on data it contains such as the coordinates system, the source of information, etc. A geographic database is a collection of maps. Note the di�erence between a map as it has just been de ned and the common term \map" that denotes a nal (and frozen) representation, on paper for instance, of what is called a map here. Map editing is concerned with two major aspects: (i) displaying and (ii) modifying maps. Displaying maps usually refers rst to the display of the spatial part of their geographic objects. The corresponding displayed objects are called cartographic objects. The geographic objects' description can be displayed after pointing to cartographic objects on the screen. As far as map querying is concerned, the problem is more complex than in the case of \standard" queries (purely alphanumeric) since map queries sometimes need graphic parameters. As a consequence, a speci c interaction with the end-user has to be considered. For example, before answering the queries \What is the closest gas station from this point" and \Is there a city hall in this area?", a point or an area have to be drawn on the screen by the end-user. We give below the requirements for (i) visually representing maps (map display), (ii) manipulating or updating maps (e.g., erase a boundary between two geographic objects) and (iii) interacting with the database (e.g., get the description of a geographic object or perform queries on maps).
2.1 Map Display 2.2 Basic Functionalities
Displaying maps includes the following basic functionalities:
� Display data of type raster (bitmap) or vector (point, line, polygon). � Display alphanumeric data (description of a geographic object). 3
2.3 Visual Aspects
For a minimum of map understanding and map manipulation, the following is required: � Overlay vector maps and raster maps (e.g., satellite images). � Allow one to change scale (e.g., zoom) on a whole map or on a subset of a map. � Attach a legend (color, pattern, text, symbol) to maps or subsets of a map. � Display data with various scale and di�erent representations (mix of the two previous points). A well-known related problem is the problem of generalization [16, 3]. For instance, it allows one to modify the representation of geographic data according to the scale (e.g., for displaying them in a smaller space). This means that new cartographic objects have to be computed. To give examples, the four following points may improve the clarity of a map display: { Give a new representation to a geographic object according to the scale. For example, a city that is a polygon in the database can appear as a point or an icon (new cartographic objects) depending on the scale and on design choices. In the worst case, if the scale is too small, the geographic object will disappear unless it has a \semantic importance" [20]. { Simplify the contour of a 2-dimensional object (remove points on the border), or of a 1-dimensional object (drop points on a line). { Simplify the display of geographic objects by using the concept of aggregation when there exists subobjects that represent a partition of the plane. For example, on a map of states, if a state is made of counties, only the contour of the state (the geometric union of the counties' geometry) will be shown. { Simplify the display of a complex geographic object. For instance, on a map of cities, just represent a few buildings of each city. This shows that m geographic objects (the buildings that compose a city) can be represented as n cartographic objects (a selection of n buildings among m buildings).
2.4 Windows and Interaction with End-Users
Maps are displayed in windows with which users have a particular interaction. This includes: � Map display (geometry): { Display several maps in a same window without overlaying them. { Possibly show a restricted part of a map (the rest can be seen by scrolling). { Overlay several views of the same geographic space in a same window (e.g., states, cities and highways). Although the rst two tasks seem to be GUI issues rather than GIS issues, we will see later on that they need to be handled in a speci c way in geographic applications. � Interaction with the user on the display: 4
{ Allow an end-user to select objects on the screen (usually with a mouse). { Provide the possibility to draw areas on the screen (e.g., a rectangle for a zoom
or for a spatial selection, see below). { Give the user the possibility to modify objects interactively (e.g., erase a boundary between two polygons). { Provide query language facilities, either graphically (e.g., [17]) or through a language (in a text editor) such as SQL extended to spatial concepts ([7]). Such a language has a tight connection with the GUI because of the interactive nature of queries in geographic databases. As said before, GIS queries often deal with objects displayed on the screen, for example: \What is the appropriate subway route to go from here (clicked on the screen) to home?" In an object-oriented environment, some queries corresponding to (algebraic) operations on maps such as clipping, windowing, map overlay, etc.(see [22]) can be de ned as methods invoked from a GUI. They sometimes need a graphic argument as well (e.g., clipping and windowing need an area drawn on the screen by the user). � At a meta level, provide (graphic) tools for browsing the database and the map library, for instance to select appropriate maps for a given study.
2.5 Interaction with a Database
Given the previous requirements, it is clear that the interface has to communicate with the database for at least: � Getting the objects to be displayed: Maps (as a whole), i.e., the geometric part of their geographic objects but also their description (text editor). � Attaching a representation such as color to a geographic object, depending on the information it contains. This is usually done by reading a legend stored in a database independently of maps. Then the corresponding cartographic objects are created. � Updating objects (either their geometry or their description), i.e., changing the value of a geographic object in the database. � Querying maps: (i) alphanumerical querying (e.g., SQL in a text editor), and (ii) graphical querying (transmit graphical arguments to queries). The main communication functions between the user interface and the database are given below. Regarding the notation, in order to remain general we refer to the alphanumeric part of a geographic object as \description" (instead of string, etc.). A description is for instance the string: \Name:France, Population:57, Surface:550000". Functions that refer to database operations are pre xed by db:, while user interface functions are pre xed by ui: and functions that are the link between the interface and the database are pre xed by connection:.
� Display a map:
ui:MapDisplay(map).
5
� Get a geographic object (go) in a (database) map from the coordinates of a cartographic object (co):
!
connection:GetObject(map, co) go. /* Assuming there may be several maps displayed on the screen */
� Update a geographic object in a (database) map connection:UpdateObject(map, go).
� Apply a (db) function f on a map: db:f(map, args) ! result, where args is a list of either alphanumerical or graphical arguments and result the result of a query (same thing).
3 Strong vs. Weak Integration: Two Design Approaches The user interface of a geographic application can be considered as a kernel independent of a DBMS (although it has to be connected to it). This holds for many speci c applications, whose particularity is to perform treatments that are usually out of the scope of the DBMS. As an example, we can cite multimedia applications such as hypertext, applications dealing with statistics whose data are persistent, etc. In the following, we refer to the set of speci c treatments (statistics, expert system, planning, tra�c analysis, etc.) as \external module". In this section, we rst consider the general problem of connecting an external module to a database, then we study such a connection in the context of GDUIs. We insist on the fact that our goal is not to develop in detail DBMS aspects such as openness and extensibility, but rather is to describe them with the objective of GDUI design in mind. This is also the reason why we focus more on conceptual aspects than on technical aspects.
3.1 Connecting an External Module to a DBMS
When an external module is used together with a DBMS, one question that arises concerns the division of tasks among the DBMS and the external module. The functionalities of a DBMS are limited and it is sometimes not clear whether some speci c tasks should be performed by it or by an external module. Should the DBMS be in charge of performing complicated and expensive algorithms as in the case of statistics, CAD/CAM, planning, etc.? Or should these algorithms be performed by a more appropriate module that is optimized for a given treatment? This question is especially relevant in the case of objectoriented DBMS where there exists a single language both to de ne and to manipulate data (no \impedance mismatch"). A more general question related to it in this case is: Which methods should really be associated with an object? Unfortunately, we believe that there is no real answer to this question, since it depends on particular problems and on the openness of the systems involved. In the context of geographic databases, which require for example robust geometric algorithms, this issue is particularly important.
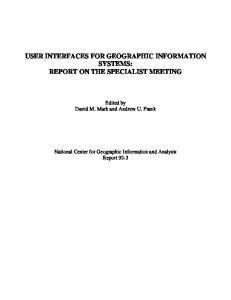
There exist basically two di�erent ways to de ne a speci c application within a DBMS environment, i.e., to connect an external module to a DBMS: Either the integration is strong (no real external module, Figure 1.a) or it is weak (Figure 1.b). Note that the way from strong to weak integration is gradual. For instance, a solution in between is to consider an 6
extensible DBMS (i.e., a DBMS with hooks for extensions at di�erent levels, see [12]), so the DBMS plays the role of an integrator. In the case of strong integration, the potential of the underlying DBMS is exploited as much as possible, and all concepts are embedded within the same homogeneous environment. In particular, only one data model exist, and if the (virtual) external module needs special structures, these structures will be de ned using the database model. This approach was chosen in [1] for instance.
DBMS
DBMS
data model
data model
query language
query language
specific application
application specific application EXTERNAL MODULE geometric processing statistics graphic libraries
... ... a.
b.
Figure 1: Strong vs. weak integration In the case of weak integration (Figure 1.b), two independent systems coexist: The DBMS on the one hand and the external module on the other hand, and the main problem is to build the connection between them. As mentioned above, another problem concerns the repartition of tasks among the two systems. In the case of GDUIs for example, it is not clear what should be left to the GUI module and what should be de ned in the geographic DBMS. For instance, consider the problem of e�ciently nding an object on the screen, and suppose the existence of an external package for displaying graphic objects, for instance the C++ graphic library Ilog Views [13]. Ilog Views de nes indices on graphic data (thus in the GUI), although any geographic DBMS kernel now encompasses such a notion. Moreover, it is usually more adequately de ned in a DBMS since it is made especially for geographic data. Which index mechanism(s) should then be used? Is it really worthwhile rebuilding index structures at the GUI level (which may slow down the performances)?
3.2 Integrating a Graphical User Interface into a DBMS Compared to other possible external modules, geographic user interfaces have a tight connection with a DBMS since, among other things, they re ect the contents of the database 7
at a given time and show a view of database objects. A few database environments provide tools, unfortunately not always su�cient, to design a graphic user interface. Then for designing a GDUI, the problem of choosing a type of integration still remains, and the two opposite approaches mentioned above can be considered: Either graphic concepts are embedded into the DBMS environment (such as in [23]) (Figure 2.a), or they are completely independent (such as in [29], Figure 2.b). In Figure 2.b.2, the GUI objects are stored in a database, which is not necessarily the one used to store the geographic objects. In the rst solution, the cartographic objects of Section 2 correspond exactly to the database geographic objects, while in the second approach they are totally independent. Hence they could be de ned and manipulated using an external graphic package (by de ning rst a mapping onto the external language that deals with graphic routines).
Database
Geographic database (geographic objects) Application
Database
Database
Geographic database
Geographic database
(geographic objects)
(geographic objects)
Application
Application
Graphical interface
Graphical interface
b.1.
b.2.
Graphical interface (Built-in interface generator or editors)
cartographic objects
a.
b.
Figure 2: Integrating a user interface with a DBMS We now detail these two possible integrations of a GDUI into a DBMS, and discuss their advantages and drawbacks while designing a GDUI.
3.2.1 Strong Integration into a DBMS
In this approach (Figure 2.a), there is no real distinction between geographic objects and cartographic objects since cartographic objects are the (unique) views of geographic objects. In other words, there is only one environment to deal with, and the geographic application is driven by the DBMS. We distinguish two cases: Either the DBMS provides an interface generator (Case 1), which allows one to design editors for new types of data such as geographic data, or no tools are provided and display routines (map editors) need to be de ned in the application (Case 2). As an example of Case 1, we can cite the O2 prototype [9] with its interface generator Looks [19]. Looks o�ers editors for each basic O2 type (string, integer, bitmap, etc.) and for each O2 constructor (tuple, set, list) called recursively, thus each O2 8
object, even complex, can be displayed. There is only one way to display an object (the idea is \One object from the disk to the screen"). On the other hand, the geographic application GeO2 [6] (built using the O2 product [2]) is an example of Case 2: With some GeO2 objects is associated a \display" method programmed by the GeO2 developers. In Case 1 (existence of an interface generator), the advantage is that the developer's task is obviously facilitated. S/he needs not to consider communication aspects between the interface and the database for getting and updating objects because the framework to do that already exists. In Case 2 (no interface generator), the application must include routines for displaying objects. For instance, in the basic GeO2 system, displaying objects is done via methods on geographic objects that invoke Xlib routines. However, strong integration su�ers from major drawbacks. In both previous cases, the DBMS application gives an object the \order" to display itself on the screen, and everything is done within the database environment which is a complete geographic DBMS. It is clear that this ad hoc solution is data model dependent. The interface can be considered as an application on top of the DBMS, which leads to limits if the model or the application change. Moreover, it seems di�cult to consider many di�erent databases simultaneously, although this is useful in geographic applications when data from di�erent sources are to be merged (say for instance a set of maps stored at a big scale in some DBMS and another set stored at a small scale in another DBMS). In addition, in geographic applications, it is not unusual to have data stored under di�erent systems (e.g., Unix and MS/DOS). Regarding map display functionalities, the DBMS environment must have an elaborate knowledge of windows in which objects are to be displayed. If the mechanism for displaying objects (e.g., maps) in windows is \frozen", map display turns out to be problematic. Take for instance the overlay of two maps (two maps have to be displayed in the same window). If the DBMS display mechanism is such that there is a bijection between windows and objects to be displayed (as in Looks), such an overlay is impossible and the regular display mechanism has to be bypassed. This is also the case when a database operation needs a graphic argument. As an example, take the call for methods function of Looks. In \standard" O2 applications, the arguments of methods are either objects or alphanumeric values, hence they are supposed to be entered via a regular text editor. The Looks function that handles method calls takes care of (i) getting the argument(s) in a text editor, (ii) checking the type and (iii) transmitting it to the DBMS. Now consider a method clipping on maps. The argument of this method is a rectangle drawn on the screen by the end-user and thus cannot be entered via a text editor (or this is not user friendly). Then the entire Looks call for methods has to be reprogrammed in order to deal with graphic (interactive) argument in addition to alphanumeric (standard) arguments. This is a tedious task because it concerns low level functions of the interface generator. The previous examples illustrate the major problem of this approach, namely the lack of
exibility in the display mechanism. This is partly due to the philosophy \A single object from the disk to the screen", which is not suitable for displaying geographic objects. In addition, it makes it tedious to handle generalization where m geographic objects become 9
n (m > n) cartographic objects (see Section 2). Unfortunately, given the lack of choice in the programming tools, the designer is dependent on both the existing graphic tools and the display mechanism and must adapt to the existing philosophy. If no interface generator is provided (Case 2), there is more exibility in the programming, but no exibility in the design either, or the programmer has to master the low levels of the DBMS (with possible use of system primitives) together with graphic routines.
3.2.2 Weak Integration: Separated Conception
In this approach (Figure 2.b), the user interface is developed separately and is eventually connected to a particular DBMS, usually in an ad-hoc manner. The user interface can be developed using graphic packages (such as GoPATH [5], IlogViews [13], ...). The application is driven by the interface.
Compared to the previous approach, the advantages here rely on the fact that the interface is adapted to the needs of geographic applications. From a design point of view, there is a total independence between the database and the interface, and the designer needs not use neither a given a display philosophy nor imposed graphic tools. S/he can take advantage of e�cient graphic routines de ned in a specialized package, which leads to a more powerful interface than in the case of strong integration. New tools can easily be added, such as sophisticated editors for statistics. The main drawback of this approach is that the connection with the database needs to be de ned by the developer (e.g., for getting objects, querying, sending data ows.). It is now widely recognized that coupling systems is cumbersome for many reasons, from a logical level (type mapping) to a physical level. For instance, if the geographic interface is developed from scratch, a low level communication dialog has to be de ned (e.g., using Unix sockets). Moreover, if the DBMS changes, the communication layer has to be reprogrammed. To implement one of the rst user interface of the Sequoia project [25] built on top of Postgres [26], a visualization software package (AVS) was chosen, which required the writing of an AVS-Postgres bridge (obviously very speci c). A more modular solution was chosen in the Godot system [10], developed on top of ObjectStore [15], whose GUI uses the GoPATH [5] package together with an \interactive interface" level. Moreover, as mentioned in the beginning in the case of index structures, it is sometimes not clear what actions should be performed by the DBMS and by the GUI. As another example take the zoom operation. Should it be programmed at the interface or at the database level?
3.3 Conclusion
Given the requirements of geographic applications and the major drawbacks of the two solutions presented above (the lack of exibility of the rst one and the integration problems of the second one), an alternative solution would be a sort of mix corresponding to the second solution together with well de ned general interfaces with a DBMS. This means that we tackle the problem at a higher level, and that the solution we advocate is to o�er tools 10
for developing customizable interfaces within a general database environment. The user interface is developed separately using graphic tools. There still exists a DBMS data model behind the geographic application but this is transparent to the user if there is a module for making the junction between the two worlds. This is the topic of next section.
4 A Modular Approach for Editing Maps In this section, we propose a general model and a GDUI architecture for editing maps. This proposal is independent of any underlying database model but is supposed to cooperate with one or many. The architecture presented below was used in previous development [20]. After describing the main modules of the GDUI, we come back to map display and we detail some features necessary for \advanced" map display.
4.1 A Model for Editing Maps
Before presenting the editing model itself, we brie y describe maps in the database. It should be stressed that, in order to be independent on any database model, the map model described here is purely conceptual (and is intended to be implemented according to a particular database model). We then present the basic entities of our editing model: Image, stack of images, presentation, mapget. Because our purpose is to present in a simple way a general model that encompasses the requirements given in Section 2, technical speci cations are not given here.
4.1.1 Maps in the Database A map is a collection of geographic objects. A geographic object is usually derived from an entity of the real world. It can have a spatial part as well as a (alphanumeric) description. For instance, a river is characterized by its name, its ow (both representing its description) and its geometry (a polyline). Let us summarize these basic notions in the following de nitions, in which f ... g denotes a collection of objects. map = (information,{geographic-object}) geographic-object = (description, geometry)
A geographic object may be composed of several other geographic objects. For instance, a branch of a river can be isolated to form a geographic object. In this case, a river is a complex object whose branches are atomic objects. The notion of composition can be introduced in the objects de nition itself. This consideration leads to the following more elaborate de nition of geographic objects: geographic-object = (description, geometry) /*atomic geographic object*/ | (description,{geographic-object}) /*complex geographic object*/
This representation permits to associate a geometry with only atomic objects. One then avoids duplicating the geometry of (complex) objects in the database when it can be 11
inferred from the lowest levels (the atomic objects). At implementation time, the geometry of geographic objects usually corresponds to spatial data types. These are easily implementable using an extended-relational or an object-oriented DBMS [30]. In general, the following spatial data types are de ned: Area (2-dimensional), line (1-dimensional) and point (0-dimensional), and operations such as intersection, adjacency, etc. are associated with these types. In Section 2, the notion of raster data such as satellite images was mentioned. In the sequel, we shall call the corresponding entities raster-images. They are stored in a database as well, but their manipulation within a DBMS environment is out of the scope of this paper.
4.1.2 Images An image is an interface object that corresponds to a view of a map to be displayed (note that it has a vector form and has nothing to do with the \raster-images" mentioned above). A (database) map may have many images. An image is constituted of objects derived from a mapping of the database geographic objects with which is associated a type of representation (basically, a type of legend, see Section 4.3.1). For instance, a city of the database can appear as an icon or a point together with a label, depending on the scale and on user choices. The objects of an image are called cartographic objects. Since an image requires some time to be computed, it is sometimes worthwhile storing it in a database for other sessions (Figure 2.b.2).
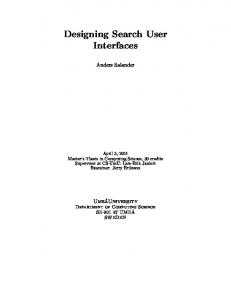
4.1.3 Stack of Images Views of maps (images) are stacked in windows as shown in Figure 3. The main object considered for this purpose is an image-stack. It has a crucial role since it is in particular in charge of the visibility of a map display (see below). The use of such a structure allows a geographic object to have many di�erent representations on the screen. For instance, take the rst two layers of Figure 3 (labels and countries) and the geographic object \the country Spain". One can see two views of this object, its name, \Spain", and its geometry (a polygon), and one could even imagine other representations (such as a particular color if this object belongs to the result of a query, etc.). Operations on stacks such as shift-up or shift-down can be found in [30].
4.1.4 Presentation A presentation is a view of an image-stack at a given time. It can be the drawing of a map with symbols such as labels or icons (Figure 3). It is composed of graphic objects, which are not relevant here because they are implementation dependent. In the prototype [20], presentations correspond exactly to images (no notion of stack). They are implemented as X/Motif \pixmaps", i.e., raster structures, for performance reasons (in particular, the 12
is composed of:
Danemark Eire
England Holland Germany Belgium Munich Luxemburg Austria France Switzerland
rivers
Italy Portugal Spain
Danemark Eire
countries
England Netherlands Germany Belgium
France
Luxemburg Austria Switzerland Italy
Portugal
labels Spain
Figure 3: Overlaying maps: Stack of images scroll and simple zoom operations already exist on pixmaps). However, given the lack of semantics of such a trivial structure, using an e�cient vector object is more advisable.
4.1.5 Mapget
A mapget (shortcut for \map widget") is a (X) window in which maps are displayed. A mapget can be composed of other mapgets. In this case it is a compound mapget, otherwise it is a simple mapget. With a simple mapget is associated a presentation that constitutes a resource of the window: mapget = simple-mapget | compound-mapget simple-mapget = (rectangle, presentation) compound-mapget = (rectangle, part),
where < >part represents a partition constructor not detailed here. The rectangle in the compound mapget is optional and can be inferred from the rectangles of the mapgets that compose it. Its value can also be checked by integrity constraints. More precisely, a compound mapget is a tree T whose internal nodes are compound mapgets and leave nodes are simple mapgets (Figure 4). The root of T is the largest window. There is an edge from w to s in T if s is a window included into w. An application is a collection of mapget trees. 13
M0
M0
m1 M2
m1 (p1)
M2 m3 m4 m5
m3 (p3)
m4 (p4)
m5 (p5)