The current issue and full text archive of this journal is available at www.emeraldinsight.com/2040-8269.htm
MRR 37,3
Designing and using research questionnaires
308
Languages, Information and Communications, Manchester Metropolitan University, Manchester, UK
Jenny Rowley
Abstract Purpose – This article aims to draw on experience in supervising new researchers, and the advice of other writers to offer novice researchers such as those engaged in study for a thesis, or in another small-scale research project, a pragmatic introduction to designing and using research questionnaires. Design/methodology/approach – After a brief introduction, this article is organized into three main sections: designing questionnaires, distributing questionnaires, and analysing and presenting questionnaire data. Within these sections, ten questions often asked by novice researchers are posed and answered. Findings – This article is designed to give novice researchers advice and support to help them to design good questionnaires, to maximise their response rate, and to undertake appropriate data analysis. Originality/value – Other research methods texts offer advice on questionnaire design and use, but their advice is not specifically tailored to new researchers. They tend to offer options, but provide limited guidance on making crucial decisions in questionnaire design, distribution and data analysis and presentation. Keywords Quantitative research, Quantitative data analysis, Research questionnaires Paper type Conceptual paper
Management Research Review Vol. 37 No. 3, 2014 pp. 308-330 q Emerald Group Publishing Limited 2040-8269 DOI 10.1108/MRR-02-2013-0027
1. Introduction Questionnaires are one of the most widely used means of collecting data, and therefore many novice researchers in business and management and other areas of the social sciences associate research with questionnaires. Given their prevalence, it is to easy to assume that questionnaires are easy to design and use; this is not the case – a lot of effort goes into creating a good questionnaire that collects the data that answers your research questions and attracts a sufficient response rate. In this article, we use the term research questionnaire to refer to questionnaires that are used as part of an academic research project. Others (Bryman and Bell, 2011) use the term self-completion questionnaire, or the related terms self-administered questionnaire or postal or mail questionnaire. Further, we use the term questionnaire to refer to documents that include a series of open and closed questions to which the respondent is invited to provide answers. Research questionnaires may be distributed to the potential respondents by post, e-mail, as an online questionnaire, or face-to-face by hand. Interviews, especially structured and semi-structured interviews, also ask questions that the respondent is invited to answer, but the essential distinguishing characteristic of questionnaires is that they are normally designed to be completed without any direct interaction with the researcher, either in person or remotely. However, the boundary between questionnaires and interviews is fuzzy, since they are both question answering research instruments, with unstructured interviews at one end of a spectrum and questionnaires comprised of
predominantly closed questions at the other end. Respondents to a questionnaire may be asked to answer questions regarding facts (e.g. their age or salary), or their attitudes, beliefs, behaviours or experiences as a citizen, manager, professional, user, consumer or employee. Since one of the main advantages of questionnaires is the ability to make contact with and gather responses from a relatively large number of people in scattered and possibly remote locations, questionnaires are typically used in surveys, where the objective is to profile a “population”. This leads to consideration of who to include in the survey, or the sample. In research in organizational studies, management, and business, participants may be selected either as an individual or as a representative of their team, organization, or industry. If you are new to research, and possibly engaging in research to complete a thesis or other small-scale project, and are planning to use questionnaires as a research method, this article is written for you. It helps you to think about the decisions that you need to make in designing questionnaires, distributing the questionnaires is such a way as to get a good response rate, and analysing and presenting the data. This article seeks to provide answers to some of the questions that new researchers frequently ask. Whilst its emphasis is on helping you to do rigorous research and to succeed and maybe even excel, it is also pragmatic in recognizing the time and other constraints often experienced by new researchers. There are many other sources of advice on designing and using research questionnaires that you could also consult. First, there are many research methods textbooks that offer a basic grounding in research methods (Bryman and Bell, 2011; Collis and Hussey, 2009; Cresswell, 2008; Denscombe, 2010; Easterby-Smith et al., 2012; Lee and Lings, 2008; Saunders et al., 2012); since these books have a wide scope, they only provide limited information on questionnaires as a data collection method. Interestingly, there are only a few texts that deal specifically with quantitative methods (Oakshott, 2009; Swift and Piff, 2010). Finally, there are a few texts devoted specifically to questionnaires and/or surveys; amongst these Oppenheim (1992) is regarded as a classic, whilst Gillham (2007), Sue and Pitter (2012) and Fowler (2008) are also useful guides. Useful as these are, they can be a little daunting for the novice researcher who is seeking a relatively quick and pragmatic approach to designing questionnaires and analyzing their data. As with all research methods, learning how to work with questionnaires is an iterative process, in which initial guidance allows the researcher to get started, experience and reflection hones their art, and further advice helps the researcher to develop their research skills yet further. This article starts with discussion of a number of questions that are associated with the design and planning of the questionnaire, and then moves on to consider aspects of the questionnaire distribution and sampling, and finally, concludes with some thoughts on making sense of the data and presenting it in a findings chapter. 2. Designing questionnaires Q1. Why should I choose questionnaires for my research? Questionnaires are mostly used in conducting quantitative research, where the researcher wants to profile the sample in terms of numbers (e.g. the proportion of the sample in different age groups) or to be able to count the frequency of occurrence of opinions, attitudes, experiences, processes, behaviours, or predictions. For example, questionnaires could be distributed to members of a social network site in
Designing and using research questionnaires 309
MRR 37,3
310
order to ascertain the reasons for their membership of the site, and the benefits that they perceive themselves to derive from membership of the site. The questionnaire might include questions relating to any of the standard topics included in questionnaires: . “facts”, such as their age or occupation; . opinions, attitudes, beliefs and judgments, such as opinions on the benefits of the site, attitudes towards various features or functions of the site, and perceptions of the usability of the site; and . behaviour, such as how frequently they visited the site. Questionnaires are typically used in survey situations, where the purpose is to collect data from a relatively large number of people (say between 100 and 1,000). Often, but not always, the people from whom responses are collected are a sample drawn from a wider population, and are chosen to “represent” the wider population. So, for example, if we wanted to compare the leadership styles adopted by CEO’s in technology companies with those of CEO’s in retail organizations in the UK, we are unlikely to be able to collect a completed questionnaire from every CEO in these two sectors. So, we would need to make a decision as to how many responses from CEO’s of what types of organizations we would regard as sufficient, and select a sample accordingly. Although there are many different approaches to collecting data with which questionnaires can be compared, a common consideration for novice researchers is whether to choose between questionnaires or interviews. The big advantage of questionnaires is that it is easier to get responses from a large number of people, and the data gathered may therefore be seen to generate findings that are more generalisable. For example, if, say 400 students were surveyed on the factors that affected their choice of mobile phone service provider, then this study would have the potential to be generalisable to other members of the same student population. If, on the other hand, instead of using questionnaires, the researcher had opted to conduct interviews, time constraints would dictate that they collect data from rather fewer students, say, 20. With responses from only 20 students, we would feel a lot less confident that the data collected would support generalization to the rest of the specific student population. On the other hand, they may have potential to generate a range of insights and understandings that might be useful, to say, mobile service providers. In general, interviews are preferable to questionnaires when it is possible to identify people who are in key positions to understand a situation, such as, say, the managers responsible for implementing a corporate social responsibility policy in a specific brand of a retail chain. In summary then, questionnaires are useful when: . The research objectives centre on surveying and profiling a situation, to develop overall patterns. . Sufficient is already known about the situation under study that it is possible to formulate meaningful questions to include in the questionnaire. . Willing respondents can be identified, who are in a position to provide meaningful data about a topic. Questionnaires should not only suit the research and the researcher, but also the respondents.
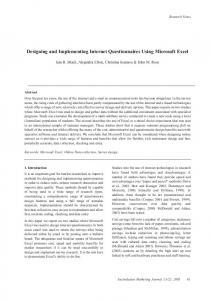
Q2. What types of research can be conducted through a questionnaire? Surveys and questionnaires are employed to conduct a variety of different kinds of research, key amongst which are: . Profiling and descriptive research, where the purpose is to generate a profile of the characteristics of the sample. For example, in examining innovation in a groups of SME’s in the food sector, questions might be posed to identify the level of engagement with different innovation activities (Figure 1). Such research answers questions such as what do they do, what do they think, and, what are their characteristics (e.g organizational age). . Predictive and analytical research, where the purpose is to understand any relationships between variables. We might be interested in the relationship between the number of hours exercise that a manager takes a week and their BMI. Provided we have asked the respondents for information on these two variables, and we have a sufficiently large data set, we can look for patterns, using techniques like correlation, regression, or x 2 tests, to investigate the relationship between these two variables. For example, does BMI go down as the number of hours exercise a week goes up? More advanced techniques such as multiple regression and structured equation modeling (SEM) allow exploration of the relationships between several variables at one time. Once research has established relationships between variables it may be possible to offer some predictions as to future events or patterns of behaviour. . Developing and testing measurement scales, where the purpose is to generate a measurement scale, or a set of statements to measure a complex variable, such as service quality, trust, or innovation orientation. Creating a measure such as the number of years experience a person has in their current role, or the turnover for a business in the previous financial year, is relatively straightforward. However, measuring and hence asking questions that “measure”, for example, the
Designing and using research questionnaires 311
1. How innovative are we? Please respond on the following scale. In our organisation we... encourage new ideas throughout the organisation. encourage and support innovative employees. gather and use information about our trade customers. are effective at implementing change. gather and use information about our consumers/end-users. put innovation at the heart of our strategic planning. gather and use information about our competitors & markets. engage in shaping an innovative organisational culture.
Strongly Agree
Agree
Neither agree or disagree
Disagree
Strongly disagree
Figure 1. Extract from a questionnaire on innovation orientation
MRR 37,3
312
innovativeness of an organization, or the extent of formalization of its strategic planning processes is much more complex. Accordingly, researchers develop measurement scales, comprising of a number of statements that can be used to measure the variable. Typically, they initially propose such statements based on previous research, and then test and refine the scale using data collected from appropriate respondents, with the aid of analytical methods such as exploratory, principal components or confirmatory factor analysis. Only when they have such measures of complex variables, can they ask questions such as “Is there any relationship between the level of innovation orientation of the organization and its turnover?”. Importantly, questions asked for one of above types of research can also be used in other types. Thus, the responses to questions in Figure 1 can be used to determine either the extent to which organizations are engaged in product innovation (profiling and descriptive research), or they can be used together with questions on, say, organizational age or turnover, to investigate the relationship between innovation activities and age and turnover (predictive and analytical research). Finally, together with other similar questions on innovation they can be used to generate an innovation orientation scale (developing and testing measurement scales). In summary, it is important to be clear about the aim and objectives of your research before embarking on questionnaire design. Q3. How do I decide the questions to ask? It goes without saying that the questions in the questionnaire are designed to generate data that is intended to answer your research questions. On the other hand, the questions often do not exactly match your research questions. First, and foremost it is important that questions use language that respondents understand – whereas your research questions may use more “academic” or specialized technical language. Second, you may for instance be interested in the relationship between two variables, such as in the example above, the relationship between the manager’s BMI and their exercise regime. The questionnaire is unlikely to ask this question directly (unless the aim is to explore people’s opinions on the relationship). Rather, the questionnaire may ask about BMI and exercise regime, separately, thereby collecting data that can be analysed to investigate the relationship. Both research and questionnaire questions can be informed by practice or experience, or by theory or previous research, or, as is common with research in practitioner disciplines, a mix of both. Research that is informed by previous theory and research is described as deductive. With deductive research, theory is a significant factor in determining the research questions, and indeed, it may be possible and even advisable to use part or all of a previous questionnaire from a published article on a similar topic. Provided that you acknowledge your sources, and the questions are adapted to your specific research question, this is not cheating; you are using questions that have already been “piloted” and making it easier to compare your research with previous research and to make a clear claim about what is new in your findings (Bryman and Bell, 2011). Indeed, there are many instances in which replication, conducting a similar study to one that was conducted earlier but in a different context, can be a valuable addition to knowledge. Since the design of a questionnaire calls for some prior knowledge, deductive research is more
common in research using questionnaires, than the alternative approach, inductive research, where the researcher deduces theory from the data that they have gathered. When framing and designing your questions it is useful to think about the type of question that is suitable for a specific context. The first, and most significant categorization of questions, is into open and closed questions. Figure 1 gives examples of closed questions, in this case, Likert scale questions, where respondents are asked to indicate how strongly they agree or disagree with a series of statements. Other types of scale questions can also be used, including different number of options (e.g. seven-point rather than five-point), and continuum scales with opposing words or concepts at opposite ends of a numerical spectrum. Figure 2 gives an example of an open question
Designing and using research questionnaires 313
Open question Describe a recent sales or marketing change (innovation) implemented by your organisation?
Closed questions List question Which of the following do you think will impact strongly on your career progression in the next two years.Please tick as many as apply: Gaining further qualifications The performance of the organization that I work for My managers’ evaluation of my achievements My success in finding opportunities to learn something new Whether my manager likes me Category question How many times last week did you use our e-banking facilities? Please tick one response Never
Once
2-3 times
4-5 times
5+times
Ranking question Please rank the following according to their impacton your intention to share knowledge with others in your workplace. Use‘1’to for the most important, and ‘5’for the least important. Trust worthiness of my co-workers Whether my managers’ assessment of my performance depends on my knowledge sharing activities Frequency of contact (physical or electronic) with my co-workers My confidence in my knowledge and skills Length of time that I have known my co-workers
Figure 2. Examples of open and closed questions
MRR 37,3
314
and of other types of closed questions; many questionnaires make use of a combination of open and closed questions. Closed questions are always accompanied by a number of options from which to select. Open questions simply invite respondents to provide data (e.g. team size, name of organization) or offer short comments (typically between one and three sentences). Closed questions are more difficult to design, because the researcher needs to know sufficient about the respondent population to be able to offer sensible categories for each closed question. For example, even what appears to be a simple type of closed question, one asking about the age of someone, needs to take into consideration the respondents and the research question. For example, in our study of the health and fitness regimes of managers, if the researcher is planning to distribute the questionnaires to full-time MBA students, then the specified age categories will be different to those if the questionnaires were to be distributed to senior managers in businesses in a specific sector. In addition, there are a number of different types of closed questions, each of which suits different research objectives, and may need a different types of analysis. For further explanation of types of questions see Gray (2009) and Ghauri and Gronhaug (2005), for an introductory account, and Oppenheim (1992) for a more complex account. Closed questions are quick for respondents (which may increase response rate), and the responses to closed questions are easier to code and analyse, which is particularly important if the number of questionnaires collected is quite large. Open questions are useful for collecting more in-depth insights, and allow respondents to use their own language and express their own views. However, since they are more time consuming to complete and to analyse, they should only be used when they are the best option. Q4. How do I ensure that the respondents answer my questions accurately? One of the limitations of questionnaires is that you will never be sure whether the respondents have understood your questions, or indeed, whether they have taken the time to provide accurate data. Also, you will inevitably have some unanswered questions on some questionnaires – these might arise from the respondent being bored, running out of time, not being willing to provide certain information, feeling that they do not know a fact or have an opinion, or not understanding the question. It is your task to design the questionnaire to make its completion as easy as possible for the respondent. This not only involves adhering to advice and guidelines on questionnaire design, but also involves understanding the potential respondents. What words do they use for artifacts or concepts? What data are they likely to have access to? Which issues can they reasonably be expected to have strong views on and which activities might they engage in regularly and therefore be able to comment on? Getting the questions right, whether they be open or closed questions, often requires the researcher to think carefully about their research objectives and questions. Next, you need to evaluate the different types of questions their suitability. Another important consideration is the respondents. In addition, the phraseology of questions is important. We suggest that you need to check that your questions: . are as short as possible; . are not leading or have implicit assumptions; . do not include two questions in one;
. . . .
.
only exceptionally invite “yes/no” answers; are not too vague or general; do not use double negatives; are not, in any sense, invasive, or asking questions that the respondent is unlikely to want to answer; and do not invite respondents to breach confidentiality.
Designing and using research questionnaires 315
Other authors also offer advice on question formulation; Ghauri and Gronhaug (2005) and Baker and Foy (2008) offer particularly useful discussions. Baker and Foy (2008), for example, discuss question phraseology, question structure, and the link between these and potential response bias. Another key consideration is the order of the questions. In general, the order of questions should be clear, often with questions clustered under theme or section headings. Often earlier questions set the context for later questions. So, for example, if in a study on brand equity co-creation, the first question asks “Please identify the online communities that might discuss your brand”, this has “keyed in” the respondent to thinking in terms of online communities and the online presence for their brand. This will influence their answers to subsequent questions. On the other hand, there are occasions when you do not want the respondent to be influenced in their answer by previous questions. For example, in our recent research on trust and the use of digital information sources, we first wanted people to respond to an open question on trust, without being influenced by the views on trust that were implicit in subsequent closed questions. Accordingly, we not only placed that question first, but also did not give the respondents the other questions until they had answered the first question. Another common consideration regarding the order of questions is where to put questions on personal details, such as age, role, gender, or salary, and on organizational details, such as budget, turnover, and number of staff. Normally, these are included at the end of the questionnaire in order to encourage respondents to complete the rest of the questionnaire before they come to sensitive questions that they might not want to answer (and indeed, may not answer). In summary, the order of questions is always important, but the specific order depends on your research. The quality of the response will also be enhanced by a clear title, coupled with a good, short introductory paragraph at the beginning of the questionnaire. This paragraph should introduce the purpose of the questionnaire, give the researcher’s affiliation and contact details, and thank respondents for completing the questionnaire. Figure 3 provides a succinct example. In some contexts it may be appropriate to elaborate further, but always remember, time spent reading your introduction/instructions is time not spent on answering questions. Presentation is also important. Aim for a professional and easy-to-read layout, with questions laid out systematically, and making efficient and Trust and the use of digital information sources Introduction We are interested in how people judge the trustworthiness of a digital information source. We would be grateful if you would give us ten minutes of your time to complete this questionnaire. Thanks. James Hunt and Linda Yo (e-mail addresses)
Figure 3. Example of a very short title and introduction on a questionnaire
MRR 37,3
316
effective use of space. If you are working with an online survey, then the survey software will help you with presentation, but there is still often scope for being creative by clustering questions. Finally, piloting of the questionnaire will give you a sense of whether the questions are straightforward and whether the questionnaire is easy to complete. Baker and Foy (2008) suggest that piloting tests both the questions (for variation, meaning, difficulty, and respondent interest and attention), and the questionnaire (for “flow”, question order, skip patterns, timing, respondent interest, and respondent well-being). A preliminary pilot, just to check that the questions make sense, can be conducted with friends and colleagues, but at least a few questionnaires should be completed by a member of the selected population that you are targeting (e.g. police officers, entrepreneurs, iPad users). Revise the questionnaire to eliminate any problems that emerge from the pilot study. This section has distilled some essentials of questionnaire design. Gray (2009) offers a useful complementary consideration of aspects of questionnaire design, including comments on the pilot study, whilst Oppenheim (1992) discusses the wording and sequencing of questions in detail, and Bryman and Bell (2011) offer some advice on questionnaire design. Q5. How long should my questionnaire be? And, how many questionnaires do I need to collect? These two questions are very commonly posed by new researchers. Whilst the first is concerned with questionnaire design, and the second is concerned with questionnaire distribution and its outcome, the answers to both questions are linked. This is because the key issue is the extent to which the data collected is of sufficient interest to form the basis of a Masters thesis or a research or project report. For example, with a very short questionnaire based entirely on closed questions, a greater number of questionnaires is necessary to provide “something of substance and interest”, than with a longer questionnaire. Ultimately, the optimum length of the questionnaire, as well as the number that you need to collect, both depend on: the nature of your research questions; the variability in your sample/population with respect to your research topic; and, the types of data analysis that you are planning to conduct. On account of the importance of context, most research methods textbooks do not offer any guidelines on questionnaire length and numbers specifically for novice researchers. Indeed, Lee and Lings (2008) who do discuss sample size, present all sorts of reasons why the approaches used by other authors to propose optimum sample sizes are unrealistic for novice researchers with limited time and resources. Accordingly, if at all possible it is important that you consult a more experienced researcher or supervisor to help you in making these crucial decisions. To complement this, in this section, we offer a few “rules of thumb”, based on our own experience of research supervision, which, whilst certainly not being “golden rules” offer a starting point. The first of these rules of thumb concerns questionnaire length. We suggest that a new researcher doing a small-scale study seeks to create a questionnaire that can be presented on two sides of A4, or the equivalent for an online survey. Such a target is designed to encourage you to think carefully about which questions to include (and take out), and the formatting and presentation of the questionnaire. A tight questionnaire: will be much easier and convenient for respondents to complete, and
hence is likely to maximize response rate; will generate sufficient data for a new researcher to analyse; and, is easier to work with during coding and analysis. Of course, this is only a rule of thumb, and if you really need a longer questionnaire, up to the equivalent of four sides of A4 is acceptable. Remember that not only is an unnecessarily long questionnaire onerous for your respondents, but you are increasing the chance of not being able to think carefully about every aspect of the design of your questionnaire. In terms of the number of questionnaires that you need for your analysis, there are both theoretical and pragmatic considerations. For example, suppose you are interested in the attitudes of managers employed by a specific retailer to environmental sustainability; you have circulated your questionnaire to a sample of 400 managers, and achieved a 25 percent response rate, so have 100 completed questionnaires. Is this sufficient? From a theoretical perspective, this depends on the extent to which views on environmental sustainability are shared across the organization, which has consequences for the representativeness of your data. In general, the more data the better, but a sample size of 400 is often regarded as optimal (Ghauri and Gronhaug, 2005), but, the adequacy of a smaller number of questionnaires will also depend on the types of analyses that you want to conduct. 100 questionnaires may be sufficient if you want to analyse the questionnaires as a set, but if you want to investigate whether other factors (such as gender, number of years with the business, or level of management) influence attitudes, you will be subdividing the 100 into groups according to these other variables; some of these groups may not be sufficiently large to generate statistically significant results. Switching to the pragmatic approach, if you are completing a Masters dissertation or a work-based survey, you are likely to be under tight time and resource constraints. In addition, you may have already sent out reminders, and do not have any confidence that you will be able to encourage any more respondents to complete your questionnaire. So, the pragmatist asks: are the responses that I have likely to provide some reasonable and interesting insights (despite potential reservations regarding representativeness and statistical significance)? Have I received responses from people with different roles, experience, backgrounds, and any other source of variability that might influence answers are included in the study? Ultimately, there is no right answer regarding the adequacy of a dataset and each case needs to be evaluated on its merits. Generally, then, taking these various considerations into account, a good rule-of-thumb for new researchers is to aim for around 100 returned questionnaires, of the equivalent of two A4 sides. In most instances this will involve distributing many more questionnaires, unless you can find a context in which respondents can be persuaded or gently cajoled into completing your questionnaire. For example, in an organizational setting it may be possible to ask managers to champion your study and to encourage their staff to complete the questionnaire. However, it is important to be aware that the power and status of such intermediaries may impact on responses; steps should be taken to ensure confidentiality. If you should have the opportunity for a more extended study, collecting more than 100 questionnaires is likely to make your research more robust and offer opportunities for generating a wider range of insights. But, remember if you collect data, you owe it to your respondents to analyse it! On the other hand, there are contexts in which the population is relatively small, and, it is, for instance unrealistic to expect more than 20-30 questionnaire responses. If you suspect that this is likely to be the case, consider other approaches, such as interviews, or the
Designing and using research questionnaires 317
MRR 37,3
318
possibility of combining a questionnaire-based survey with other methods, in a mixed methods research design involving, for example, interviews, experiments, or documentary research. 3. Distributing questionnaires Q6. How do I select potential respondents? The findings of your research depend critically upon your respondents. When writing up your research it is normal to provide a basic profile of respondents, in terms of, for example, job roles, qualifications, experience, gender, and other criteria that might be important to the study. For example, in a study of the personal information management behaviours of undergraduate students, data might be provided on the year of study, gender, age, and degree subject for each respondent. The first step in identifying your potential respondents is to consider the “population” for your study. Perhaps you are conducting a study on the experiences of marketing managers for organizations in the service sector with social media marketing. Your population comprises marketing managers – but which marketing managers? Are you interested in marketing managers working in organizations in a specific sector, such as financial services or business consultancy? Are you seeking to conduct an international study, or are you focusing on marketing managers in organizations in a specific country? Alternatively, you might approach your selection and identification of marketing managers through their membership of a professional body. One way or another, you will need to think about the population of marketing managers out there with relevant experiences, and list them and their contact details; this list is referred to as a sampling frame. Armed with a sampling frame, in an ideal situation the researcher should select a sufficiently large sample from the population to ensure that the sample is representative of the population, using a suitable sampling method. There are a number of different approaches to selecting such a sample including probability and non-probability sampling, as summarized in Table I. Probability sampling is viewed as ideal, because a probabilistic sample is one that is representative of the population from which it is drawn, and therefore statistical generalizations about the population can be made on the basis of the analysis of the sample data. In probability sampling, based on a sampling frame or list of the members in the population, every case in the population has a known probability of being included in the sample, thus enhancing the likelihood of selecting cases that represent the total population. In contrast, in non-probability sampling, since every case in the population does not have a known probability of being included in the sample, the representativeness of the sample may be compromised. However, in reality most social science research relies heavily upon non-probability samples. First, researchers often do not have a clear view of the population to which they are seeking to generalize, and boundaries regarding who might or might not be included in the population are vague. Second, it is often very difficult to compile a complete sampling frame, although there may be a variety of partial lists of members of the population held by various organizations or government agencies. Finally, even in the unlikely instance that a researcher does manage to gather a good sampling frame, and apply probabilistic sampling, they are unlikely to achieve 100 percent response rate; non-response is another source of potential bias. For example, although the sample that you draw might have equal numbers of men and women, the response set may not; the same could be the case for any other important variable in your study.
Sample type Probability sampling Random Stratified Cluster Non-probability sampling Systematic Quota Purposive
Convenience Snowball
Description Cases are selected at random – as in a lottery, a roulette wheel or using a table of random numbers Population is divided into groups by characteristics appropriate for the research questions (e.g. age, income, profit, location), and then a sample is selected from each group Population is divided into segments (e.g. geographical, by street), then several segments (e.g. streets) are chosen at random Cases are selected by choosing every nth case – , e.g. 5th, 10th 20th, etc. Systematic sampling is often regarded as close to probability sampling, depending on the order of the list Cases are selected on the basis of set criteria (e.g. gender, age, income group), to ensure that the sample has a spread of cases in different categories, even though some of those categories might be small The sample is “hand-picked” for the research. Used when the researcher already knows something about the specific cases and deliberately selects specific ones because they are likely to produce the most valuable data The sample is built from cases which are accessible, such as the organizations in a certain region, or the members of s social networking site A few key individuals are selected, and asked to contact or recommend other relevant individuals. Could be viewed as a mix between purposive and convenience sampling
In practice, notwithstanding the importance of a systematic approach to sampling, many studies depend on non-probability samples, often purposive, convenience or snowball samples, as a result of the difficulties associated with creating sufficiently comprehensive sampling frames. Most researchers agree that some data is better than no data, but it is still important to know the extent to which your sample is aligned with its population. Accordingly, post-hoc checks on representativeness can be conducted by comparing your sample with some key external statistics relevant to your study. For example, if you were studying SME’s and their engagement in innovation, there may be national statistics on the distribution of SME’s by size, sector and age; if you have collected such data for your respondents you can demonstrate the potential representativeness of your sample by comparison with these external statistics. If your respondent distribution is woefully lacking in terms of a key group, such as SME’s that have been in business for more than five years, you might try to address this by seeking out a few more respondents in this category. Sampling and the composition of samples is such an important aspect of survey design and the use of questionnaires that many other authors comment on the range of options. Particularly useful are Ghuari et al. (2005), Baker and Foy (2008), who discuss each of the types of sampling and offers some pragmatic tips on managing sampling. In addition, Bryman and Bell (2011) offer a very useful discussion of the merits of the different types of sampling, and they and Sue and Pitter (2012) comment on sampling for web surveys.
Designing and using research questionnaires 319
Table I. Sample types
MRR 37,3
320
Q7. What are the options for distributing my questionnaire in order to maximize the quality and quantity of the responses? Once you have committed to a questionnaire-based survey, you will start to worry about response rates. Lee and Lings (2008. p. 273) suggest that industrial mail surveys in the UK tend to get response rates of between 15 and 30 percent, and Bryman and Bell (2011, p. 235) describe a study that achieved a 37 percent response rate, but only after five follow-up actions. Accordingly, 20 percent can be regarded as a good response rate and many surveys suffer from much smaller response rates. So, having done your best to design a questionnaire that not only serves your purposes as a researcher, but is also easy for respondents to complete, the next thing is to think about what else you can do to achieve a good response rate. First and foremost, put yourself in your potential respondents’ shoes. If they are going to give you some of their time, they will want to feel, at the very least that they will not be bored, confused, inconvenienced, embarrassed, or expected to reveal something that they regard as confidential. They will probably make a very fast decision on the basis of your initial approach regarding whether they are willing to complete a questionnaire for you or not, so the quality of any initial e-mail, telephone call, or face-to-face contact is key. Early in the process, possibly in a covering e-mail, or on the questionnaire itself it is important to: explain your research, who you are and why you would like their help; offer an assurance of confidentiality; capture their interest; and, be clear as to the amount of their time that the interview will take. In respect of the last point, try to be accurate, and make sure that you have designed the questionnaire to minimize the amount of time that it will take to complete. If the questionnaire takes too long, it is likely that the respondent will skip questions, leave sections of the questionnaire incomplete, or abort altogether. Some novice researchers may dream that all they need to do is put their questionnaire out there, particularly when they are considering conducting a web surveys. However, experienced researchers know that getting a response is an art! Bryman and Bell (2011) emphasise the value of using your contact networks, including family, friends, fellow students and work colleagues. Contrary to the novice researcher’s expectations, the best responses are achieved by delivering the questionnaires personally to people that you know; they will be happy to help you. The second best option is delivering questionnaires (preferably short ones) in person at a venue, especially if you can be identified as a member of the group. For example, a student researcher who was researching student use of pub loyalty schemes, distributed her questionnaires face-to-face in three student pubs, and another, researching attitudes to brand sponsorship of music festivals, distributed questionnaires at a music festival. Another researcher distributed questionnaires on innovation in food sector SMEs at food sector exhibitions. Whilst such approaches might lead to high response rates, they may have consequences for what constitutes your research population, and arguably even more importantly, work best if the researcher is organized (the student had to know when the music festivals were on and arrange to visit some), and has real enthusiasm for the topic of their research. However, even in these contexts distributing the questionnaire is one thing – being sure to get it back completed is another. There are a number of options. In an office setting, for example, delivering by hand, perhaps in a personalized envelope is useful to make the bond between you and the respondent; thereafter, you could either ask for the respondent to put the completed questionnaire in the internal mail, or you could come
in person to collect a few days later. In the pub example, there are two options, read the questions, and note down or record the answers, or wait about until the respondent has completed the questionnaire; it goes without saying that this context requires a short questionnaire! You need to give some thought to the specifics of what will work for your respondents and your research. If you do opt for mail or e-mail questionnaires or an online web survey, you still need to build sufficient rapport between yourself and the potential respondents. At the very least, if you have chosen your topic well, the respondents and you will have a shared interest in the topic of the research, say, environmental sustainability. If you are a part-time student, you are likely to have a similar professional role to your respondents; use this when introducing yourself and your research. In addition, explaining that this research is, for instance, part of your studies, will have resonance for others who have had a similar experience. If possible, pre-notify your sample and get their agreement. Finally, in most instances, it will be necessary to send at least one round of reminders, say a week or two after the first questionnaire “distribution” in order to optimize the response rate. For further ideas on questionnaire distribution, consult any of Baker and Foy (2008), Gillham (2007), Gray (2009), Oakshott (2009), Saunders et al. (2012) and Swift and Piff (2010). In our discussion of cultivating a good response rate above, we have mentioned the main ways of distributing a questionnaire, face-to-face, mail and e-mail, and through using an online survey. For new researchers, unless internal mail within an organization is an option, the expense associated with mail surveys often rules them out as an option. Above we have discussed some of the procedures for face-to-face distribution. E-mail surveys are another option, in which the questionnaire is either embedded in the e-mail or distributed as an attachment to the e-mail. Online or web-based questionnaires are becoming increasingly popular, and properly conducted they can be very effective. Recently, one of our students successfully collected data from respondents of a specific nationality (which he shared), but whose place of residence was scattered across the globe. He loaded a questionnaire onto surveymonkey.com, and sent e-mails to people who knew him, asking them to complete the survey, and to pass the questionnaire completion request onto their contacts. SurveyMonkey is a commonly used, and easy to use web survey tool, and it is worth getting acquainted with it, by looking at their video tutorials. Section 3.1 offers some key pointers for designing and managing the response to web surveys. Web survey software, such as SurveyMonkey has three very useful features: it will help you to structure the presentation of your questionnaire; it makes it easier to design a questionnaire that “branches” so that respondents do not even see questions that are not relevant to them; and, it undertakes preliminary analysis for you. 3.1 Some suggestions for designing and managing the response to a web survey . Introduce the questionnaire with a welcome screen that is designed to capture people’s interest, and encourage them to proceed. . Ask people to login (using details previously provided to them), in order to limit access to the selected sample. . Think carefully about the first question screen; make sure that it is clear and the questions are easy to answer.
Designing and using research questionnaires 321
MRR 37,3
.
.
322
.
.
.
Present questions in a similar format to that used in a conventional questionnaire. Indeed, to maximize response you may be running a print questionnaire and a web questionnaire in parallel – make sure that they are consistent with one another. Opt for a professional and uncluttered presentation, resisting the urge to use colour or vary formatting just because you can. Use drop-down boxes (useful for some types of closed questions) sparingly, and identify each with a “click here” instruction. Test the web survey on different screen resolutions, web browsers, and devices, to ensure that the survey both works and looks the same for all respondents. Direct respondents to the web survey via personalized or group e-mails, and postings on discussion groups, and social networking sites (developed from Gray (2009)).
4. Analysing and presenting the questionnaire data Q8. How do I prepare to analyse my questionnaire data? At this stage in your research, when faced with analyzing a set of mainly numerical data, you will either feel that at long last you are in your element, and that you enjoy nothing more than digging around in your data to discover new patterns, relationships and insights, or you will experience a wave of panic. This is one of the most difficult aspects of using questionnaires for authors of research methods textbooks to address, because some of their audience are confident mathematicians, whilst others are not even comfortable with the basics. In addition, there is so much that a new researcher might want to know, or ideally should know, depending on the nature of their research questions and data. It does no harm to read the chapters on data analysis for questionnaires in a couple of research methods textbooks (Bryman and Bell, 2011; Ghauri and Gronhaug, 2005; Gray, 2009; Oppenheim, 1992; Pallant, 2010) because they review some important principles, but whether or not you are comfortable with the explanations, try to keep the whole endeavor under control by focusing on your research. First and foremost, you should have planned the analysis that you intend to undertake as you were designing your questionnaire; if you leave consideration of data analysis until you have collected your data you are heading for a fall. So, think about the types of descriptive and analytical analyses that you will need to do and the way in which you want to present your data. Also, remember that what you are trying to create is a results or findings chapter or section in your thesis or report, and think in terms of the main messages that emerge from your research that will interest others. Then seek out guidance on how to achieve this. I take the view that working with a data set from a questionnaire, and the tools that help you to investigate and make sense of that data involves exploration and iteration. Fortunately, given the data analysis software packages available to the researcher today, analyses can be conducted very quickly. You do not need to know how to calculate, for instance, a standard deviation or a correlation coefficient. You do need to make sure that you include the correct data in the analysis (this involves understanding your data set and how you have entered and coded it into the analysis software), and what the statistics that the software has calculated for you mean.
In terms of data analysis software, there are three main groups: web survey software, such as SurveyMonkey; office software, such as Excel; and, specialist research data analysis software, such as Statistical Package for the Social Sciences (SPSS). If you have conducted a web survey using SurveyMonkey, then the obvious place to start is with the analysis tools offered by SurveyMonkey. These include a variety of tools to help in interrogating your data and presenting it. These tools are likely to suit your need for basic statistical reporting in profiling and descriptive research, but if you are undertaking predictive and analytical research, or want more flexibility, then you can export your web survey data to, for example, Excel or SPSS. These tools are also useful if you have print questionnaires where data needs to be entered into a software package for analysis. Your choice of software package may depend on availability, and any previous familiarity. Excel, being part of the Microsoft Office suite, is very widely available, and has a reasonable range of functions for cleaning data (such as sorting and filtering, removing duplicates, and data validation) and formulae for calculating totals, counts, percentages, means, medians, standard deviations, correlation coefficients, x 2 statistics, and frequency distributions, all accompanied by pop-up help. SPSS is a more specialist package that is a core tool for academic research and is a must for any quantitative researcher studying at doctoral level or beyond, but it is reasonably easy to learn the basics. Field (2009) and Pallant (2010) are useful step-by-step introductions to SPSS, whilst Bryman and Bell (2011) also have a useful introductory chapter on SPSS. SPSS can help you to check and verify your data, and to generate descriptive statistics and charts and graphs to describe and explore your data. It also offers a range of statistics for exploring relationships between variables. Other packages that may be useful for more advanced analysis include AMOS, an add-on to SPSS for confirmatory factor analysis and SEM, LSREL, R and Statistica. Q9. What analyses I am most likely to find useful? Due to the confines of space, this section provides only a brief outline of the key consideration regarding data analysis. Other sources that offer more detail include: Bryman and Bell (2011), Cresswell (2008), Field (2009), Ghauri and Gronhaug (2005) and Pallant (2010). Here, we briefly outline the preliminary stages needed to provide a firm basis for analysis and then briefly introduce descriptive analysis, and offer a summary of some of the available analytical statistical techniques. Before moving forward to data analysis, there are two preparatory stages to undertake: (1) Checking questionnaires for completion. With paper or e-mail questionnaires go through your questionnaires one by one and look at them. Discard any that are insufficiently completed, or where there is evidence that the respondent has not taken the completion seriously. Inevitably, there will be some questionnaires with questions that have not been answered – known as missing data. If most of the questions have been answered, in the interests of using as much information as possible, you will usually want to use the rest of the data in these questionnaires; this is OK, but it does have consequences for keeping track of the number of questionnaires used in different parts of the analysis. (2) Entering data into your chosen data analysis software. Data on paper or e-mail questionnaires need to be entered into your chosen data analysis software. Leave any responses to open questions on one side for qualitative analysis later (see below). Code the questionnaires (e.g. 1, 2, etc.) and the questions, preferably
Designing and using research questionnaires 323
MRR 37,3
324
using some mnemonic that will help you to work with the data (e.g. if you have six questions on leadership style, code them LEAD1, LEAD2, . . . , LEAD6; if you have a question “How old are you”, you might code this as AGE). Also, make sure that the questionnaires are numbered (so that you can check back later), and mark up one copy of the questionnaire with question codes. Set up a worksheet, with question/variable labels running across the row, so that data for one question runs down a column, and enter all of the responses from one questionnaire (often called a case) in one row. If it makes sense to do so, for each variable indicate the type of data that it is (check the options in the software package). You may find it useful only to enter data for, say 20 respondents, initially, and then try out some of the data analysis that you are planning to undertake, just to check that you have set up your worksheet correctly, and to gain familiarity and confidence with the software package and your data. (3) Checking and cleaning the data set. Whilst entering your data starts the familiarization process, this process continues with cleaning the data set. Data cleaning means going through the data looking for omissions or mistakes in the data, either as a result of your data entry, or arising from the questionnaire completion. For example, if one question has only two possible values, coded “1” and “2”, any other entries (e.g. “3”) in that column should not be there. Check the original questionnaire, and decide whether this is a mis-code or missing data. (4) Understanding the nature of your data. Most questionnaires have more than one type of data, which in turn means that the way in which they can be analysed varies. Data can be grouped into three categories according to their variable type: . Interval or continuous. Where the distances between the categories are identical across the range, e.g. age in years, income, number of employees, turnover. On occasions it may be useful to convert interval data to ordinal data for analysis. For example, although people may have been asked to give their age in years, we could group them, say, into those “under 25” and those “25 and over”. . Ordinal. Whose categories can be rank ordered, but where the distances between the categories are not equal across the range, e.g. if our question on number of staff does not ask for the actual number, but rather it offers tick boxes with the following categories, 0-25, 26-250, 251-1,000, this is an ordinal variable. Likert scale variables are ordinal variables, but as Bryman and Bell (2011) suggest they are often treated as internal variables for analysis. . Nominal or categorical. Whose categories cannot be rank ordered. For example, if our questionnaire asked about gender (e.g. male or female) or place of abode (e.g. Nigeria, South Africa, the USA, the UK) we have categories that cannot be ordered. Interval or ratio variables are suited to the most rigorous statistical tests (parametric), so in some sense are preferred, but the data is what it is! Descriptive statistics, other wise known as univariate analysis profile the responses from your respondents, one variable at a time; depending on the questions you have asked they may tell you their age distribution, or their attitudes towards behaviours or products. Typically the output of univariate analysis is a frequency table, or a chart
or diagram. Practitioners love this kind of profile because it helps them to understand practical things like what percentage of their customers (or at least those in a given study), for example, use their mobile phone in the process of buying a television. Academic researchers, on the other hand, are sometimes impatient with descriptive statistics in their haste to investigate relationships between variables, and find other patterns. Descriptive statistics include: totals, percentages, averages (means, modes, medians), measures of spread (standard deviations, ranges, and quartiles/deciles). These are not, in general, difficult to generate, but students often appear to have difficulty in presenting them. Table II is an extract from a table that shows the percentage of respondents who responded to each of the different levels of frequency of sharing of different types of knowledge, in a study of knowledge sharing in universities. It also includes the means for each question as a “measure of central tendency”, which, for instance, shows that all types of knowledge are shared fairly evenly, and the standard deviation, as an “measure of dispersion” or spread of the answers. Bivariate analysis focuses on the relationships between two variables. Remember that variables come in different types, interval/ratio, ordinal, and nominal, so the two variables under consideration may be the same or different types; this affects the types of analysis techniques that can be applied. Some of the options are: . Contingency tables and x 2. A contingency table or cross tabulation is essentially a frequency table with two ordinal variables; the researcher can simply look at the data and consider whether there is any relationship between the two variables. The relationship can be further investigated by conducting a x 2-test. This involves both calculating the x 2-value, and its associated level of statistical significance. . Correlation. Correlation examines the relationship between two continuous variables in terms of their covariance – in other words the extent to which one varies, when the other changes. For example, we might be interested to test whether job satisfaction was correlated with – went up (positive correlation) or down (negative correlation) with – salary. The most commonly used tests used to investigate correlation are Pearson’s r, which is used with interval/continuous variables, and Spearman’s r, which is used with ordinal variables. . Regression. Regression goes one step better than correlation, and not only shows whether there is a relationship between two variables, but develops a “line-of-best fit” of the relationship between the two variables. Depending on the level of the match (measured by a statistic called R 2), regression makes it possible to calculate and predict the value of one variable, given the value of the other.
Variables Items Knowledge K1 K2 K3 K4
type Research information and activities Teaching and learning resources and practice University processes and procedures Social and work news
Mean
SD
3.59 3.59 3.21 3.35
0.93 0.90 1.02 1.00
1
2
3
3.0 8.4 28.7 2.5 7.2 32.1 6.3 16.5 34.2 3.8 16.5 30.4
4
Designing and using research questionnaires 325
5
46.0 13.5 44.3 13.1 34.2 8.0 38.4 10.1
Table II. Summarising and presenting descriptive statisitics
MRR 37,3
326
Multi-variate analysis recognizes that in many social science and business studies, there may be a number of factors at work, and that any bivariate relationship identified between two variables may be spurious, or may explain only part of the picture if we do not understand the relationships between those two variables and the other variables in the situation. So, for example, suppose we do find a relationship between job satisfaction and salary, we might not be able to infer any kind of direct relationship; maybe people with higher salaries also have more flexible working conditions, and better working environments? In order to start to unpack some of these complexities, we need to examine the correlations and co-variances between a whole collection of variables. This is the value of multi-variate analysis, and techniques such as multiple regression, logistic regression, MANOVA, factor analysis, cluster analysis, discriminant analysis, path analysis and SEM. These techniques are beyond the scope of this article, but various sources, such as Pallant (2010) and Field (2009) offer accessible accounts of these techniques and how they can be used with the aid of SPSS. Finally, it is important to remember to make time for analyzing any open questions. The number of open questions in a questionnaire may vary considerably between studies. When questionnaires are effectively used as a substitute for interviews, and therefore contain many open questions, the emphasis will be on qualitative analysis of the text provided by the respondents. In other instances, one or a few open questions may be included to supplement a bank of closed questions. In this case, respondents may have been invited to only one or two sentences, and it is likely that some respondents will have skipped these questions, or written very little. Whatever the number of open questions and the size of the database you need to acquaint yourself with the principles and processes associated with the analysis of qualitative data. Key texts that offer useful advice on analyzing qualitative data are (Cresswell, 2007; Kvale and Brinkmann, 2008; Miles and Huberman, 1994). The key components of qualitative data analysis are: organizing the data set; getting acquainted with the data; classifying, coding and interpreting the data; and, presenting and writing up the data. The first step is to organize the data. For questionnaire data this will probably involve extracting it from the questionnaires into Word files, with either one file for each questionnaire or one file for each open question, whilst also keeping track of the questionnaire from which the data has been extracted. With a larger dataset, such as might arise from a questionnaire with many open questions, it may be appropriate to enter the data into a qualitative analysis software package, such as NVivo or ATLASti. Getting acquainted with the data involves reading it. The most common approach to interpreting textual responses to open questions is to work through question-by-question looking for key themes that recur across different respondents read the responses to a specific question, looking for any themes that recur in the responses to each question. These themes might relate to, for example, to the topics or events that respondents mention, or to the views that they express. If the size of the dataset warrants it, further analysis can be facilitated by generating a set of theme codes, which are then used to code the data. This makes is easier to draw together the various comments from different respondents but on the same theme, which provides a basis for surfacing the frequency of occurrence of themes, and any nuances in what people say about themes, and to identify some interesting quotes for inclusion in the write-up of the findings. It is important to remember that this process involves interpretation, and has
potential for researcher bias, so if possible it is good practice to invite another researcher to check the classification and coding, but at the very least to reflect on your assumptions and biases, and be appropriately tentative in making assertions. Q10. How should I present my data? Statistics are designed to “tell a story” about your participants. In order to do this effectively, they need to be reported selectively, accurately, and clearly. Some key points to consider are: (1) Converting data analysis software outputs into readable tables. Never dump tables from, say, SPSS, into a research report or thesis, without first: . Carefully considering whether any data needs to be taken out or added. . Clarifying any variable labels. . Reviewing the overall presentation and readability, including consistency with the style of the remainder of the document. (2) Number of decimal places to display. Software will often generate more decimal places than you need – try to be consistent and use common sense. For example, if your respondent group is 52, and 28 of them are women it makes no sense to claim that 53.38 percent of respondents are women – 53 percent will do. (3) Using charts and graphs. Use charts and graphs selectively, for example to add emphasis, to show trends, or to make comparisons between different types of data. Also, as far as possible, adopt a consistent style across all tables, charts and graphs. Do not: . Use a pie chart to show the size of two categories (e.g. male and female) (even though one or two of the standard research methods texts do this!). A sentence in the text will do the job. . Forget to present your actual data; you either need to put numbers on bar charts and other plots, or also show the data in a table. . Forget to offer a commentary on the tables and the most interesting things that they show. (4) Drowning in data. If you do have large datasets to report, consider placing some of the data in an appendix. The extent to which you should do this depends on your audience. In a practitioner report, managers might prefer only the headline statistics in the text, with the “evidence base” at the back, whereas in a thesis the evidence (but not necessarily all of the data) needs to be in the findings chapter. Also, in reporting the outcomes of analytical statistics tests, as well as reporting the “core” statistics, it is important to report on the outcomes of significance tests. In addition, to referring to any textbooks or manuals, it is useful to examine examples of published research in your discipline that have used the same statistical analysis technique as you have with a view to examining how they report their findings. Finally, reporting the findings from any open questions is also important. These insights, typically in the form of explanatory text accompanied by selected quotations from the questionnaires, be can reported in a separate section, or integrated with the reporting on the quantitative analyses.
Designing and using research questionnaires 327
MRR 37,3
328
5. Conclusion This article has explored the key stages in the design and use of research questionnaires. Every research is different, so it is not possible in this article to cover every eventuality, but this article should enable novice researchers to design a professional questionnaire, achieve a sufficient response rate for a thesis or small project, undertake some appropriate data analysis and present their findings in an accessible and interesting format. Along the way, the new researcher will also learn about thinking precisely, expressing questions clearly, persuading people to engage, as well as building their confidence with analyzing data. Questionnaires can generate data that provides some interesting insights. However, it is important for researchers to reflect on their limitations, and the consequent limitations of their own research. In offering an introduction to designing and using questionnaires, this article has not lingered to consider the nature of knowledge that questionnaires generate. It has, in fact adopted what Silverman (2010) describes as the positivist model of reality, in which the research process is assumed to give direct access to knowledge that already exists in the mind of the respondent. Positivism and surveys often go hand-in-hand, but it is important to remember what the numbers that the researcher has been analyzing represent, and not to succumb to the spurious assumption, that because numbers are involved, “facts” have emerged from the research. All quantitative data analyses of questionnaire data are based on the responses that a certain group of people gave to the questions on your questionnaire. Especially if you have conducted one of the more complex analytical techniques, and have, for example, found a positive correlation between two variables, such as job satisfaction and salary, it is important to re-visit the questions that you asked and the people who responded in order to appreciate and report as intelligently as possible on the findings of your study. Even more fundamentally it is important to recognize the extent to which questionnaires, let alone, the interpretation that the researcher places on their data, are a construct from the mind of the researcher. Gray (2009, p. 339) sums this up neatly: Questionnaires reflect the designer’s view of the world, no matter how objective a researcher tries to be. This is true not only for the design of individual questions, but often about the very choice of research subject. Furthermore, what we choose not to ask about may just as easily reflect our world view as what we include in the questionnaire.
Equally significantly, when respondents read your questions they will each do this from their view of the world, including their understandings, interpretations, values, views and attitudes. They will not only to varying extents interpret your questions differently to the way in which you expected, but will also interpret them in different ways to one another. They will have different level of knowledge, or give different levels of thought or consideration to the issues that you are asking about. In addition, especially with online surveys you may not know who actually completed the questionnaire. All-in-all, most results from questionnaire based surveys do not have the status of facts, but they should be fuel for an open mind, a commitment to continued enquiry and a pursuit of greater understanding. Indeed, like all research studies and in common with qualitative research methodologies, questionnaire-based surveys should not be viewed as offering the answer, but rather as a valuable tool in understanding a situation.
References Baker, M.J. and Foy, A. (2008), Business and Management Research: How to Complete Your Research Project Successfully, 2nd ed., Westburn Publishers, Helensburgh. Bryman, A. and Bell, E. (2011), Business Research Methods, 3rd ed., Oxford University Press, Oxford. Collis, J. and Hussey, R. (2009), Business Research: A Practical Guide for Undergraduate and Postgraduate Students, 3rd ed., Palgrave, Basingstoke. Cresswell, J.W. (2007), Qualitative Inquiry and Research Design: Choosing Among Five Traditions, 2nd ed., Sage, Thousand Oaks, CA. Cresswell, J.W. (2008), Research Design: Qualitative, Quantitative and Mixed Methods Approaches, 3rd ed., Sage, Thousand Oaks, CA. Denscombe, M. (2010), The Good Research Guide: For Small-Scale Social Research Projects, Open University Press, Milton Keynes. Easterby-Smith, M., Thorpe, R., Jackson, P. and Lowe, A. (2012), Management Research, 4th ed., Sage, London. Field, A. (2009), Discovering Statistics Using SPSS, 3rd ed., Sage, London. Fowler, F.J. (2008), Survey Research Methods, 4th ed., Sage, Thousand Oaks, CA. Ghauri, P. and Gronhaug, K. (2005), Research Methods in Business Studies: A Practical Guide, FT Prentice-Hall, New York, NY. Gillham, B. (2007), Developing a Questionnaire, 2nd ed., Continum, London. Gray, D.E. (2009), Doing Research in the Real World, 2nd ed., Sage, London. Kvale, S. and Brinkmann, S. (2008), Interviews: Learning the Craft of Qualitative Research Interviewing, 2nd ed., Sage, Thousand Oaks, CA. Lee, N. and Lings, I. (2008), Doing Business Research: A Guide to Theory and Practice, Sage, London. Miles, M.B. and Huberman, A.M. (1994), Qualitative Data Analysis: A Sourcebook of New Methods, 2nd ed., Sage, Thousand Oaks, CA. Oakshott, L. (2009), Essential Quantitative Methods: For Business, Management and Finance, 4th ed., Palgrave, Basingstoke. Oppenheim, A.N. (1992), Questionnaire Design, Interviewing and Attitude Measurement, 2nd ed., Continuum, London. Pallant, J. (2010), SPSS Survival Manual: A Step-by-Step Guide to Data Analysis Using SPSS for Windows, 4th ed., McGraw-Hill, London. Saunders, M.N.K., Thornhill, A. and Lewis, P. (2012), Research Methods for Business Students, 6th ed., FT Prentice-Hall, London. Silverman, D. (2010), Doing Qualitative Research: A Practical Handbook, 3rd ed., Sage, London. Sue, V.M. and Pitter, L.A. (2012), Conducting Online Surveys, 2nd ed., Sage, London. Swift, L. and Piff, S. (2010), Quantitative Methods for Business, Management and Finance, 3rd ed., Palgrave, Basingstoke. Further reading Bryman, A. (2008), Social Research Methods, 3rd ed., Oxford University Press, Oxford. Dawson, C. (2009), Introduction to Research Methods: A Practical Guide for Anyone Undertaking a Research Project, 4th rev. ed., How To Books, London.
Designing and using research questionnaires 329
MRR 37,3
330
Munn, P. and Drever, E. (2004), Using a Questionnaire in Small Scale Research: A Beginner’s Guide, The SCRE Centre, Glasgow. About the author Jennifer Rowley is a Professor of information and communications, at Manchester Metropolitan University. Her research interests embrace knowledge management, innovation, e-business and e-marketing, entrepreneurial marketing, branding, information behaviour, and management in higher education. She has an extensive experience of research supervision at undergraduate, Masters and Doctoral levels. Jennifer Rowley can be contacted at:
[email protected]
To purchase reprints of this article please e-mail:
[email protected] Or visit our web site for further details: www.emeraldinsight.com/reprints