Designing Cross-Layering Solutions for Wireless Networks: a General Framework and Its Application to a Voice-over-WiFi Scenario Fabrizio Granelli
Michael Devetsikiotis
DIT – University of Trento Via Sommarive 14, I-38050 Trento, Italy E-mail:
[email protected]
ECE – North Carolina State University Raleigh, NC 27695-7911, USA E-mail:
[email protected]
study cross-layer scheduling in wireless local area networks. As a consequence, a clear need is emerging for identifying approaches able to analyze and provide guidelines for the design of cross-layer solutions, and, even more important, to decide whether cross-layering represents an effective solution or not. To this extent, the authors partially share some of the insight provided in [14], where it is clearly underlined that cross-layering has advantages as well as limitations that should be properly considered against the more common layering approach.
Abstract— Cross-layer design has been proposed to optimize the performance of networks by exploiting the interdependency among the protocol layers. Although many articles are available in this field, no quantitative framework for the analysis of crosslayer effects and design of cross-layering solutions is available yet. This paper introduces a framework for analyzing and quantifying cross-layer interactions and for supporting the design of cross-layering techniques to optimize network performance, also including cost-benefits considerations. A case study from IEEE 802.11-based Voice over IP (VoIP) is used to illustrate the approach.
In view of the above, this paper urges the use of a formal framework to (1) identify and formalize the interactions crossing the layers of the standardized protocol stack; (2) systematically study cross-layer effects in terms of quantitative models; (3) support the design of cross-layering techniques for optimizing network performance. The presented approach, based on techniques well-known in operations research, allows one to identify correlations among different design parameters and to estimate the potential advantages (if any) deriving from enabling cross-layer interaction.
Keywords-cross-layer design, metamodeling
I.
INTRODUCTION
The layering principle has been long identified as a way to provide interoperability and ease design of telecommunication protocols (e.g., ISO/OSI and TCP/IP stacks), where each layer offers services to adjacent upper layers and requires functionalities from adjacent lower ones. Standardization of such protocol stacks enabled fast development of interoperable systems, but at the same time limited the performance of the overall architecture, due to the lack of coordination among protocols. This issue is particularly relevant for wireless networks, where the very physical nature of the transmission medium introduces several performance limitations (including time-varying behavior, limited bandwidth, severe interference and propagation environments) and thus severely limits the performance of TCP/IP – being designed for wired networks.
The structure of the paper is the following: In Section II we present our framework for cross layer protocol analysis. In Section III we describe a systematic quantitative approach to cross layer interactions, which is enhanced by introducing costbenefits considerations in Section IV. In Section V, the proposed framework is applied to a VoIP case study in a Wi-Fi cell in order to demonstrate its advantages. Finally, conclusions are presented in Section VI. II.
To overcome these limitations, a modification of the layering paradigm was recently proposed: cross-layer design, or cross-layering. The core idea is to maintain the functionalities associated to the original layers but to allow coordination, interaction and joint design of protocols crossing different layers.
The considerations that follow are valid for any layering approach. Nevertheless, the reference protocol stack is ISO/OSI as a well-formalized and widely-accepted framework for protocol standardization. In the ISO/OSI layering paradigm, a layer N entity is in relationship with layer N+1 and layer N-1 entities. To enable interaction among the entities, four messages are available: REQUEST, INDICATION, RESPONSE, and CONFIRMATION.
Several cross-layering approaches have been proposed in the literature so far [1, 2, 3, 4]. Nevertheless, no formal characterization of the cross-layer interaction among different levels of the protocol stack is available yet, with the exception of [5], where the impact of different layers is studied in order to optimize service delivery in mobile ad-hoc networks, and [6], where the authors introduced a metamodeling approach to
It is possible to model the ISO/OSI layer N entity as an object which is characterized by two arrays, representing the parameters of the object, pN, and measurements that it can
This work is jointly supported by Italian Ministry for Education, University and Research (MIUR) in the framework of the WOMEN project and by the Center for Advanced Studies in Computing and Communications, Rayleigh, NC.
0-7803-9536-0/06/$20.00 ©2006 IEEE.
CROSS LAYER PROTOCOL FRAMEWORK
1
perform, mN, and four functions enabling interaction with the layer N+1 entity. Moreover, a subset of the parameters is assumed to be controllable by layer N+1 (external), while others will be internal. In a similar way, a layer N entity can provide external measurements, or perform internal measurements. For example, TCP can produce throughput measurements as external measurements, but not the size of the congestion window, which is internal.
III.
Quantifying the effect of these interactions is very important in order to be able to systematically relate such interactions to system outcomes and be able to quantify the decision to take such interactions into account – using a costbenefit analysis, so that the benefits outweigh the cost of additional complexity and “layer violation”. This aspect has been generally neglected in the area of wireless networks, where the discussion has been mostly qualitative or architectural, assuming the more the cross-layer interactions, the better the performance.
This situation is modelled by identifying vectors p N and m as the merging of two sub-arrays representing the internal and external subsets, respectively: N
[
]
[
p N = p iN | p eN , m N = miN | meN
]
Following layering principles, the entity of layer N+1 is allowed to control the subset q N ⊂ peN of external parameters only. In addition to limiting control of higher levels to only a subset of the parameters of the lower layer, the two layers are required to be adjacent, i.e., direct interaction between layer 4 (transport) and layer 2 (data link) is forbidden.
In this section, we advocate the use of formal system modeling to express cross-layer interactions and their effect on system performance. System modeling should be based on mathematical analysis (e.g., Markov analysis, queueing or numerical approximations). However, closed form mathematical expressions are often unattainable for real systems, reinforcing the need for the use of empirical methods that include testing, emulation and computer simulation.
Cross-layer design allows more flexibility, by enabling a higher level of interaction among the entities at any layer of the protocol stack. As a consequence, layer N is enabled to control, depending on the specifics, a subset of all the parameters at any level:
[
p TOT = p 1 | p 2 | ... | p 7
Independent of the actual modelling approach employed, we propose to quantify cross layer interactions by defining factors (parameters) and effects (measurements) across layers, in a way that is common in system science and operations research. In such framework, a wireless system is assumed to be characterized by vectors of “factors” (controllable parameters), across all the layers:
]
and can acquire measurements as a subset of
[
m TOT = m 1 | m 2 | ... | m 7
]
[
p TOT = p 1 | p 2 | ... | p 7
where we assume a seven layer stack, without loss of generality.
•
]
and by performance metrics (“effects”) across all the layers:
Two classes of cross-layering can be defined: •
QUANTIFYING CROSS LAYER INTERACTIONS
The design of a cross-layer approach derives from enabling interaction among protocols operating at different layers of the protocol stack in order to provide improvement in terms of some performance metric.
(
)
ei = f i p TOT , i = 1, ..., I
Weak cross-layering: enables interaction among entities at different layers of the protocol stack; it thus represents a generalization of the adjacency interaction concept of the layering paradigm to include “non-adjacent” interactions
The sensitivity of the system response and the interactions among factors, within and across layers, can then be captured naturally by use of partial derivatives of the output with respect to the various parameters and their combinations:
Strong cross-layering: enables joint design of the algorithms implemented within any entity at any level of the protocol stack; in this case, individual features related to the different layers can be lost due to the cross-layering optimization
∂f k ∂2 fk and ∂pij ∂pij ∂plm at least over a “grid” of interesting coordinates, where pij is the i-th parameter at layer j.
As a consequence, strong cross-layering may provide higher performance at the expense of narrowing the possible deployment scenarios and increasing cost and complexity.
Using such quantitative tools, one can then (near) optimize the performance ei with respect to a subset of pTOT under general constraints by using steepest ascent, stochastic approximation, ridge analysis, stationary points, etc. [10, 11]. Alternatively, one may wish to make local steps or decisions at a given operating point, in the context of game-theoretic or other economic-driven adjustments. Or one may wish to dynamically control the response fk over time (optimal control).
In the remainder of the paper, we will assume that nonadjacent layers will be able to interact for the sake of identifying the potential benefits of the cross-layering approach, leaving out of the scope of the paper the definition of the proper signaling scheme to employ – which represents a topic for future work by the authors.
The function fk() can be analytically calculated or empirically estimated, and possibly approximated by a linear or
2
• • • • •
higher order function, depending on degree of approximation desired and the tractability of the particular system. Based on the level of interaction (for example, normalized sensitivity combined with statistical or numerical accuracy), one can subsequently assign varying degrees of “weak” versus “strong” cross layer interactions and identify to what degree a performance metric fk needs to be jointly maximized with respect to ei1 and ei2, with i1 and i2 in different layers. And, consistent with previous sections, if layers i1 and i2 are adjacent, the degree of cross layer interaction can be categorized differently from the case where i1 and i2 are further apart in the layer stack.
Analytical, numerical or simulation-based methods could be used to achieve the design goals, either up front (i.e., parameter optimization), or on-line (i.e., optimal control). In the cross layer model that we have been considering, all such approaches would be utilizing the cross layer partial derivatives described above, calculated, approximated or simulated, only now obtained for the requisite utility function U(e), or the composite “net” function U(e(D,T)) – P(D,T).
The quantitative degree of cross-layer interaction and sensitivity will also guide one to a decision of whether to actually take a specific interaction into account or not, since cross layer designs have implicit disadvantages in terms of cost and complexity. Indeed, some researchers have underlined that cross-layer design should be considered under a cautionary perspective [14], which is a concept that our proposed framework integrates and rationalizes. IV.
Performance/utility targets (e.g., U(e) > u) Resource constraints (e.g., D < d, T < t) Performance/utility maximization (e.g., max U(e)) Max-min and fairness performance targets Service level agreement satisfaction via penalty function minimization
D. System Design Results achieved during the system optimization phase are then employed to define guidelines for system design. More in detail, by employing the proposed framework, it is possible to select:
ECONOMIC CONSIDERATIONS AND SYSTEM DESIGN ISSUES
•
A. Utility The “raw” performance metrics ei will typically be further incorporated into utility functions U(e) that express better how valuable the performance metric is to the system owner or user. Examples include functions of the system throughput, overall delay or jitter, and system capacity (number of possible subscribers or streams). The utility function can have several forms and shapes (see for example, Scott Shenker’s categories and diagrams for real time, elastic and other types [9]). The exact functional form of the utility and resulting objective function are less important than their curvature (often convex to denote a certain “saturation”) and their ability to preserve a relative ordering of the engineering alternatives, to enable ultimate design decisions.
• •
the optimal operating point of the system (direct consequence of the optimization process); the proper cross-layer interactions to enable (based on sensitivity of the system); the proper signaling architecture to employ (allowing to identify the set of parameters and measurements to use). V.
A CASE STUDY: IEEE 802.11-BASED VOIP
A. System Model The following case study is employed to demonstrate our approach in a two-dimensional domain, chosen in order to provide an easy and visual interpretation of the proposed framework. Before proceeding with the details of the case study, we would like to underline that the proposed approach holds for any scenario where it is possible to build a metamodel and for different (and possibly more complex and realistic) definitions of utility and price functions.
In some cases, a “negative” version of the utility or a penalty function may instead be available with the model; this can be a function quantifying the degree of dissatisfaction resulting from a performance metric being under or over a desirable level or “service level agreement” (SLA).
In the following, we focus on the problem of determining the optimal configuration of Application and MAC layer parameters to support VoIP over 802.11 wireless LANs. The design of CAC policies or QoS-controlled VoIP over Wi-Fi applications [8] requires the analysis of several inter-dependant parameters, generally corresponding to multiple layers.
B. Prices In such a formal economic model, the controllable parameters (factors or resources) will also likely to have assigned to them actual (literal) or virtual prices, say $a per unit of design parameter X and $b per unit of Y, resulting in an overall monetary (or virtual) cost for each design pair (X, Y):
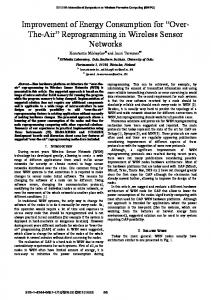
Network Model The network model in this case is shown in the Figure below. The network is an infrastructure Wi-Fi network with one AP and multiple nodes. There are N pairs of VoIP bidirectional calls at application layer. Each node carries an uplink VoIP flow to AP, and the AP carries N VoIP downlink flows for N stations. For each call, we use the ITU G711 64kbps codec [15] where frames are sent out every time interval of VoicePktIntvl ms. The 40-bytes RTP/UDP/IP Layer VoIP header is then added to each VoIP voice packet. In the MAC layer, 802.11 DCF basic access mode without RTS/CTS is used, and in the
P(X, Y) = aX + bY The function P(X, Y) can also be non-linear, accounting for volume discounts or other saturation effects. C. System Optimization Based on the utility and pricing model, the overall system design would then be affected by optimal design considerations, including
3
We set the queue size of each MAC queue to be 30 packets. For each design combination of VoicePktIntvl and DataTxRate, we actually run a series of simulation scenarios with the number of nodes or VoIP call pairs incrementally set to be from 1 to 20. Then we find the maximum number of VoIP pairs N* as the output, for which the simulated packet loss rate is less than 2% and maximum one way delay is less than 100ms.
physical layer, we use the 802.11b DSSS with variable data transmission rates of 1, 2, 5.5, and 11 Mbps.
First, we choose a first order polynomial RSM model with interactions as N*=β0+β1*VoicePktIntvl+β2*DataTxRate+ +β3*VoicePktIntvl*DataTxRate. The ANOVA results showed that the R-square of the fitted model is only 0.864488. We also fit a second model as ln(N*)= β0 + + β2ln(DataTxRate) + β1*ln(VoicePktIntvl) β3ln(VoicePktIntvl)*ln(DataTxRate), for which every variable is logarithmically transformed. The new model results in a much higher R-square value of 0.950476.
Figure 1. Wi-Fi System Illustration.
By plugging β0= -.2518396194, β1=0.4033792418, β2=0.1856925928 and β3=0.0973528574 into the model, and then taking an exponential transformation of log(N*) back to absolute values, the resulting metamodel of the VoIP capacity in an IEEE 802.11 cell is given by:
We consider results achieved in the case of a single infrastructure WiFi network that we previously analyzed in [6], following the formal, quantitative empirical approach of metamodeling [7], where our metamodel is the model of the simulation model that will be employed to study the performance of the system on a set of parameters:
N* = e-0.2518 + 0.4034 ln(T)+0.1857 ln(D)+0.0923 ln(T) ln(D) = 0.7774 T0.4034 D0.1857 e0.0923 ln(T) ln(D)
Inputs The controllable or design variables of interest are (i) the VoIP voice sample interval, and (ii) the PHY data rate: p=[p7, p2]=[VoicePktIntvl, DataRate].
where T denotes VoicePktIntvl=p7 and D denotes DataTxRate=p2 (Fig. 2). For more details on the simulation and metamodeling process, we refer the interested reader to [6].
The voice sample interval VoicePktIntvl is characterized by 10 values (between 10 and 100 ms), while the data transmission rate DataTxRate varies from 1Mbps to 11Mbps as in the IEEE 802.11b standard [16].
B. Cross-layer Sensitivity and Performance Optimization Based on the model, we proceed to quantify the sensitivity of the response e=N* on the two (cross layer) variables VoicePktIntvl and DataTxRate by calculating the derivatives:
Outputs The output response of interest, e=N*, is the maximum number of VoIP calls that can be supported in a Wi-Fi cell with satisfactory QoS metrics.
∂N * = 0.7774 ⋅ D 0.1857 ⋅ T −0.5966 ⋅ e 0.0923 ln (T ) ln ( D ) ⋅ ∂T ⋅ [0.4034 + 0.0923 ln (D )]
The simulation model is implemented in ARENA. For each combination of VoicePktIntvl and DataTxRate, we run a series of simulations with the number of VoIP calls incrementally set to be from 1 to 20. Then we find the maximum number of VoIP calls N* as the output for which the simulated packet loss rate is less than 2% and maximum one way delay is less than 100ms. The output capacity varies as the controllable input variables change. Table 1 shows the parameters, voice sample interval VoicePktIntvl and the data transmission rate DataTxRate, for our designed experiments. TABLE I.
∂N * = 0.7774 ⋅ D −0.8143 ⋅ T 0.4034 ⋅ e 0.0923 ln (T ) ln ( D ) ⋅ ∂D ⋅ [0.1857 + 0.0923 ln(T )] and, to quantify the degree of cross-layer interaction by the second order cross partial derivative:
∂2N * = 0.7774 ⋅ T −0.5966 ⋅ D −0.8143 ⋅ e 0.0923 ln (T ) ln ( D ) ⋅ ∂D∂T ⋅ [0.278 + 0.0372 ln(T ) + 0.00852 ln(T ) ln(D )]
EXPERIMENT DESIGN PARAMETERS
Factors VoicePktIntvl
Levels 10
DataTxRate
4
Figs. 3-4 present the behavior of the first-order derivatives of N*. Knowledge of such relationships allows the estimation of the impact of each of the parameters. In our case, the transmission rate D has higher impact on N* than the voice packet interval T.
Values 10, 20, 30, 40, 50, 60, 70, 80, 90, 100 1, 2, 5.5, 11
Figure 5 depicts the second-order partial derivative of N*. Since the derivative has a non-zero value, this establishes quantitatively an existing interaction between the two
4
considered parameters. Such a cross-layer relationship could be employed to design algorithms to optimize system performance. The analysis of the derivatives of the metamodel provides further insight: if the VoIP application has knowledge about the DataTxRate at the MAC layer, then it can employ the first-order derivative in Figures 3-4 to derive the optimal value for VoicePktIntvl for maximizing the number of calls, or exploit such information to decide whether a change to the VoicePktIntvl parameter is worthwhile.
In addition to providing the optimal cross-layer operating point, this method allows us to derive guidelines for the design of proper cross-layering schemes, able to maximize system performance. In this simple scenario, by comparing the two first-order derivatives ∂U/∂T and ∂U/∂D (Figs. 7 and 8, respectively) it is clear that the values of ∂U/∂T are more than one order of magnitude smaller than those of ∂U/∂D. As a consequence, it is possible to derive the following design guidelines:
Such calculations in general would have to take into account more factors, such as cost, penalty functions or service level agreements (SLA), utility functions and resource constraints on the controllable parameters.
•
In this simple scenario, N* is a monotonically increasing function of T and D, thus, the constraints determine the best combination, which is in fact (Topt, Dopt) = (100msec, 11Mbps). We consider this a “weak” interaction. Instead, if the fitted model was second order, with a non-zero interaction term, then it would necessitate the joint optimization of the two cross layer parameters, and hence a “strong” interaction.
• •
C. System Optimization and Design Guidelines We can introduce a simple utility function defined as the difference between the normalized VoIP capacity Nnorm and the cost related to guaranteeing a suitable signal-to-noise ratio to support a given data rate on the wireless channel. In this simple example, we consider such a cost to be related to the normalized channel bit-rate by a square law with respect to the rate D: ⎛ D ⎞ ⎟⎟ U ( D, T ) = N norm (D, T ) − ⎜⎜ ⎝ 11Mbps ⎠
it is more important to control the bitrate rather than the voice packet interval, since the former has a higher impact on utility value than the latter. As a consequence, power control at the WiFi base station could improve overall performance / utility; the higher the packet interval, the higher the value of the utility function, since ∂U/∂T is always positive; the system is more sensitive to jointly small values of T and D, therefore the operating point should be kept far from that region (see fig. 8) where cross dependency between the two variables is higher.
Summarizing, optimization of the proposed system requires interaction between the application layer and the MAC layer, in order to support power control within the WiFi cell, which is turn allows to control the physical data rate to select the optimal (cross-layer) operating point. The proposed solution can be considered as a “weak” crosslayering approach, since application and MAC entities can still be independently designed – they just need to interact through a proper signaling scheme.
2
VI.
We assume that, since the data rate is related to the received signal-to-noise ratio, shifting between data rates requires a power increase which follows a quadratic rule.
CONCLUSION
We have introduced a general formal framework for analyzing and quantifying cross-layer interactions and for supporting the design of cross-layering techniques to optimize network performance, including cost-benefits considerations. A case study from IEEE 802.11 VoIP is analyzed to illustrate the merits of the proposed framework. Ongoing work is aimed at testing the proposed framework in more complex scenario, and to use our approach to provide guidelines in definition of highperformance cross-layering solutions.
The corresponding function U(D,T) is presented in Figure 6, while Figures 7 and 8 depict the first-order derivative. The first-order derivative with respect to the packet rate and the second-order derivative maintain the same behavior as in subsection V.2 (see Figs. 7 and 9). We perform system optimization by setting simultaneously and across the layers [10-13]:
ACKNOWLEDGMENT
∂U (D, T ) ∂D = 0
The authors wish to thank the anonymous reviewers for their constructive comments that have significantly improved the quality of the paper.
∂U (D, T ) ∂T = 0
REFERENCES
In this case, however, the first equation has a solution on a line in the (T,D) space (see Fig. 10), while the second one is solved for a value of D outside the bounds of the problem (D=exp(-0.4034/0.0923)=0.013Mbps).
[1]
[2]
Introducing the bounds on the acceptable values and considering the granularity of the variables T and D, it is possible to determine the optimal cross-layer operating point in (Topt, Dopt) = (100msec, 5.5Mbps) (see Fig. 11). Such a point can be used to evaluate and compare the performance obtained by other cross-layering algorithms.
[3]
5
S. Toumpis and A.J. Goldsmith, “Capacity Regions for Wireless Ad Hoc Networks,” IEEE Trans. on Wireless Communications, No. 4, pp. 746748, April 2003. S. Pollin, B. Bougard, and G. Lenoir, “Cross-Layer Exploration of Link Adaptation in Wireless LANs with TCP Traffic,” Proc. IEEE Benelux Chapter on Communications and Vehicular Technology, 2003. L. Chen, S.H. Low, and J.C. Doyle, “Joint Congestion Control and Media Access Control Design for Ad Hoc Wireless Networks,” Proc. INFOCOM 2005, March 2005.
[8]
[9]
0.3
20 25
18
20
16
15
14
0.4 0.25 0.3 dN*/dT
[7]
12
10
10
5
0.2 0.2 0.15
0.1
8 0 15
0 15
6 100
10 5
40 0
datarate
0
60
80
0.1 100
10
4
5
20
40 0
datarate
pkt rate
0
60
80
0.05
20 pkt rate
Figure 3. First-order derivative of N* with respect to T.
Figure 2. Metamodel of the system capacity (N*).
3
4
0.07
0.08
2.5
3
0.06
0.06 2
d2N*/dDdT
[6]
N*
[5]
[10] G. E. P. Box and N. R. Draper, Empirical Model Building and Response Surfaces, 1987. [11] J. P. C. Kleijnen, Experimental design for sensitivity analysis, optimization, and validation of simulation models, 1998. [12] R. H. Myers and D. C. Montgomery, Response Surface Methodology: Process and Product Optimization Using Designed Experiments, 2nd edition, Wiley, 2002. [13] D. P. Bertsekas, Nonlinear Programming, Athena Scientific, 2nd edition, 1999. [14] V. Kawada, and P.R. Kumar, “A Cautionary Perspective on Cross-Layer Design,” IEEE Wireless Communications, Vol. 12, No. 1, pp. 3-11, Feb. 2005. [15] F. Ohrtman, Voice over 802.11, Artech Hose, 2004. [16] IEEE 802.11 Wireless Local Area Networks, http://grouper.ieee.org/groups/802/11/
X. Lin and N.B. Shroff, “The Impact of Imperfect Scheduling on Cross Layer Rate Control in Wireless Networks,” Proc. INFOCOM 2005, March 2005. K.K. Vadde and V.R. Syrotiuk, “Factor Interaction on Service Delivery in Mobile Ad Hoc Networks,” IEEE Journal on Selected Areas In Communications (JSAC), Vol. 22, No. 7, Sept. 2004, pp. 1335-1346. J. Hui and M. Devetsikiotis, “Metamodeling of Wi-Fi Performance,” Proc. IEEE ICC 2006, Istanbul, Turkey, June 11-15, 2006,. T.W. Simpson, J.D. Peplinski, P.N. Koch, and J.K. Allen, “Metamodels for Computer-based Engineering Design: Survey and Recommendations,” Engineering with Computers, pp. 129-130, 2001. K. Medepalli, P. Gopalakrishnan, D. Famolari, T. Kodama, “Voice Capacity of IEEE 802.11b, 802.11a and 802.11g Wireless LANs,” Proc. Globecom 2004, Dallas, U.S., Nov.29-Dec.3, 2004. S. Shenker, “Fundamental Design Issues for the Future Internet,” IEEE Journal of Selected Areas in Communication, Vol. 13, No. 7, pp. 11761188, September 1995.
dN*/dD
[4]
2 1.5 1
0.05
0.04 0.04 0.02 0.03
1
0 15 100
10 5 datarate
0 15
40 0
0
60
80
100
10
0.5
5
20 datarate
pkt rate
Figure 4. First-order derivative of N* with respect to D.
40 0
0
60
80
20 pkt rate
Figure 5. Second-order derivative of N*.
6
0.02
-3
x 10 14
0.3 0.2
0.5
0.015
12
0.1 0
0
dU/dT
U
-0.2
-0.5
10
0.01
-0.1
8 0.005
-0.3
6
-0.4 -1 15
0 15
-0.5 100
10 5
40 0
datarate
0
60
4 100
10
-0.6
80
5
-0.7
20
0
datarate
pkt rate
Figure 6. The system utility function U.
40
60
80 2
20
0
pkt rate
Figure 7. First-order derivative of U with respect to T. -3
x 10 -3
0.1
x 10
0.2
3
4 0.05
0
dU/dD
2.5
3 d2U/dDdT
0.1
0
-0.1
-0.05
-0.2 15
-0.1
2
2
1 1.5 0 15
100
10 5
40 0
datarate
0
60
-0.15
5
20
9
20
0
pkt rate
0.05
-0 .1
0.2 0
-0 .1
-0 .05
6
20
0.05 30
0.05
40
50 60 pkt rate
-0.3 -0.4
-0.8 100
-0.5
-0.1
-0.6
0.05
10
-0.2
-0.6
0 0
0
-0.1 -0.4
0
2
0 0
-0.05
5 -0 .0
3
0.1
-0.2
-0 .05
5
0.2
X: 100 Y: 5.5 Z: 0.4049
0.4
-0 .1
4
0.3
0.6
5 -0 .1
7 datarate
1
80
-0 .15
8
1
60
Figure 9. Second-order derivative of U.
dU/dD
10
40 0
datarate
pkt rate
Figure 8. First-order derivative of U with respect to D. 11
100
10
80
50 70
0.1 80
90
100
12 0 pkt rate
Figure 10. . Graphical solution to find the zero-crossing of Fig.7.
10
8
6
4
2
0
-0.7
datarate
Figure 11. Optimal (cross-layer) operation point of the system.
7