1
IJITEE, Vol. 1, No. 1, March 2017
Designing Customer Target Recommendation System Using K-Means Clustering Method Evasaria M. Sipayung1, Herastia Maharani2, Benny A. Paskhadira3 Abstract—UD Swiss is a company engaged in the field of goods distribution located in Cirebon. In achieving sales targets, customer marketing department sets customer targets to be visited based on the type and location of outlets. However, the method of targeting customers does not achieve the sales target yet due to the differences in the characteristics of purchases per product category for each type of outlet. The research in this paper focuses on the analysis and implementation of management information system to help the company gain knowledge in targeting customers based on the profile and characteristics of each customer group in doing transactions. The information system is made to load each of the knowledge generated by the analysis of customers’ characteristic using the k-means clustering. The system is designed to use the programming language “Groovy and Grails” and is built using the .NET Framework that can run on the Java platform with support of PostgreSQL as a database. Grouping customers using k-means clustering method generates groups of potential customers who are considered to be the target in the process of product sales. Customers who have an average purchase at least Rp 2,028,813.00 per transaction with the minimum purchase frequency of 25 transactions a year is a potential customer. Keywords—potential customers, k-means, clustering, knowledge.
I. INTRODUCTION Every company basically has the same goal: achieving optimal corporation profits by focusing its activities in accordance with the field of practices. UD Swiss is a distributor company in Cirebon that sells goods such as cooking oil, food / beverages, spices, and groceries. This company is already using information technology such as point of sales system that will record every sales transaction to the payment from the customer. The use of information technology in recording and fast data storing has been making the life easier for the company to collect a number of transactions that occur. Thus, it results in the collection of large amounts of data. Data collections have a bunch of useful information for the company. However, if they are not processed, then they do nothing rather than being a series of numbers. One of the information types that can be generated if the data is processed accordingly is the customer profile. That information can be used as a basis for determining the appropriate target customer in the process of selling products. It is important for the UD 1,2
Lecturer, Departemen Sistem Informasi Institut Teknologi Harapan Bangsa, Jln. Dipatiukur No. 80-84 Bandung, 40132; email:
[email protected],
[email protected]) 3 Alumnus, Departemen Sistem Informasi Institut Teknologi Harapan Bangsa, Jln. Dipatiukur No. 80-84 Bandung, 40132; email:
[email protected])
Swiss considering the company has various customers with various types of outlets. In addition, It also provides sales targets for each salesman every month including the number of visit, transactions during the visit (effective call order), the total value of all transactions (target value), and the number of new customers who make transactions (target new outlet order). As an effort to achieve the target, product selling is done by dividing territories based on each customer visit schedule. A salesman will sell products on each visit to each outlet / customer per region based on the assigned product categories. In selling products, each salesman will estimate the first visited of target customer based on his or her assumptions and experiences related to the relationship between the type and location of outlets/customer and customer preferences of each product category. The problem being faced by marketing departments is how to achieve the sales target since today, two of the four— effective call order target and the target value—have not been achieved in 2014. From a total of 900 visits per month conducted by a salesmen, only 69% or 620 transactions happen. It shows that the salesmen do not achieve the effective call order target. Moreover, the target value of each salesman per month in 2014 should be Rp 1,500,000,000; yet, the overall achievement is only 76.61%. The existence of correlation between products and sales areas allows us to know which products are often purchased in particular time. Grouping potential products and the sales area makes it possible to know the potential sales in a particular area [1], [2]. This study aims to use data mining to provide recommendations regarding the customer group based on product category by considering the profile of each group of potential customers who are considered to be a priority. II. DATA MINING A. Knowledge Discovery in Database (KDD) Data mining is part of the process of knowledge discovery in databases (KDD), which plays a role of extracting information in the data to be processed [3]. The process of KDD, as shown in Fig. 1, consists of some steps: 1) Data selection: Data selection needs to be done before extracting information begins. The result of data selection to be used for data mining process is stored in a separate part of the operational database. 2) Processing or Cleaning: cleaning the data implemented in data mining process is important. It includes dealing with
Evasaria M. Sipayung: Designing Customer Target Recommendation ...
ISSN 2550-0554 (Online)
2
IJITEE, Vol. 1, No. 1, March 2017
missing value, checking for inconsistent data, eliminating duplicate data, and correcting errors. 3) Transformation: Coding is the process of data transformation to make it correspond toward the data mining process. Coding in the knowledge discovery process is a creative process and highly dependent on the type or pattern of information in a database. 4) Data mining: Data mining is the process of searching for a pattern or interesting information using techniques or methods. Techniques, methods, or algorithms in data mining are varies. Selection of appropriate methods or algorithms depends on the purpose and overall KDD process. 5) Interpretation or evaluation: The information pattern generated from the data mining process needs to be presented in an easily understood form. This stage is called interpretation. It includes checking whether or not the patterns or information are contradictive toward the facts or existing hypotheses.
Fig. 2 Flowchart of K-Means algorithm [6].
III. DATA AND DATA ANALYSIS
Fig. 1 Knowledge Discovery in Database [4].
B. K-Means Algorithm K-Means algorithm is the most popular and widely used industrial data mining algorithm to perform clustering [5]. The algorithm is based on a simple idea. K-means clustering begins with determining how many clusters will be formed. A set of objects or the first element in the cluster is selected to serve as the center (centroid point). K-Means algorithm will repeat the process (called iteration) until stability is reached (no object can be moved): 1. Determining the coordinates of the midpoint of each cluster, 2. Determining the distance of each object coordinates toward the midpoint, and 3. Classifying these objects based on the distance. K-means algorithm flowchart is shown in Fig. 2. Distance calculation of K-means algorithm is divided into several ways, namely Euclidean distance, Mahalanobis distance, and other distance calculation techniques. K-means distance calculation usually uses Euclidean distance [4].
ISSN 2550-0554 (Online)
A. Problem Analysis One of the problems causing failure in achieving the sales target is the lack of effective methods of targeting customers based on the type and location of outlets. It carries out by every salesman and is done in every visit resulting in transaction. Apart from the method of determining the target customer, there is a potential to support targeted customer factor method applied by every salesman at the moment, which is by utilizing the transaction data into information and knowledge for the marketing department. Based on the problem, it is known that there are several characteristics of the customer related to how often they make transaction as shown in Table I. From each characteristic, grouping can be done to find out the customers’ purchase frequency level. The results can be used by marketing departments to reach effective order sales target by knowing which customer does the transactions most often. There is a different product category preference for each customer, as shown in Table II. Grouping can be done to find out any potential customer from each product preference category. The results can be used by salesman in deciding which customer to be visit first according to the categories of products handled. In Table II, there is a difference of the average value per one transaction by each customer. From each average value of purchases per transaction, it is possible to know who the potential customer is. Knowledge of potential customers based on the average purchase per transaction can also be used to determine the target customer as an effort to achieve the sales target mainly the target value of the company.
Evasaria M. Sipayung: Designing Customer Target Recommendation ...
3
IJITEE, Vol. 1, No. 1, March 2017 TABLE I WHOLESALE CUSTOMER PURCHASE FREQUENCY IN TOWN
Customer
B. Data Processing The first step of KDD process consists of: [3].
Frequency of Purchase per Product Category for 2014 Kinds Outlet of Food Location Groce Cooking Outlet Spices and oil ries beverages
GRO1 815 GRO7 558 GRO1 702 GRO6 112 GRO2 509 GRO3 542 GRO6 350 GRO4 573 GRO4 749 GRO3 712 GRO0 051 GRO3 868 GRO6 534 GRO1 795 GRO0 138 GRO2 817 GRO5 043 GRO1 993 GRO2 514 GRO4 410
Whole sale Whole sale Whole sale Whole sale Whole sale Whole sale Whole sale Whole sale Whole sale Whole sale Whole sale Whole sale Whole sale Whole sale Whole sale Whole sale Whole sale Whole sale Whole sale Whole sale Average
City
22
12
0
0
City
27
10
0
0
City
18
12
0
0
City
19
16
0
10
City
15
4
0
0
City
4
7
0
7
City
0
7
0
1
City
0
7
0
0
City
5
8
2
5
City
4
21
0
1
City
1
10
13
12
City
2
14
10
6
City
0
0
6
0
City
0
10
21
18
City
18
34
10
24
City
0
19
0
20
City
0
0
0
8
City
10
20
3
19
City
2
12
0
8
City
0
5
0
11
7.35
11.4
3.25
7.8
Based on the comparative analysis of the product category preferences and customer purchase behavior in Table I and Table II, it can be concluded that the same outlet with the same location has different customer behavior and product preferences. Therefore, what happens toward the customers cannot be generalized like what the Swiss company salesman UD has done over the years. Thus, grouping customers based on the type and location of outlets cannot be used to determine the target customer in the process of product sales.
1) Preprocessing Data (Preparing the Data Transaction): The data used are the company transaction period of January to December 2014. The steps of data preprocessing are handling of the data noise, selecting attributes, and analyzing data. a. Noise handling of data sales: There are some data that is not included in the data processing as it is considered as noise that can ruin the final results. The data noise is those transactions which has a total price of 0. This happens because the transaction is part of the sale so the price gets 100% discount, or in other words, free. Thus, the transactions data will be removed. b. Noise handling of consumer’s data: There is customer having no purchase in 2014, therefore, it is not included in the data process. After sales data and customer data cleaning, there are 1636 customers out of 2760 customers categorized as general trading outlet going to be processed in the next clustering. c. Attribute selection: There are 11 attributes in sales transaction as shown in Table III. Analysis was conducted to choose which ones can be used in the data mining process. There are four attributes to be processed using data mining techniques: • Dates of the transaction: Attribute “date” shows the frequency of purchases made by the customer in 2014. • Customer: Attribute “customer” shows sales outlets conducting transactions. • Category: Attribute “product category” shows a preference category of products from each customer by looking at frequency of purchase and the quantity of product purchased. • Qty: This attribute indicates the number of customer purchases. Qty attribute is also grouped with the product categories in the data process, so it can show the preferences of each customer making a purchase. d. Analysis of customer purchase frequency: This purchase frequency is determined by counting the number of transactions per customer, based on product category. This grouping aims to determine the preference of frequently purchased product category by each customer. Table IV is the result of frequency analysis of customer purchases processed using data mining methods. e. Analysis of the highest purchase quantity average: Highest purchase quantity average is determined by converting the quantity into the largest size unit to balance the quantity of the product, aggregating all quantities of each product, and then dividing it by the number of customer transactions with the same product. After an average quantity per product is obtained, the data then grouped by product category. This analysis is necessary to determine the preference categories of products per customer. There is a possibility that even if customer has a high level of purchasing frequency, the amount of purchase is low or vice versa.
Evasaria M. Sipayung: Designing Customer Target Recommendation ...
ISSN 2550-0554 (Online)
4
IJITEE, Vol. 1, No. 1, March 2017 TABLE II WHOLESALE CUSTOMER PROFILE WITH THE LOCATIONS IN THE CITY
Customer GRO1815 GRO7558 GRO1702 GRO6112 GRO2509 GRO3542 GRO6350 GRO4573 GRO4749 GRO3712 GRO0051 GRO3868 GRO6534 GRO1795 GRO0138 GRO2817 GRO5043 GRO1993 GRO2514 GRO4410 Mean
Kinds of Outlet
Outlet Location
Wholesale Wholesale Wholesale Wholesale Wholesale Wholesale Wholesale Wholesale Wholesale Wholesale Wholesale Wholesale Wholesale Wholesale Wholesale Wholesale Wholesale Wholesale Wholesale Wholesale
City City City City City City City City City City City City City City City City City City City City
Total Quantity Purchase per Product Category in units of Cardboard for 2014 Food & Cooking Groceries Spices Beverages Oil 22 12 0 0 27 10 0 0 18 12 0 0 19 16 0 10 15 4 0 0 4 7 0 7 0 7 0 1 0 7 0 0 5 8 2 5 4 21 0 1 1 10 13 12 2 14 10 6 0 0 6 0 0 10 21 18 18 34 10 24 0 19 0 20 0 0 0 8 10 20 3 19 2 12 0 8 0 5 0 11 7.35 11.4 3.25 7.8
f. Analysis of the ability of customers (average purchase per transaction): Analyzing the ability of the customer requires the calculation of average purchase per one transaction. Calculations done by summing (SUM) toward TOTAL_PRICE attributes of each customer divided by the number of transactions made by the customer during 2014. 2) Data transformation: After analyzing the sales data (purchases made by the customer), the data transformation is performed. Then, data transformation to divide data on a certain range by considering the amount of data in each range are set to be processed into the process of using data mining is done. The data changed is the capability of customer in doing transaction based on the average rate of purchase per customer per transaction. Table V is the result of the transformation on the data. 3) Data mining: Data mining is a process that uses statistical techniques, mathematics, artificial intelligence, and machine learning to extract and identify useful information and knowledge from a variety of large data collections [7]. The method being used is clustering. Clustering is done by following the steps in the flowchart of K-Means Clustering [6]. The result of the clustering process is best obtained by looking at the value of the smallest DB Index because the smaller the value DB Index produced the better [8]. The results of the clustering process are as follows: a. Clustering purchases frequency per product category with three clusters: Clustering process is carried out on three characteristics: frequency of purchase, highest purchase quantity average, and average purchase per transaction. Clustering process toward purchase frequency profile results in customer groups as shown in Table IV.
ISSN 2550-0554 (Online)
The average purchase per transaction 8,598.812.00 4,682,989.00 7,939,486.00 4,490,603.00 3,558,729.00 26,539,756.00 38,674,320.00 33,947,106.00 25,615,957.00 6,079,771.00 4,178,718.00 4,372,731.00 2,096,264.00 2,356,673.00 1,019,199.00 13,000,458.00 18,820,623.00 6,944,081.00 9,195,422.00 9,342,325.00 11,572,701.15
In each frequency purchase cluster profile, there are 525 customers in cluster I, 975 customers in cluster II, and 136 customers in cluster III. b. Clustering customer mapping of highest purchase quantity average with seven clusters: Clustering process is done for the average characteristics of the highest purchase quantity. Clustering process toward the average of the highest purchase quantity generates profiles of customer groups as shown in Table VI. From each highest purchase quantity average cluster profile, there are four customers in cluster I, two customers in cluster II, 15 customers in cluster III, 56 customers in cluster IV, 66 customers in cluster V, 51 customers in cluster VI, and 1,442 customer in cluster VII. c. Clustering average purchase per transaction with five clusters: Clustering process is conducted for the characteristics of an average purchase per transaction. This process generates customer group profiles as shown in Table VII. Based on cluster profiles average purchase per transaction, the characteristics of each cluster can be concluded: cluster 1 contains customers with very high average purchase per transaction with an average value of Rp 19,878,540.82, cluster 2 contains customer with high average purchase per transaction with an average value of Rp 3,404,632.82, cluster 3 contains customer with medium average purchase per transaction with an average value of Rp 1,156,779.34, cluster 4 is a group of customers with low average purchase per transaction with an average value of Rp 537,836.30, and cluster 5 is a group of customers with very low average purchase per transaction with an average value of Rp 196,095.62.
Evasaria M. Sipayung: Designing Customer Target Recommendation ...
5
IJITEE, Vol. 1, No. 1, March 2017 TABLE III SELECTION OF SALES TRANSACTION DATA ATTRIBUTES
No
Attributes
1
SO_NUMBER
2
SALESMAN_ID
3 4 5 6 7
CUSTOMER_ID DATE PRODUCT_ID CATEGORY_ID UOM_ID
8
QTY
9
PRICE
10
DISCOUNT
11
TOTAL_PRICE
Explanation Attributes of the sales invoice number. Attributes containing the salesman ID. Attributes containing customer ID. Attributes of date of transaction. Attributes of products sold ID. Attribute of type of products sold. Attribute of units of products sold. Attributes of amount / quantity of products sold. Attributes of the unit price of products. Attributes of rebates for products. Attributes of the unit price multiplied by quantity.
TABLE IV PURCHASES FREQUENCY CLUSTER PROFILE PER PRODUCT CATEGORY
Cluster 1 29 40 26 26
Category Groceries Spices Food and soft drinks Cooking oil
Cluster 2 12 20 20 19
Cluster 3 40 48 34 43
TABLE VI HIGHEST PURCHASE QUANTITY AVERAGE PROFILE CLUSTER
Cluster
1 2 3 4 5 6 7
The total average purchase price per transaction
Score 1 2 3 4 5 6 7 8 9 10 11 12
0 - 125000 125001 - 200000 200001 - 275000 275001 - 375000 375001 - 475000 475001 - 600000 600001 - 775000 775001 - 1000000 1000001 - 2000000 2000001 - 3000000 3000001 - 6000000 > 6000000 Total:
Food and soft drinks Spices Spices Cooking oil Groceries Food and soft drinks Groceries
Cluster Profile
101
High
283 126 70 96
Very high High High High
38
Average
3
Very low
TABLE VII CLUSTER PROFILE OF AVERAGE PURCHASE OF TRANSACTIONS
Cluster Cluster 1 (89 customer) Cluster 2 (141 customer) Cluster 3 (230 customer) Cluster 4 (369 customer) Cluster 5 (807 customer)
TABLE V THE AVERAGE OF PURCHASE
Attributes
Top Purchase Quantity Average (Cardboard)
Dominant categories
Minimum (Rupiah)
Average (Rupiah)
Maximum (Rupiah)
6,079,771.00
19,878,540.82
116,752,500.00
2,028,813.00
3,404,632.82
5,837,652.00
775,720.00
1,156,779.34
1,979,804.00
376,046.00
537,836.30
774,296.00
20,273.00
196,095.62
374,287.00
TABLE VIII POTENTIAL CUSTOMER PER PRODUCT CATEGORY
Data
Percentage
193 235 212 167 133 124 112 93 137 62 79 89 1636
11.80% 14.40% 13.00% 10.20% 8.10% 7.60% 6.80% 5.70% 8.40% 3.80% 4.80% 5.40% 100%
4) Interpretation/Evaluation: From the clustering process, the mapping of the clustering results of the three variables is done, namely the frequency of purchase, highest purchase quantity average, and average purchase per transaction. This mapping aims to determine the characteristics of each customer group in the transaction, so that it can assist the marketing in an evaluation of each customer group. There are 15 different combinations of frequency of purchases and the average purchase per transaction applies to each group per category. From each clustering process, a mapping of each customer group to find out the potential target groups was carried out. From the process, 188 potential customers were found, as shown in Table VIII.
Product Category Groceries Spices Snack and Soft drinks Cooking oil Total
Potential Customer 67 16 49 56 188
Percentage of potential Customer 35.64 8.51 26.06 29.79 100.00
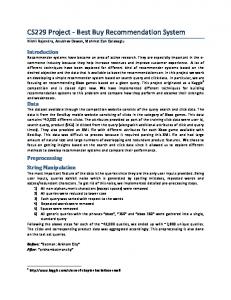
IV. SYSTEM PLANNING Solution provided to overcome the existing problems is knowledge that can help the salesmen to determine the characteristics and preferences of each group of product categories of UD Swiss customers. The grouping for each customer with the same characteristics associated with the product category of customer preference determines the target customer who should be visited first for each salesman. From the sales data, there are differences in the profiles and the purchasing power of each customer group of UD Swiss with diverse types of outlets. It proves that data mining techniques allows us to discover the unknown knowledge. From the knowledge, an information system that can load the entire knowledge identified from any data collection is needed in the next step. From the information system, the sales department is able to know the characteristics and preferences of each customer group as a basis in determining the target customers who will be visited first. Therefore, each salesman will meet the company's sales targets set. Fig. 3 shows a flowchart of Target Customer Recommendation System using the K-Means Clustering.
Evasaria M. Sipayung: Designing Customer Target Recommendation ...
ISSN 2550-0554 (Online)
6
IJITEE, Vol. 1, No. 1, March 2017
Fig. 3 The proposed system.
The system design consists of the use case diagram and Entity Relationship Diagram (ERD). Use case diagrams are shown in Fig. 4.
generated by the system. The results of ERD for Customer Target Recommendation System of UD Switzerland are shown in Fig. 5. Customer Target Recommendation System of UD Switzerland consists of seven tables that are interrelated. They are customer, customer type, marketing, sales order, the dataset sales, product, and product category.
Fig. 5 Design of ERD system. Fig. 4 Use case diagram system.
Use case diagram is composed of salesman and supervisor. Recommendation of target customer to be visited needs to be made in prior. Therefore, the activities of creating sales datasets must be carried out in advance by the supervisor. Making the dataset sales depends on the existing sales order data. ERD is used to determine any entity that is required to design a database to be applied as storage of any knowledge
ISSN 2550-0554 (Online)
V. IMPLEMENTATION The implementation of the functional design, ERD, and interfaces are created using the programming language Groovy and Grails and is built using the .NET Framework that can run on the Java platform with support of PostgreSQL as a database. The system also comes with a plugin WEKA for data processing using clustering methods.
Evasaria M. Sipayung: Designing Customer Target Recommendation ...
7
IJITEE, Vol. 1, No. 1, March 2017
V. CONCLUSIONS In conclusion, from the five criteria used to determine the profile and characteristics of the customer in the transaction using the k-means clustering: a potential customer is determined by observing the frequency of purchase, the highest purchase quantity average, and the average purchase per transaction. Potential customers based on the k-means clustering are those with average purchase per transaction at least Rp 2,028,813.00, with the minimum purchase of 25 transactions in a year. The recommendation system design based on the k-means clustering method generates 188 potential customers consisting of 35.6% for food 29.8% for cooking oil, 26.1% for food / soft drinks, and 8.5% of spices. Fig. 6 Dashboard view of potential customer.
REFERENCES [1]
[2]
[3] [4] [5] [6]
Fig. 7 Customer potential report.
The main function of this system is to give recommendations regarding the customer who becomes the main target in the process of selling products based on the characteristics in the transaction at a certain period. Fig. 6 shows a graphic of customers considered as potential targets per product category. Fig. 7 is a customer target report display divided by the day of visit.
[7] [8]
Sipayung E.M., Fiarni Cut, Tanudjaya R., “Decision Support System for Potential Sales Area of Product Marketing using Classification and Clustering Methods”, Proceeding International Seminar on Industrial Engineering and Management, 2015, pp. 33-39. Sipayung E.M., Fiarni Cut, Tanudjaya R., “Modeling Data Mining Dynamic Code Attributes with Scheme Definition Technique”, Proceeding Electrical Engineering, Computer Science and Informatics, 2014, pp. 25-28. Larosse, Daniel T., Discovering Knowledge in Data: An Introduction to Data Mining, Wiley-Interscience, 2005. Kusrini and Lutfi E.T., Algoritma Data Mining, Yogyakarta, Indonesia: Andi, 2009. Pavel, Berkhin, Survey on Clustering Data Mining Techniques. San Jose, CA: Accrue Software, 2002. M. Kaur and U. Kaur, “Comparison Between K-Means and Hierarchical Algorithm Using Query Reduction,” International Journal of Advance Research in Computer Science and Software Engineering, Vol. 3, No. 7, pp. 1454-1459, 2013. E. Turban, J. E. Aronson, and L. P. Ting, Decision Support System and Intelligent System, New Jersey: Pearson Education, Inc, 2005. Davies, David L., Donald W. Bouldin, “Cluster Separation Measure”. IEEE Transactions on Pattern Analysis and Machine Intelligence, 1(2), 95-104, 2013.
Evasaria M. Sipayung: Designing Customer Target Recommendation ...
ISSN 2550-0554 (Online)