18]. Since successful tracking relies heavily on accurate object detection, the evaluation of object detection algo- rithms within a surveillance systems plays an ...
Designing Evaluation Methodologies: the case of motion detection N. Lazarevic-McManus, J. Renno, D. Makris and G.A. Jones Digital Imaging Research Centre, Kingston University, Penrhyn Road, Kingston upon Thames, Surrey, UK KT1 2EE www.kingston.ac.uk/dirc
Abstract Motion detection is a fundamental processing step in the majority of visual surveillance algorithms. While an increasing number of authors are beginning to perform quantitative comparison of their algorithms, most do not address the complexity and range of the issues which underpin the design of good evaluation methodology. In this paper we explore the problems associated with optimising the operating point of detection algorithms and objective performance evaluation. A motivated and comprehensive comparative evaluation methodology is described and used to compare two motion detection algorithms reported in the literature.
1. Introduction Motion detection is a fundamental processing step in the majority of visual surveillance algorithms. Motion detection algorithms aim to detect moving objects whilst suppressing false positives caused by lighting changes, moving background, shadows and ghosts. Sudden lighting conditions are particularly problematic for motion detection algorithms. Compounded by the compensating response taken by most cameras, the result is a significant change in both intensity and colour. While an increasing number of authors are beginning to perform quantitative comparison of their algorithms, most do not address the complexity and range of the issues which underpin a good evaluation methodology. Such issues include the distinction and relative merits of pixel-based versus object-based metrics; the motivation of appropriate metrics; the impact of defining the end application; making explicit evaluation parameters and selecting appropriate values; and the role of ROC optimisation of algorithms. In this paper we review the performance evaluation literature, discuss some of the more complex issues, and propose a motivated and comprehensive comparative evaluation methodology based on ROC optimisation and a proposal for standardised end-user applications as context.
2. Previous Work A number of techniques have been proposed dedicated to performance analysis of visual surveillance algorithms. Many of them deal with evaluation of detection of moving objects [1, 2, 3, 4, 5, 6, 7, 8, 9, 10, 11, 12], whereas others address evaluation of the tracking of detected objects throughout the video sequence or both[13, 14, 15, 16, 17, 18]. Since successful tracking relies heavily on accurate object detection, the evaluation of object detection algorithms within a surveillance systems plays an important part in overall performance analysis of the whole system. Ground Truth Evaluation based on GT offers a framework for objective comparison of performance of alternate surveillance algorithms. Such evaluation techniques compare the output of the algorithm with the GT obtained manually by drawing bounding boxes around objects, or marking-up the pixel boundary of objects, or labelling objects of interest in the original video sequence. Manual generation of GT is an extraordinarily time-consuming and tedious task and, thus, inevitably error prone even for motivated researchers. (See List et al[19] for an interesting study on inter-observer variability in this context.) Black et al recently proposed the use of a semi-synthetic GT where previously segmented people or vehicles are inserted into real video sequences[13]. Interpretation of evaluation results is obviously based on the type of GT used for comparison. However, established standards for GT are only just emerging. There are several ambiguities involved in the process of GT generation. For example, whether to account only for individual objects or also for groups of objects, or whether to look at the bounding boxes or exact shapes of objects. Several GT generation tool are available: ViPER[5], ODViS[16], CAVIAR[20]. Standardisation of datasets has been championed by PETS. Nationally funded initiatives currently preparing datasets include the French ETISEO project1 and the UK Home Office iLIDS project2 . 1 www.silogic.fr/etiseo/ 2 http://scienceandresearch.homeoffice.gov.uk/hosdb/news-
Common Performance Metrics Performance evaluation algorithms based on comparison with ground truth can be further classified according to the type of metrics they propose. Typically, ground-truth based metrics are computed from the true positives (TP), false positives (FP), false negatives (FN), and true negatives (TN), as represented in the contingency table below. Output Class Fore Back
True Class Foreground Background True Positives (TP) False Positives (FP) False Negatives (FN) True Negatives (TN) Table 1: Contingency Table
For pixel-based metrics FP and FN refer to pixels misclassified as foreground (FP) or background (FN) while TP and TN account for accurately classified pixels[2, 3, 4, 7, 14, 17, 13]. Usually, they are calculated for each frame and an overall evaluation metric is found as their average over the entire video sequence. For object-based metrics TP refers to the number of detected objects sufficiently overlapped by GT, FP to the number of detected objects not sufficiently overlapped by the GT, and FN to the number of GT objects not sufficiently covered by any automatically detected objects[6, 15, 11]. (Note that this degree of ovelap is a parameter of the evaluation process.) Some authors combine both types[5]. Furthermore, a number of methods evaluate individual objects by weighting misclassified pixels according to their impact on the quality of segmented object[1, 8, 9, 10, 12] - in essence, pixel-based methods. Typical metrics computed per-frame or per-sequence are the true positive rate (or detection rate) tp , false positive rate fp , false alarm rate fa and specificity s tp fa
NT P , NT P + NF N NF P = , NT P + N F P
=
fp sp
NF P , NF P + NT N NT N = NF P + NT N =
(1) (2)
where NT P , NF P , NT N and NF N are the number of pixels or objects identified as true positives, false positives, true negatives and false negatives respectively. In some applications (e.g. facial identification) competing algorithms are presented with images which contain known clients and imposters. For object-based motion detection evaluation, there is no equivalent prior set of known imposters ı.e. false objects in the ground truth! Thus, as it is not possible to identify true negatives, the false positive rate cannot be computed. The great majority of proposed metrics are restricted to pixel-level discrepancy between the detected foreground events/270405
and the ground-truth - namely false positive and false negative pixels. These metrics are useful to assess overall segmentation quality on a frame-by-frame basis but fail to provide an evaluation of individual object segmentation. Often these measures are normalised by image size or the amount of detected change in the mask[10], or object relevance[1]. However, the more principled approach is based on Receiver Operating Curves (ROCs). Evolved to characterise the behaviour of binary classifiers, ROC curves plot true positive rate against false positive rate to facilitate the selection of optimal classification parameters and compare alternative classification techniques[3, 6]. An ROC graph is an alternative presentation to plotting metrics for each frame in the sequence which is often difficult to assess by a reader[9].
Other Performance Metrics All pixel-based methods which evaluate individual object segmentation rely on existence of shape-based ground-truth mask generated by costly process if they are to avoid errors. In addition to the advantage of avoiding hand labelling individual foreground pixels in every frame, object-based methods only require ground-truth in the form of boundingboxes[6, 15, 11]. The object-level evaluation proposed by Hall et al[11] plots detection rates and false alarm rates using various values of overlap threshold to determine association with the GT. As they do not have true-negatives, false alarm rate is computed as alternative to false positive rate and the area under the curve is used as a measure of performance. Other object-based metrics proposed are based on the similarity of detected and ground-truth objects i.e. relative position[16, 11] or shape, statistical similarity and size[1, 11]. A major problem in motion detection is the fragmentation and merging of foreground objects. While these will impact on pixel-based metrics, a number of explicit metrics have been proposed[6, 5]. Typically these measure the average number of detected regions overlapping each groundtruth object and average number of ground-truth objects associated with multiple detected regions. Metrics may also be designed to take account of human perception of error where false positives and false negatives hold different levels of significance by introducing weighting functions for misclassified pixels on an object-by-object basis[8, 10]. Villegas and Marichal[8] increase the influence of misclassified pixels further from the boundary of ground-truth objects. Cavallaro et al[10] account for temporal effects of surprise and fatigue where sudden changes in quality of segmentation amplifies error perception.
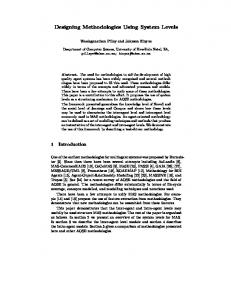
Figure 1: Evaluation Dataset
3. Evaluation Methodology We develop an evaluation methodology in which we compare the well-known Stauffer and Grimson algorithm [21] with a recently published algorithm [22]. This latter technique focuses on handling rapid lighting variations based on the observation that these global changes give rise to correlated changes in UV. A search region for constraining these colour changes is controlled by the global mean colour difference of the frame.
3.1. Dataset and Ground Truth The dataset consists of 8210 frames recording activities in a car park at full frame-rate covering a period of five and a half minutes. (Example frames shown in Figure 1.) The CCTV camera has iris auto-correction and colour switched on. The video sequence includes a total of 24 moving objects, people and vehicles appearing at close, medium and far distances from the camera. There are a variety of both gradual and sudden lighting changes present in the scene due to English weather conditions (bright sunshine interrupted by fast moving clouds, reflections from windows of vehicles and buildings). There are both static and dynamic occlusions present in the scene with moving objects crossing paths and disappearing partly or totally behind static objects. In addition, a strong wind causes swaying trees and bushes to disturb the background. The ground truth is generated manually (by one person) using an in-house semi-automatic tool for drawing bounding boxes for every target within each frame of the video sequence. Ground truth provides the temporal ID of the object, its bounding box enclosing pixels of interest, defines the type of the object whether person or vehicle, and defines the degree of occlusion with other objects i.e. unoccluded, semi-occluded or fully-occluded.
3.2. ROC-based Analysis Receiver Operating Curves (ROC) are a useful method of interpreting performance of a binary classifier. ROC curves
graphically interpret the performance of the decisionmaking algorithm with regard to the decision parameter by plotting the True Positive Rate (tp ) against the False Positive Rate (fp ). Each point on the curve is generated for the range of decision parameter values - see Figure 2(a). In foreground detection, such decision parameters could be a threshold on the greylevel difference between incoming pixel and reference pixel, or a threshold on the size of any foreground object. When there is more than one classification parameter, a distribution of points representing all parameter value combinations is generated in the ROC space. The required ROC curve is the top-left boundary of the convex hull of this distribution as shown in Figure 2(b).
(a) Single Classification Parameter (b) Multiple Parameters
Figure 2: Generating ROC Curves In general the optimal operating point is chosen in the top left quadrant of the ROC space and is defined as the classification parameter value on the iso-performance line with the lowest misclassification cost. The gradient λ of this line is defined as λ=
(1 − PT ) CF P PT CF N
(3)
where PT is the prior probability of a foreground pixel (or object), and CF N and CF P are the cost of classifying a moving pixel (or object) as stationary and vice versa. Misclassification costs depends on the intended application of motion detection (e.g. tracking, counting people, alarming,
detecting a specific person, etc) and the ratio of foreground pixels (or objects) to background in the GT. Points on the graph lying above-left of the line have a lower misclassification cost while points below-right of the line have larger costs. The misclassification cost C at the operating point t∗p , fp∗ is given by C(t∗p , fp∗ ) = (1 − PT )CF P fp∗ + PT CF N (1 − t∗p )
Ground Truth input
Algorithm
segmentation results
Algorithm Parameters
metrics
Evaluation Method
Evaluation Parameters
(4) Figure 3: Typical performance evaluation system
Cost Scenarios To explore the effect of the cost ratio, we shall introduce two different cost scenarios: the Ticket Fraud scenario in which, say, the cost of detaining an innocent member of the public CF P is defined as double the cost of failing to catch a ticket fraudster CF N ; and the Evidence Gathering scenario in which the cost of video-ing an innocent passerby CF P is, say, 10 times smaller than the cost of failing to video a terrorist bomber CF N 3 . The relative costs are arbitrary, and the relationship of these applications to motion detection is indirect. However, these different cost ratio scenarios ensure we are mindful of the ultimate application in the evaluation stage. (Obviously defining the social costs of violations of libertarian and public safety concepts is extremely fraught!) Evaluation Parameters Typical performance evaluation takes the output of some visual surveillance algorithm and compares it with ground truth data - as illustrated in Figure 3. The performance of any surveillance algorithm will depend on the choice of the internal parameters. Optimal performance is typically determined using the ROC methodology discussed above. Crucially, however, the result will also depend on the inevitable array of parameters required by the evaluation module e.g. the degree of overlap between the detected moving regions and the ground truth objects. How would you select appropriate values for these? A naive approach would be to include these evaluation parameters within the ROC methodology to select the optimal algorithm and evaluation parameter values. However, the result would be to evaluate each alternative surveillance algorithm with a different evaluation algorithm. Hardly an objective comparison! Furthermore, the ROC methodology does not apply at object-level where true negatives are not available. We explore the issue of optimisation at various stages of a typical evaluation system.
3.3. Proposed Metrics In pixel-based performance analysis, the label of each pixel (TP, FP, FN, and TN) is defined as follows: detected foreground pixels inside the GT bounding box (TP), detected 3 This
must also capture the storage and post-event search costs
foreground pixels outside the GT bounding box (FP), detected background pixels inside the GT bounding box (FN) and detected background pixels outside the GT bounding box (TN). As the ground-truth is only specified to the level of the bounding box, true-positive rates do not reach 100%. ROC Analysis and Classification Costs: ROC analysis will be performed for each presented algorithm to identify optimal parameters (irrespective of published values) for the proposed Ticket Fraud and Evidence Gathering scenarios. The Classification Cost (Cost) at these operating points for each scenario will be recorded per algorithm. Signal Rate: The signal rate sr provides an insight into the localised quality of segmented objects, and is defined as sr =
NT P NT P + NF∗ P
(5)
where NT P is the number of detected pixels within the bounding boxes of the ground truth, and NF∗ P represents any false positives that have pixel connectivity to the ground-truth. The behaviour of this metric is illustrated in Figure 4. Rather than measure the global signal confusion, tthis version attempts to measure the degree of local confusion surrounding detected objects.
Figure 4: SNR Metric: (Left) Original with GT, (Middle) Detected Blobs (Right) Connected false positives Specificity: During sudden lighting changes, the detection method should ideally avoid classifying large parts of the image as foreground. Many metrics do not necessarily capture this behaviour as the number of true positive pixels paradoxically increases. The Specificity metric (see equation 2) essentially measures the number of background pixels which remain background, and hence drops dramatically if the detection method fails to cope with light changes.
To motivate the selection of appropriate object-based metrics, we note that motion detection is usually followed by a blob tracker to establish the temporal history of any detected object. The performance of this tracker will depend crucially on (i) the proportion of true objects located, (ii) the degree of local confusion caused by falsely detected objects, and (iii) the degree of fragmentation of true objects. Object-based metrics pose a problem which does not arise for pixel-based metrics: establishing the correspondence between GT objects and the inevitably fragmented, merged and displaced detected blobs - particularly problematic as the density of objects rises and in the presence of noise objects. Following a typical approach, we use the degree of overlap between detected objects and GT bounding boxes to establish this correspondence. In general, this can result in one-to-many and many-to-one relationships. Thus the number of true positions NT P and false negatives NF N can be larger than the number of ground truth objects N i.e. N T P + NF N ≥ N . In object-based performance analysis, the label of each object (TP, FP, and FN) is defined as follows. A TP is a detected foreground blob which overlaps a GT bounding box, where the area of overlap is greater than a proportion Ωb of the blob area and greater than a proportion Ωg of the GT box area. A FP is a detected foreground object which does not overlap a GT bounding box. Finally, a FN is a GT bounding box not overlapped by any detected object. Note there are no definable true negatives for objects. Object Detection Rate: Object detection rate (or true positive rate) measures the proportion of ground-truth objects correctly detected - see equation 1. False Alarm Rate: False alarm rate (equation 2) determines the degree to which falsely detected objects (FP) dominate true objects (TP). In fact, tracking processes can robustly ignore most false objects but are especially vulnerable to false objects located near the position of the true object. We therefore redefine our false alarm rate as follows fa =
NF∗ P NT P + NF∗ P
(6)
where NF∗ P is a count of falsely detected objects near to true objects. The degree of proximity ω is of course an evaluation parameter which requires determining. Fragmentation Rate: Fragmented targets present a subsequent tracker with the opportunity to incorrectly update a trajectory and subsequently fail to locate any observations. Our fragmentation rate φ measures the number of observed blobs assigned as TP per GT object. False negative objects are not included in this metric. Thus φ=
NT P N − NF N
(7)
Scenario τB τS Updating αµfast fast αΣ αµslow slow αΣ Thresholding τA τAmin γA
Evidence Gathering 0.60 0.60 Adaptive 1.0 × 10⁻² 1.0 × 10⁻⁴ 5.0 × 10⁻³ 2.5 × 10⁻⁵ Constant 25 -
Ticket Fraud 0.975 0.975 Adaptive 2.0 × 10⁻³ 4.0 × 10⁻⁶ 1.0 × 10⁻³ 1.0 × 10⁻⁶ Linear 50 3
Table 2: Optimal Operating Points Scenarios Ticket Fraud Evidence Gathering
Renno et al 0.0185 2.483
Stauffer 0.0177 2.320
Table 3: Classification Costs where N is number of GT objects and NF N the number of GT objects without supporting detected blobs.
4. Optimising the Detection Algorithm Every algorithm has a variety of algorithm parameters whose optimal values must be identified. The Renno et al method has the parameters shown in Table 2. This section will determine the optimal parameter set for this motion detection algorithm using the ROC methodology described in Section 3.2 applied to both the Ticket Fraud and Evidence Gathering scenarios. Using the metrics defined in Section 3.3, the optimised method will then be compared in Section 5 to the Stauffer and Grimson method[21]. Figure 5 presents the ROC space populated with tp , fp pairs for all evaluated combinations of algorithm parameters for the Renno et al algorithm. Currently the search range of each parameter is evenly sampled seven times. Each of these points is evaluated using equation 4 to identify the optimal parameter set for the two scenarios. Optimal parameter values are reported in Table 2 for each scenario.
5. Comparative Evaluation The optimised versions of the Renno et al algorithm are now compared with the Stauffer and Grimson method[21]. ROC analysis is also used to optimise the parameters of the Stauffer and Grimson for the two scenarios - see Figure 6. Compared to the Renno et al algorithm, the Stauffer and Grimson implementation performs a little better for both scenarios. The classification costs of the algorithms are presented in Table 3.
Metric SR Spec
Evidence Gathering Renno Stauffer 0.897 0.788 0.858 0.787
Ticket Fraud Renno Stauffer 0.965 0.884 0.963 0.988
Table 4: Comparison of Pixel-based Metrics Metric DR FAR FR
Evidence Gathering Renno Stauffer 0.993 0.986 0.931 0.951 2.286 1.581
Ticket Fraud Renno Stauffer 0.942 0.940 0.184 0.242 3.623 2.931
Table 5: Comparison of Object-based Metrics Figure 5: Determining Operating Points: Renno et al
Figure 6: Determining Operating Points: Stauffer and Grimson To gain more insight, let us turn to the metrics displayed in Tables 4 and 5. The Evidence Gathering version of the Renno et al method and the Stauffer and Grimson exhibit similar performance. About 99% of objects are located. From the localised FAR metric, each detected object has between fifteen and twenty surrounding noise blobs, and is often fragmented into one to two blobs. The Ticket Fraud does exhibit lower detection rates (≈ 94%) and an increased tendency for blob fragmentation. However, the amount of local confusion is very low - ideal for subsequent blob tracking purposes. Even more significant, however, is the Specificity metric which demonstrates the ability to successfully cope with the sudden, frequent and large lighting variations contained in the dataset.
6. Impact of Evaluation Parameter ROC analysis offers a solution for operating point optimisation using pixel-based metrics and misclassification cost constraints. However, the foreground/background pixel classification does not provide sufficient insight into the
quality of detected blobs, and their impact on the subsequent tracking and application processes. Ideally, we want to use object-based evaluation metrics to select the optimal OP. However, these metrics are likely to depend on the choice of evaluation parameters - in our case the overlap threshold parameters. This dependency is illustrated in Figures 7 and 8. We have two evaluation parameters as defined in Section 3.3: the ground truth overlap threshold Ωg and the blob overlap threshold Ωb . In Figure 7 we explore the sensitivity of the object-based evaluation metrics (DR, FAR, FR) to the choice of blob overlap threshold while holding fixed the ground truth overlap threshold. Conversely, in Figure 8 we explore the sensitivity of the evaluation metrics to the choice of ground truth overlap threshold while holding fixed the blob overlap threshold. In each case we explore this sensitivity for the operating points of the Ticket Fraud and Evidence Gathering scenarios. In Figure 7 for both scenarios the evaluation metrics do not depend on the overlap threshold Ωb provided this threshold is less than 50% of the blob area. The dependency on Ωg is more complicated. Figure 8 shows that the evaluation metrics produced for the Evidence Gathering do not significantly depend on Ωg for thresholds less than 10% of the ground truth area. On the other hand, the evaluation metrics produced for the Ticket Fraud have a significant dependency on the threshold Ωg .
7. Conclusions The primary purpose of this paper was to expose the surprisingly complex issues that arise when creating a welldesigned evaluation methodology. The specific evaluation issues we explored were: good motivation of appropriate metrics; the distinction and relative merits of pixel-based versus object-based metrics; the need to define standardised application scenarios to provide context; the inevitable existance of evaluation parameters and the need to select ap-
FAR
DR
0.8 0.6
1
3
0.8
2.5 2
0.6 FR
1
0.4
1.5 1
0.4
0.2
0.2 0.001
0.01
0.1
0 0.001
1
0.5 0.01
0.1
0 0.001
1
0.01
Overlap Threshold :o
Overlap Threshold :o
0.1
1
Overlap Threshold :o
1
1
3
0.8
0.8
2.5
0.6
0.6
0.4 0.2
2 FR
FAR
DR
Figure 7: (b) Varying Overlap Threshold Ωb (Evidence Gathering solid line, Ticket Fraud dotted line)
1
0.2
0 0.0001
0.001
0.01
0.1
1
1.5
0.4
0 0.0001
Overlap Threshold :g
0.5 0.001
0.01
0.1
0 0.0001
1
0.001
Overlap Threshold :g
0.01
0.1
1
Overlap Threshold :g
Figure 8: (a) Varying Overlap Threshold Ωg (Evidence Gathering solid line, Ticket Fraud dotted line) Ground Truth input
Detection
Detection Parameters
segmentation results
Tracking
tracking results
Tracking Parameters
metrics
output
Application
Evaluation Method
Application Parameters
Evaluation Parameters
Figure 9: Evaluating Motion Detection based on application results propriate values; and the role of ROC optimisation of algorithms. An evaluation methodology provides a mechanism for both comparison and algorithm optimisation, i.e. the selection of optimal algorithm parameters. Dependency of the operating point on both algorithm parameters and evaluation parameters presents an additional difficulty to the problem of designing an efficient evaluation methodology. A well-designed evaluation method should avoid this dependency. ROC optimisation is only applicable at pixel level. The absence of true negatives makes it impossible to use at object-level. Further investigation is needed to show whether ROC optimisation might be practical further down the evaluation pipeline - as shown in Figure 9. In the future we intend to address some of the current weaknesses: comparison with more methods reported in the
literature; a bigger range of datasets; and the need to evaluate motion segmentation by its impact on the performance of subsequent processing stages. We have illustrated the effectiveness of our object-based evaluation metrics and our approach based on scenarios by comparing two previously reported motion detection algorithms: Stauffer and Grimson[21] and Renno et al[22]. Though more computationally demanding, the Stauffer and Grimson algorithm has a greater capacity to represent multimodal greylevel PDFs. However, sudden lighting conditions (and camera compensation) are not modelled well by a set of modes. Rather they are a dynamic process involving correlated changes in U,V. Although unimodal, the Renno et al method models the possible UV variations using a measure of the global colour content of the frame. Though
explicitly optimised for specific application scenarios, the method performs well compared to the Stauffer and Grimson algorithm.
References [1] P. Correia and F. Pereira. ”Objective Evaluation of Relative Segmentation Quality”. In IEEE International Conference on Image Processing, pages 308–311, Vancouver, Canada, September 10-13 2000. [2] L. Di Stefano, G. Neri, and E. Viarani. “Analysis of PixelLevel Algorithms for Video Surveillance Applications”. In 11th International Conference on Image Analysis and Processing, ICIAP2001, pages 542–546, September 26-28 2001. [3] X. Gao, T.E. Boult, F. Coetzee, and V. Ramesh. “Error analysis of background Adaption”. In IEEE Conference on Computer Vision and Pattern Recognition, pages 503–510, 2000. [4] E.D. Gelasca, T. Ebrahimi, M.C.Q. Farias, M. Carli, and S.K. Mitra. “Towards Perceptually Driven Segmentation Evaluation Metrics”. In CVPR 2004 Workshop (Perceptual Organization in Computer Vision), page 52, June 2004. [5] Vladimir Y. Mariano, Junghye Min, Jin-Hyeong Park, Rangachar Kasturi, David Mihalcik, Huiping Li, David S. Doermann, and Thomas Drayer. “Performance Evaluation of Object Detection Algorithms”. In 16th International Conference on Pattern Recognition (ICPR), volume 2, pages 965– 969, 2002. [6] J. Nascimento and J. S. Marques. “New Performance Evaluation Metrics for Object Detection Algorithms”. In IEEE Workshop on Performance Analysis of Video Surveillance and Tracking (PETS’2004), May 2004. [7] P. Villegas, X. Marichal, and A. Salcedo. “Objective Evaluation of Segmentation Masks in Video Sequences”. In Workshop on Image Analysis for Multimedia Interactive Services (WIAMIS’99), pages 85–88, May 1999. [8] P. Villegas and X. Marichal. “Perceptually Weighted Evaluation Criteria for Segmentation Masks in Video Sequences”. IEEE Transactions on Image Processing, 13(8):1092–1103, August 2004. [9] J. Aguilera, H. Wildernauer, M. Kampel, M. Borg, D. Thirde, and J. Ferryman. Evaluation of Motion Segmentation Quality for Aircraft Activity Surveillance. In Joint IEEE International Workshop on Visual Surveillance and Performance Evaluation of Tracking and Surveillance, Beijing, October 15-16 2005. [10] A. Cavallaro, E.D. Gelasce, and T. Ebrahimi. Objective Evaluation of Segmentation Quality using Spatio-Temporal Context. In IEEE International Conference on Image Processing, page 301304, September 2002. [11] D. Hall, J. Nascimento, P. Ribeiro, E. Andrade, and P. Moreno. Comparison of target detection algorithms using adaptive background models. In Joint IEEE International
Workshop on Visual Surveillance and Performance Evaluation of Tracking and Surveillance, Beijing, October 15-16 2005. [12] C.E. Erdem and B. Sankur. “Performance Evaluation Metrics for Object-Based Video Segmentation”. In X European Signal Processing Conference (EUSIPCO), September 4-8 2000. [13] J. Black, T.J. Ellis, and P. Rosin. “A Novel Method for Video Tracking Performance Evaluation”. In IEEE Workshop on Performance Analysis of Video Surveillance and Tracking (PETS’2003), pages 125–132, October 2003. [14] C.E. Erdem, A.M. Tekalp, and B. Sankur. “Metrics for performance evaluation of video object segmentation and tracking without ground-truth”. In IEEE International Conference on Image Processing (ICIP), October 7-10 2004. [15] B. Georis, F. Bremond, M. Thonnat, and B. Macq. “Use of an Evaluation and Diagnosis Method to Improve Tracking Performances”. In IASTED 3rd International Conference on Visualization, Imaging and Image Processing, September 810th 2003. [16] C. Jaynes, S. Webb, M. Steele, and Q. Xiong. “An Open Development Environment for Evaluation of Video Surveillance Systems”. In IEEE Workshop on Performance Analysis of Video Surveillance and Tracking (PETS’2002), June 2002. [17] T. Schlogl, C. Beleznai, M. Winter, and H. Bischof. “Performance evaluation metrics for motion detection and tracking”. In 17th International Conference on Pattern Recognition (ICPR), volume 4, pages 519–522, August 23-26 2004. [18] H. Wu and Q. Zheng. “Self-evaluation for video tracking systems”. In Proceedings of the 24th Army Science Conference, November 2004. [19] Thor List, Jos Bins, Jose Vazquez, and Robert B. Fisher. “Performance Evaluating the Evaluator”. In IEEE Joint Workshop on Visual Surveillance and Performance Analysis of Video Surveillance and Tracking (VS-PETS 2005), 1516th October 2005. [20] R. Fisher. Caviar - context aware using image-based active recognition. http://homepages.inf.ed.ac.uk/rbf/CAVIAR.
vision In
[21] C. Stauffer and W.E.L. Grimson. “Adaptive background mixture models for real-time tracking.”. In IEEE Computer Society Conference on Computer Vision and Pattern Recognition(CVPR’2000), pages 246–252, Fort Collins, Colorado, June 23-25 1999. [22] J. Renno, N. Lazarevic-McManus, D. Makris, and G.A. Jones. “Evaluating Motion Detection Algorithms: Issues and Results”. In IEEE International Workshop on Visual Surveillance, pages 97–104, Graz, Austria, May 13 2006.