Utah State University
DigitalCommons@USU The Instructional Architect Research Group
Research Centers
2011
Designing For Problem Based Learning: A Comparative Study Of Technology Professional Development Andrew Walker Utah State University
Mimi Recker Utah State University
Brooke Robertshaw Utah State University
Jeffrey Olsen Utah State University
Linda Sellers Utah State University
Heather Leary Utah State University
Follow this and additional works at: http://digitalcommons.usu.edu/iagroup See next page for additional authors
Part of the Educational Assessment, Evaluation, and Research Commons, and the Teacher Education and Professional Development Commons Recommended Citation Walker, Andrew; Recker, Mimi; Robertshaw, Brooke; Olsen, Jeffrey; Sellers, Linda; Leary, Heather; Kuo, Yu-Chun; and Ye, Lei, "Designing For Problem Based Learning: A Comparative Study Of Technology Professional Development" (2011). The Instructional Architect Research Group. Paper 7. http://digitalcommons.usu.edu/iagroup/7
This Article is brought to you for free and open access by the Research Centers at DigitalCommons@USU. It has been accepted for inclusion in The Instructional Architect Research Group by an authorized administrator of DigitalCommons@USU. For more information, please contact
[email protected].
Authors
Andrew Walker, Mimi Recker, Brooke Robertshaw, Jeffrey Olsen, Linda Sellers, Heather Leary, Yu-Chun Kuo, and Lei Ye
This article is available at DigitalCommons@USU: http://digitalcommons.usu.edu/iagroup/7
Designing for Problem Based Learning 1
Designing For Problem Based Learning: A Comparative Study Of Technology Professional Development Andrew Walker Mimi M. Recker M. Brooke Robertshaw Jeffrey Olsen Linda Sellers Heather Leary Yu-Chun Kuo Lei Ye Paper presented at the American Educational Research Association Conference, New Orleans, LA April 2011
ABSTRACT Despite much focus on professional development (PD) aimed specifically at developing technology integration skills, rigorous studies of effective PD are lacking. Evidence is also lacking on how these skills can best be integrated with pedagogical and content knowledge to improve student learning. The purpose of this paper is to present two variations of a designoriented technology integration PD model and investigate the model’s impact on teachers. In one variation, teachers learned technology skills to design activities using online learning resources. In the other, teachers learned to design problem-based learning activities using online resources. Findings indicate similarities and differences across several outcomes including teacher knowledge, teacher experience, teacher confidence, usage of PBL, the kinds of teacher designs, and web usage data. OBJECTIVES The increased pervasiveness of Internet technologies in school settings provides instant access to a growing network of high quality, open access online resources for education (Computing Research Association, 2008; McArthur & Zia, 2008; Pea et al., 2008). These online learning resources include a wide array of simulations, data sets, and lesson plans. As such, they have a substantial, yet largely untapped potential to support teachers in developing tailored activities that enhance diverse students’ educational experiences. However, as widely documented, teachers often lack the time and technology skills necessary for effective technology integration (Hanson & Carlson, 2005; Kramer, Walker, &
Designing for Problem Based Learning 2 Brill, 2007). As such, teachers need support in developing their capacity to teach effectively in 21st century classrooms. Many studies have shown that teacher professional development (PD) is an effective way to improve teacher skills, knowledge, and attitudes (Borko, 2004). Yet despite much PD aimed specifically at developing technology integration skills, rigorous empirical studies of effective PD are lacking. Moreover, evidence is lacking on how newly learned technological skills can best be integrated with pedagogical and content knowledge in ways that improve student learning (Lawless & Pellegrino, 2007) The purpose of this paper is to present two variations of a design-oriented technology integration PD model and investigate the model’s impact on teachers and student learning. In one variation, teachers solely learned technology skills to design student activities using online resources. In the other, teachers learned technology skills to design inquiry-oriented (specifically problem-based learning) activities for their students using online resources. In this way, our study compared the impact of a PD implementation focused on technology alone, with one integrating technology and pedagogy. THEORETICAL FRAMEWORK Teacher professional development has long been a way to increase teachers’ skills, and many studies have demonstrated its positive effects on instructional practices and student learning (Borko, 2004). Previous studies have identified general characteristics of effective PD (e.g., intensive, sustained, job-embedded, collaborative, active, and content focused.). However, rigorous evidence of effective PD, especially with regards to long term impacts on teacher and student learning is lacking (Wayne, Yoon, Zhu, Cronen, & Garet, 2008). The PD model used in the present research is design-oriented in that participants learn to design instructional activities for their students. Proponents of design-oriented PD argue that this approach enables teachers to learn new technology skills within an authentic instructional context. This helps them take ownership of new skills, making them more likely to integrate these into future teaching (Lawless & Pellegrino, 2007). This perspective also fits with a more contemporary view of teaching as a kind of design task, in which teacher adaptation and use of materials is seen as a critical step in curriculum design (Brown & Edelsen, 2003; Remillard, 2005). TECHNOLOGY CONTEXT The technological context for the PD is a free, web-based tool, the Instructional Architect (IA.usu.edu), which supports teachers in authoring instructional activities for students using online resources. Teachers can use the IA in several ways. Once logged in, the ‘My Resources’ area allows teachers to search for and save online resources from the Web, including Web 2.0 technologies like RSS feeds and podcasts. In the ‘My Projects’ area, teachers can select online resources and annotate them with text to create learning
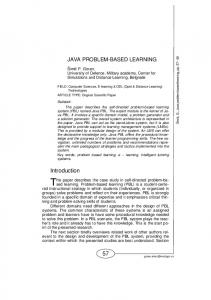
Designing for Problem Based Learning 3 rojects). Finally, teachers can ‘Publish’ IA projects for their th own activities (called IA projects). students, or anyone on the Web Web. Currently, the IA has over 5,700 registered users who have created over 12,600 IA projects using over 57,300 online resources. Figure 1 shows an example IA screen shot with a teacher-created created inquiry activity and an embedded online resource.
FIGURE 1 Example IA project, showing teacher annotations (text) and embedded online resource. PROFESSIONAL DEVELOPMENT MODEL in Thee PD model is implemented as a series of three workshops with in-between activities, conducted face-to-face face over three months months. Following key principles of effective PD, it is sustained, content focused, active, and collaborative. Following design-oriented design approaches in technology integration professional development (Lawless & Pellegrino, 2007), the participants engage with authentic and complex problems in their own teaching, design solutions, and reflect with their peers on the design’s implementation. implementation In terms of technology content, tthe he PD model focuses on the following technology skills: 1) finding and using online resources resources,, and 2) designing activities for students using the IA,, and 3) implementing these IA projects in the classroom. To support our investigation of technology PD, we designed two implementations of our PD model. In one implementation (tech-only), participants solely learned skills to design activities for their students using online resources and the IA. In the other implementation (tech+ tech+pbl), participants learned technology hnology skills to design inquiry-oriented activities for their students using online resources and the IA. The particular inquiry approach was problem-
Designing for Problem Based Learning 4 based learning (PBL), wherein students acquire knowledge through engaging with authentic problems (Barrows, 1986; Barrows & Tamblyn, 1980; Savery, 2006). In PBL, learners operate in small groups to solve authentic problems using resources made available to them. The instructor facilitates, scaffolds, coaches, and models problem-solving behaviors (Hmelo-Silver & Barrows, 2008). Each problem cycle concludes with a reflection phase. PBL was selected as the PD approach with teachers in part because prior research has proven effective both for teacher education (d = 0.64), and when participants are engaged in design problems (d = 0.74) (Walker & Leary, 2009). Figure 2 shows key activities for the two PD implementations, as well as data collection points. Note that participants were asked to utilize PBL with their students only if they felt it aligned with their self-selected design problem, student needs, and their own educational philosophy. Tech Only PD
Session 1. 3 hours
• View example IA projects • Intro to online resources • Intro to IA: Walk through sample project creation • Participants select design problem • Individuals design IA project(s) • Discuss selection of quality of online resources • Review IA functionality • Design and implement IA project(s) with students • Provide reflection paper on barriers and successes in implementation
Same
• Pre-survey
Same
• Student survey • Project coding • Web usage
• Small then large group discuss implementation experiences • Review use of the IA, including advanced features • Design a new IA learning activity • Share ideas • Individuals begin to design new IA project(s)
• Small then large group discuss implementation experiences • Review use of the IA • Engage in inquiry-oriented activity • Large group inquiry-oriented discussion • Design own PBL learning activity • Share ideas • Individuals begin to design new IA project(s) Same
In-between
Session 2. 3 hours
In-between
Session 3. 3 hours
• Design and implement new IA project(s) with students • Write reflection paper on barriers and successes • Small then large group discuss experiences: Technology • Review technical use of the IA, including advanced features
Tech+PBL PD
Data Collected
Phase
• Small then large group discuss experiences: Technology • Review technical use of the IA • Small then large group discuss PBL implementation experiences
• Student survey • Project coding • Web usage • Post survey
FIGURE 2 Key activities for the two PD implementations and data collection points.
Designing for Problem Based Learning 5 METHODS A study was conducted to compare the impact of two implementations of the PD model, using a non-equivalent pre-test/post-test control group design (Campbell & Stanley, 1963). Participants (N=29) were assigned (based on scheduling preference) to one of two implementations. In one implementation, participants (N=13) solely learned technology skills to design activities for their students using online resources (tech-only). In the other, participants (N=16) learned technology skills to design specifically PBL activities for their students using online resources (tech+pbl). Participants were classroom teachers from two adjacent school districts, who received 1 University credit for completing all requirements. Table 1 shows the study’s research questions, data sources, and analyses. Table 2 provides details about each data source. TABLE 1 Research questions, data sources, and analyses. Research Question 1. What is impact of the two PD implementations on participants’ knowledge about, attitude towards, and experience with technology integration? 2. What is the impact of the two PD implementations on participants’ usage of the IA? 3. What is impact of the two PD implementations on design choices made by teachers in their IA projects? 4. What is impact of the two PD implementations on students’ knowledge, attitudes, and behavior?
Data Source Pre/post survey
Analysis ANOVA
Web Usage Data
Descriptive
PBL Alignment, Project Design Pre/post survey, Web Usage Data, Student Survey, PBL Alignment, Project Design
Project Coding GEE (Generalized Estimating Equation)
Designing for Problem Based Learning 6 TABLE 2 Data source details. Data Source Pre/post survey
Web Usage Data Student Survey
PBL Alignment Project Design
Description Participants completed pre/post online surveys, consisting of Likertscale items adapted from an established measure (Becker, 2000) of teacher knowledge, and attitudes with respect to technology and teaching. Automatically collected data (Khoo et al., 2008) of participants’ use of the IA, including number of logins, project visits, online resources used, and IA projects created Participants’ students completed questionnaires, consisting of Likertscale items, at the start and end of an activity using an IA project, measuring student self-reported knowledge, attitudes, and behaviors. Cronbach’s alpha for each subscale ranged from .74 to .85 indicating strong reliability. A factor analysis showed all items loading at .65 or higher with the anticipated constructs. Participants’ IA projects were scored for their alignment with PBL using a 14-point scale (Walker & Shelton, 2008) The design of participants’ IA projects were scored using a an ordinal scale (Recker et al., 2007): 1) offload (primarily links to other online resources), 2) adaptation (mid-point between 1 and 3), and 3) improvisation (largely teacher-created instructional content with support from links to online resources).
RESULTS Results are organized by research question below. A variety of statistical testing was done, with a uniform alpha level of .05 for each test. Research Question #1: Impact on Teachers Impacts on teacher experience, knowledge, and confidence in technology integration were assessed using the pre/post survey. Descriptive statistics and effect size differences of within-group gains are shown below in Table 3. A 2x2 factorial ANOVA was run looking for time (pre-test, post-test) and group (tech only, tech+PBL) as main effects as well as an interaction (time x group) effect on experience, knowledge, and confidence. Both PD implementations show significant gains in experience F(1, 54)=21.83; p < .001 and knowledge scores (F(1, 54)=30.97; p < .001), with large effect sizes. There were no significant gains in confidence scores (F(1, 54)=0.01; p = 0.91). In part, this may be because participants reported higher confidence on the pre-survey than experience or knowledge and thus had less room for improvement.
Designing for Problem Based Learning 7 TABLE 3 Teacher self-report on technology integration experience, knowledge, and confidence Pre-survey Tech only (N = 13) Experience creating online lessons Knowledge using technology in classroom Confidence in teaching with technology Tech+PBL (N = 16) Experience creating online lessons Knowledge using technology in classroom Confidence in teaching with technology
Post-survey
M
SD
M
SD
d
5.23 4.85 7.31
1.42 1.95 0.95
6.62 7.07 7.08
2.14 1.12 2.25
0.77 1.40 -0.13
3.88 4.50 6.69
1.54 1.79 1.14
6.56 6.69 7.00
1.46 0.95 1.03
1.79 1.56 0.29
Note. Possible values range from 0 = low to 8 = high.
None of the outcomes showed a significant interaction effect, which would indicate a difference in the rate of pre-test post-test changes between the groups. With that said, this may be a result of the relatively low statistical power and small n involved. When examining pre- post- changes in terms of effect size, tech+pbl is consistently higher on all three outcomes. In one case, experience creating online lessons, the difference is dramatic (d = 0.77 vs 1.79). Note that the tech+pbl group started with about half the reported experience as the tech-only group. Research Question #2: Impact on IA Usage Table 4 shows summary IA usage statistics for the two PD implementations. Overall, usage is high, with high numbers of participant logins, online resources used, and IA projects created. Student usage also appears high, with high numbers of visits to the IA projects created by participants, including one IA project accessed over 3,000 times. TABLE 4 Usage data. Tech only PD (N = 13) Number of participant logins to the IA Number of IA projects created Number of online resources used Number of visits to non-private IA projects Tech+PBL PD (N = 16) Number of participant logins to the IA Number of IA projects created Number of online resources used Number of visits to IA projects
M
SD
Max
28.20 9.79 39.30 121.45
19.24 4.71 31.99 397.57
71 23 110 3412
38.66 9.93 62.66 78.60
18.89 6.69 36.36 120.20
69 20 141 744
Research Question #3: Impact on Design Three raters, blind to condition, independently scored participants’ IA projects for alignment with PBL and design approach. A one-way random effects intra-class correlation (ICC) (Patrick Shrout & Fleiss, 1979) analysis was .82 for PBL and .81 for design, indicating
Designing for Problem Based Learning 8 a high level of inter-rater reliability for these data. Tables 5 and 6 show results for participants’ IA projects PBL alignment and design scores. Note that PBL alignment results in particular are likely an under-estimate of what happens in the classroom. Teachers may ask students to use the project in groups, as one example, even though the project does not make that clear. The means for all PBL scores are quite low, which may be the result of this underestimation, an overly strict measure, or may suggest that the PBL portion of the PD was not effective. TABLE 5. IA project PBL alignment scores M Tech only PD PBL score after workshop 1 (N=9) 0.22 PBL score after workshop 2 (N=12) 0.42 Tech+PBL PD PBL score after workshop 1 (N=8) 0.13 PBL score after workshop 2 (N=12) 0.25 Note. Possible values range from 0 = low to 14 = high.
SD
Max
0.67 1.16
2.00 4.00
0.35 0.62
1.00 2.00
Although scores were based on scales, a Mann-Whitney U test was run to account for the extremely small sample sizes. Comparisons between different workshop treatments were not statistically different both after the first z(16) = 0.00, p = 1.00 and second z(23) = 0.04, p = 0.96 workshops. In short, the PD did not change teacher usage of PBL over time and groups used consistently negligible levels of PBL in their IA projects. This may be a result of an overly stringent rubric. TABLE 6 IA Project Design scores Offload Tech only PD Design after workshop 1 (N = 9) Design after workshop 2 (N = 12) Tech+PBL PD Design after workshop 1 (N = 8) Design after workshop 2 (N = 12)
Adaptation
Improvisation
2 (22.2%) 5 (41.7%)
2 (22.2%) 3 (25.0%)
5 (55.6%) 4 (33.3%)
0 (0.0%) 1 (8.3%)
6 (75.0%) 9 (75.0%)
2 (25.0%) 2 (16.7%)
Fischer’s exact tests were run to compare the designs after each workshop. They suggest no pre-existing differences between tech-only and tech+pbl participants after each experienced the same initial workshop, X2 (4, N = 21) = 6.14 p = 0.08. There were, however, statistically significant differences after the second workshop X2 (4, N = 20) = 6.73 p = 0.05. Specifically, tech-only participants were more likely to engage in offloads or improvisations. Tech+pbl participants were more likely to engage in adaptations (see Table 6).
Designing for Problem Based Learning 9
Research Question #4: Impact on Students The ultimate test of the effectiveness of professional development is determining its links with student learning, although these links are likely to be indirect. Our approach was to provide pre/post questionnaires to participants’ students at the start and end of an activity using an IA project and test the association between student gain scores and various predictors. Student questionnaire gain scores were the dependent variables (student attitude, student knowledge, and student behavior) and were each tested as separate GEE models. All three models used teacher as the cluster and included teacher level predictors for time, teacher, teacher characteristics, IA usage data, PBL alignment, design choice, years in teaching and one student level predictor (grade). Table 7 provides details for each predictor alongside descriptive statistics for both groups. Note that the descriptive statistics are different than teacher level analyses alone because not all teachers engaged in student level data collection. TABLE 7 Predictors with descriptive statistics Predictor
Subgroups of the predictor
Description Tech only Tech + PBL
Variable Type
Group
Tech-only Categorical Tech+PBL Time Session 1 Categorical (PD session) Session 2 Teacheruid 15 teachers yielded 9 teachers 6 teachers Categorical student data 14 classes 7 classes M=7.16 SD=1.17 M=7.57 SD=0.85 Teacher Teacher attitude M=4.50 SD=2.17 M=5.5 SD=1.65 Characteristics Teacher knowledge Continuous Teacher experience M=4.17 SD=1.17 M=5.5 SD=1.22 Scale: 0-8 M=35.43 SD=20.42 M=53.33 SD=14.05 IA usage data IA logins IA projects created M=17.00 SD=6.39 M=8.71 SD=2.97 Active resources M=8.67 SD=5.54 Continuous M=7.29 SD=5.97 used M=35.43 SD=20.41 M=53.33 SD=14.05 Student visits PBL Alignment Scale: 0-2 M=0.14 SD=0.53 M=0.17 SD=0.41 Continuous 0 4 (28.57%) Design Choice Offload 6 (100%) Categorical 4 (28.57%) Adaption 6 (42.86%) Improvisation Years in Teacher’s teaching M=10.07 M=9.5 Continuous teaching experience SD=4.63 SD=11.41 Student grade Grade 3 to 11 M=6.71 SD=2.23 M=4.83 SD=2.04 Continuous Note. Only teachers having student data are included. Summary statistics may be different from previous tables.
Demographics for the students are reported below in Table 8. Ethnicity and primary language have similar percentages across groups. Attention should be focused on the fact that in this pilot GEE study, fewer Tech + PBL teachers engaged in student level
Designing for Problem Based Learning 10 data collection with half the level of classes. As a result, we have less than half the number of student level data points as compared to Tech Only teachers. TABLE 8 Characteristics of student participants Characteristic Group Ethnicity White Hispanic/Latino Black or African American Other Two or more groups Didn’t answer Primary Language English Spanish Bilingual Other
Tech Only N (%) 226 (67.87%)
Tech + PBL N (%) 107 (32.13%)
164 (72.57%) 29 (12.83%) 1 (.44%)
84 (78.50%) 6 (5.61%) 0
6 (2.64%) 7 (3.10%) 19 (8.40%)
1 (.93%) 7 (6.54%) 9 (8.41%)
193 (86.02%) 19 (8.41%) 11 (4.87%) 3 (1.32%)
101 (94.39%) 5 (4.67%) 1 (0.93%) 0
Descriptives for the dependent variables are shown in Table 9. Each score was calculated by subtracting pre-test scores from post-test scores. As a result, possible scores can be positive or negative. Given the relatively short treatment length for the various activities, generally less than an hour, scores were expected to be low and were. All values, across all dependent measures, workshop groups, and sessions were positive indicating that students felt their knowledge, attitudes, and behaviors with respect to the content taught improved after the activity. TABLE 9 Gain scores for Students’ knowledge, attitude, and behavior Group Session 1 Session 2 Total Student knowledge Mean SD N Mean SD N Mean SD N gain Tech only PD 0.95 2.26 90 0.85 1.83 136 0.88 2.01 226 Tech+PBL PD 0.06 2.07 62 1.26 1.59 45 0.56 1.96 107 Total 0.58 2.21 152 0.95 1.78 181 0.78 1.99 333 Student attitude gain Mean SD N Mean SD N Mean SD N Tech only PD 0.03 1.72 90 0.02 1.47 136 0.03 1.57 226 Tech+PBL PD 0.05 1.61 62 0.32 1.63 45 0.16 1.61 107 Total 0.04 1.67 152 0.09 1.51 181 0.07 1.58 333 Student behavior gain Mean SD N Mean SD N Mean SD N Tech only PD 1.31 2.94 90 1.11 2.63 136 1.18 2.76 226 Tech+PBL PD 0.96 2.22 62 0.43 2.01 45 0.73 2.14 107 Total 1.16 2.67 152 0.94 2.50 181 1.04 2.58 333 Note. Student knowledge and attitude subscales range from -8 to 8. The student behavior subscale ranges from -12 to 12.
Designing for Problem Based Learning 11 As is common in educational research, our data were nested (students within teachers) which violates the independence assumptions of multiple regression. To address this cluster nature of the data set, we analyzed the student data using the Generalized Estimating Equation (GEE) (Liang & Zeger, 1986). While other approaches, such as Heirarchical Linear Modeling are also appropriate, GEE is suited well to our circumstances in that it handles data which violate distributional assumptions and is robust for a variety of data types (categorical, an continuous in our case). Model testing was done using STATA 11 statistical software. To select the best working correlation structure and aid in selection of predictors for the GEE model, the QIC score was calculated and used, predictor combinations that resulted in the lowest QIC (Pan, 2001; Cui, 2007) proposed the QIC score. Two variables (time and group) were included irrespective of QIC because they were considered important to the study. To statistically test whether each coefficient (estimate in the tables that follow) is substantially greater than zero, we follow the recommendations of Rotnitzky & Jewell (1990) in relying on the Wald chi-square statistic. Student Knowledge. For student knowledge, the final model identifies a strong positive relationship between teacher attitudes about technology integration and suggests, when looking at group means, that student gains were highest when teachers focused on technology integration. However, that overall trend belies important post-estimation differences. While other predictors are statistically significant, they do not make important contributions to accurately predicting student knowledge gains. TABLE 10 Estimated Coefficient, Standard Errors and p-values: GEE Models for student knowledge gain Student Knowledge Gain final model Parameters Estimate SE P-Value Intercept -13.878 1.572 .000 Group -.880 .235 .000 Time .270 .474 .569 Teacheruid .072 .011 .000 Teacher attitude 1.478 .077 .000 IA logins .053 .011 .000 IA projects created .056 .026 .034 Active resources used -.029 .042 .486 Student visits -.003 .001 .001 PBL alignment -.922 .121 .000 Design choice .661 .177 .000 Years in teaching -.094 .017 .000 Student grade .213 .036 .000 QIC score 1090.884 Teacher knowledge, Predictors excluded Teacher experience Note. Working correlation structure is “independent”.
Since group is categorical, interpretation of the estimate is best done through postestimation. Table 11 below shows post-estimated means with confidence intervals and
Designing for Problem Based Learning 12 comparisons between groups at each time point. As shown below in Table 11 students of tech-only teachers started relatively high (M = 0.878) and finished with similar gains after the second workshop (M = 0.895). On the other hand, students of tech+PBL teachers started much lower (M = 0.157), statistically below their counterparts (p < .05) and finished with similar gains (M = 1.127) after the second workshop. Recall from the description that both groups received identical experiences in the first workshop. As a baseline, the students of tech+PBL teachers clearly started off lower but closed the gap after PBL was introduced. TABLE 11 Post-estimation of student knowledge gain between groups Group Session 1(N=152) Tech only PD (n=90) Tech+PBL PD (N=62) Session 2 (N=181) Tech only PD (N=136) Tech+PBL PD (N=45) Total (N=333) Tech only PD (N=226) Tech+PBL PD (N=107) Note. *p< .05. **p< .01.
LS Means
final model 95% CI
z
.878 .157
(.430, 1.326) (-.334, .649)
2.12 *
.895 1.127
(.612, 1.179) (.646, 1.608)
-.77 ns
.888 .565
(.746,1.030) (.319, .812)
2.17 *
Student Attitudes. Unlike student knowledge, student attitudes towards the content taught were not significantly associated with their teacher’s group. Like student knowledge, positive teacher attitudes about technology integration in general were associated with positive student attitudes about the content taught. Finally, as the PBL alignment of the activity increased, the student attitude gains tended to decrease. See Table 12 for details. Since no categorical data made important contributions to the model, no post-estimation was conducted for student attitude gains.
Designing for Problem Based Learning 13
TABLE 12 Estimated Coefficient, Standard Errors and p-values: GEE Models for student attitude gain Student Attitude Gain final model Estimate SE P-Value Intercept -3.474 .877 .000 Group -.231 .158 .144 Time -.120 .188 .523 Teacheruid -.013 .006 .042 Teacher attitude .299 .057 .000 IA projects .086 .022 .000 Active resources used .010 .006 .080 PBL alignment -.411 .145 .004 Years in teaching .032 .007 .000 Student grade .108 .029 .000 QIC score 784.072 Teacher knowledge, Teacher Predictors excluded experience, IA logins, Student visits, Design choice Note. Working correlation structure is “independent”. Parameters
Student Behavior. The final model (Table 13) examines student behavior gains as a dependent measure. Much like student knowledge group was again a factor with tech only results appearing to outstrip technology+PBL respondents. Teacher attitudes remained a strong and significant predictor of student gains across all three outcomes, including student behaviors. The behavior measure is an indication of how likely students are to continue working in the area independently, discussing the content with friends, or pursuing additional information on their own.
Designing for Problem Based Learning 14 TABLE 13 Estimated Coefficient, Standard Errors and p-values: GEE Models for student behavior gain Parameters Intercept Group Time Teacheruid Teacher attitude IA logins Active resources used PBL alignment Design Choice Years in teaching QIC score Predictors excluded
Student Behavior Gain Final model Estimate SE P-Value -2.296 1.312 .000 -.817 .184 .000 -.387 .267 .147 .049 .013 .000 .628 .120 .000 .029 .010 .005 -.044 .030 .141 -.334 .194 .086 -.228 .157 .145 -.055 .018 .002 2048.826 Teacher knowledge, Teacher experience, IA projects created, Student visits, Student grade
Note. Working correlation structure is “independent”.
As shown in the post-estimation (Table 14) students, irrespective of their teachers’ group, tended to decrease their behavior gains over time. Post-estimation also shows a consistent trend across times, with tech only students gaining more than tech+PBL students, although the comparison is only statistically significant when both time points are combined. TABLE 14 Post-estimation of student behavior gain between groups Group Session 1(N=152) Tech only PD (n=90) Tech+PBL PD (N=62) Session 2 (N=181) Tech only PD (N=136) Tech+PBL PD (N=45) Total (N=333) Tech only PD (N=226) Tech+PBL PD (N=107) Note. *p< .05. **p< .01.
LS Means
95% CI
z
1.407 .812
(1.107, 1.708) (.308, 1.317)
2.00 ns
1.044 .637
(.836, 1.251) (.260, 1.011)
1.82 ns
1.189 .738
(1.069, 1.309) (.408, 1.068)
2.50 *
Across all outcomes, time was conspicuously absent as a strong and significant predictor variable.
Designing for Problem Based Learning 15
SIGNIFICANCE This paper reported the impact of two implementations of a design-oriented technology integration PD model. Both implementations showed high teacher and student usage of the tools and significant gains in teacher reported knowledge and experience. Although both failed to improve teacher confidence, that may be due in part to teachers initially high levels of confidence having little room for improvement. In terms of practical significance, either PD approach should be considered by workshop providers. In terms of scholarly significance, the results suggest more areas for future research. The reasons behind the difference in usage patterns, and similarity in PBL elements remain unclear. While the high inter-rater reliability evidence for the PBL alignment rubric is encouraging, measurement work remains. It is possible that PBL alignment scoring was not sensitive enough to differences exhibited within teacherdesigned activities. For example, IA projects needed to not only be cross-disciplinary but present cross-disciplinary problems to students, a rather high bar. This study adds to the growing body of literature in technology integration that treats data as nested, including HLM and GEE. To our knowledge, it represents some of the first efforts to examine the impacts of PBL designed technology teacher professional development on teacher practice as well as subsequent impacts on students. With that effort come several limitations. The number of clusters was quite low, the student level data had a disparate number of participants between workshop groups, and throughout the analyses power was quite low. Data have already been collected and analyses are underway with a focused group of teachers (mathematics and science), and a more focused group of students (7th and 8th graders) along with a much larger number of student respondents (in excess of 2,000). Researchers using the PBL Alignment scoring might consider refining the measure. Finally, from a measurement perspective, the student self-report survey proved both reliable and valid, as assessed by a factor analysis for this sample. The measure is particularly noteworthy because it was designed for and used with students exposed to a wide range of subject matter. The full AERA paper will include an analysis of the indirect impacts of the workshops and direct impact of teacher created projects on students. ACKNOWLEDGEMENTS The authors would like Dr. Anne Hunt for methodological assistance with the GEE models and the participating teachers. This material is based in part upon work supported by the National Science Foundation under Grant Numbers EHR/0937360. Any opinions, findings, and conclusions or recommendations expressed in this material are those of the author(s) and do not necessarily reflect the views of the National Science Foundation. REFERENCES Association, C. R. (2008). Cyberinfrastructure for education and learning for the future: A
Designing for Problem Based Learning 16 vision and research agenda. Ballinger, G. A. (2004). Using generalized estimating equations for longitudinal data analysis. Organizational Research Methods, 7 (2), 127-150. Barrows, H. S. (1986). A taxonomy of problem-based learning methods. Medical Education, 20(6), 481-6. Barrows, H. S., & Tamblyn, R. M. (1980). Problem-based learning: An approach to medical education. Springer Series on Medical Education. New York: Springer Publishing Company. Becker, H. J. (2000). Findings from the Teaching, Learning, and Computing Survey: Is Larry Cuban Right? Education Policy Analysis Archives, 8(51). Borko, H. (2004). Professional development and teacher learning: Mapping the terrain. Educational Researcher, 33(8), 3-15. Brown, M., & Edelsen, D. (2003). Teaching as design (LETUS). Campbell, D. T., & Stanley, J. C. (1963). Experimental and quasi-experimental designs for research on teaching. Chicago: Rand McNally. Cui, J. (2007). QIC program and model selection in GEE analyses. The Stata Journal, 7(2), 209220. Hmelo-Silver, C. E., & Barrows, H. S. (2008). Facilitating collaborative knowledge building, 26(1), 48-94. Khoo, M., Recker, M., Pagano, J., Palmer, B., Washington, A., & Donahue, R. A. (2008). Using webmectrics to analyze digital libraries. Koehler, M., & Mishra, P. (2005). Teachers learning technology by design. Journal of Computing in Teacher Education, 21(3), 94-102. Koehler, M., & Mishra, P. (2008). Introducing TPCK. In Handbook of Technological Pedagogical Content Knowledge (TPCK) for Educators (pp. 3-30). New York: Routledge. Lawless, K. A., & Pellegrino, J. W. (2007). Professional Development in Integrating Technology Into Teaching and Learning: Knowns, Unknowns, and Ways to Pursue Better Questions and Answers. Review of Educational Research, 77(4), 575. Liang, K.-Y., & Zeger. S. L. (1986). Longitudinal data analysis using generalized linear models. Biometrika, 73, 13-22. McArthur, D., & Zia, L. (2008). From NSDL 1.0 to NSDL 2.0: Towards a comprehensive cyberinfrastructure for teaching and learning (pp. 66-69). Presented at the International Conference on Digital Libraries, Pittsburgh, PA: ACM.
Designing for Problem Based Learning 17 Pan, W. (2001). Akaike's information criterion in generalized estimating equations. Biometrics, 57(1), 120-125. Patrick Shrout, & Fleiss, J. (1979). Intraclass correlations: Uses in assessing rater reliability. Psychological Bulletin, 86(2), 420-428. Pea, R., Borgman, C. L. C., Ableson, H., Dirks, L., Johnson, R., Koedinger, K., & et al. (2008). Fostering learning in the networked world: The cyberlearning opportunity and challenge, a 21st century agenda for the National Science Foundation. National Science Foundation. Raudenbush, S., & Bryk, A. (2001). Hierarchical linear models: Applications and data analysis methods (Vol. 2). Sage Publications. Recker, M., Walker, A., Giersch, S., Mao, X., Halioris, H., Palmer, B., Johnson, D., et al. (2007). A study of teachers’ use of online learning resources to design classroom activities. New Review of Hypermedia and Multimedia, 13(2), 117-134. Remillard, J. (2005). Examining key concepts in research on teachers' use of mathematics curricula. Review of Educational Research, 75(2), 211-246. Rotnitzky, A., & Jewell, N. P. (1990). Hypothesis testing of regression parameters in semiparametric generalized linear models for cluster correlated data. Biometrika, 77, 485497. Savery, J. R. (2006). Overview of problem-based learning: Definitions and distinctions. The interdisciplinary Journal of Problem-based Learning, 1(1), 9-20. Walker, A., & Leary, H. (2009). A Problem Based Learning Meta Analysis: Differences Across Problem Types, Implementation Types, Disciplines, and Assessment Levels. Interdisciplinary Journal of Problem Based Learning, 3(1), 12-43. Walker, A., & Shelton, B. (2008). Problem-based learning informed educational game design. Journal of Interactive Learning Research, 19(4), 663-684. Wayne, A. J., Yoon, K., Zhu, P., Cronen, S., & Garet, M. (2008). Experimenting with teacher professional development: Motives and methods. Educational Researcher, 37(8), 469479.