mal screen layout (e.g., 'picture' versus 'text')? Where is the best place to put visual ... media software house ADI Inc. in Karlsruhe. ... You have a free day (April, 7th, 1993). ... Which spectrum of services are available at the cash service desk?
WORK WITH DISPLAY UNITS 94 A. Grieco, G. Molteni, B. Piccoli and E. Occhipinti (Editors) © 1995 Elsevier Science B.V. All rights reserved
265
Designing multi media user interfaces with eye recording data. M. Rauterberg, P. Berny, G. Lordong, A. Schmid, M. Zemp & T. Zürcher Work and Organizational Psychology Unit, Swiss Federal Institute of Technology (ETH) Nelkenstr. 11, CH-8092 Zurich, Switzerland Abstract An eye movement recording experiment has been carried out to test the hypothesis that fixation patterns contain design relevant information. Eight users solved ten tasks with a multi media information system. During this task solving process all eye movements were continually recorded. The following aspects should be considered to come up with design relevant knowledge: (1) pictorial versus textual objects, (2) explicit versus implicit design, (3) task relevant information, and (4) the object area size. We present and discuss empirically proved approaches to solve several design problems for multi media information systems. 1 . INTRODUCTION One important problem in interface design of multi media interfaces is making appropriate design decisions regarding the positioning of visual feedback on the screen (e.g., messages, animation windows, icons, etc.). While highlighting techniques can aid the user in locating important messages, it is not always possible to predict what may be important to the user at a given time. The traditional solution is a mask layout that allows the user to easily find any of the information on it by adopting a consistent format for all masks of a character user interface (CUI, cf. [3]). In the context of the design of graphic user interfaces (GUIs) important messages are often placed in the centre of the screen (cf. [10]). This solution is based on the strategy of minimising the distance between the unknown locus of the primary attention focus (PAF) of the user and the locus of the message on the screen. Some open questions are: What is an optimal screen layout (e.g., 'picture' versus 'text')? Where is the best place to put visual feedback on the screen? A 'hotspot' is a mouse- or touch-sensitive area on the screen. How can a user discriminate among 'explicit' and 'implicit' hotspots? Table 1. Survey of variables that control dynamic visual attention (from [4] and [5]). 1.) 2.) 3.) 4.) 5.)
The rate at which the display varies: the greater the bandwidth is, the more frequently is the display sampled. The value of the information: the more the information is worth, the more frequently is the display sampled. The cost of observation: the more costly an observation is, the less frequently is the display sampled. Forgetting: as the time since the last observation elapses, the user becomes less certain of the value of the last observed information even if it varies only slightly or not at all. The coupling between displays can control the dynamic of visual attention.
One major determinant is attention both of the context and quality of perception [7]. It is known that at least the five variables in Table 1 play a role in controlling dynamic visual attention. To investigate the causes of visual attention control in man computer interaction we have to measure eye movements in the context of different conditions. Yarbus [15] convincingly demonstrated how a person's intention affects the way he or she looks at a picture. The intentions
266
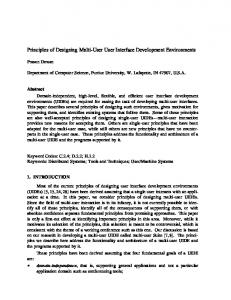
or strategies governing fixation patterns are under the voluntary control of subjects. One strategy choice available to subjects when they have limited time to look at a picture is wether to make many brief eye fixations, or fewer but longer-duration eye fixations. Graf et al [6] could show the interdependencies between training, fixation-time, and task complexity. To determine the point of visual attention, several studies measured eye movements. There are much unsolved problems to correlate eye movements with higher psychological processes. But, 'eyes as output' are one of the best empirical sources. Kahneman [8] distinguishes three types of eye movements that correlate with mental processes: (1) Spontaneous looking, (2) task-relevant looking, and (3) looking is a function of the changing orientation of thought. Thus, the location where a person is looking provides a ready prima facie index of what they are interested in, where they are going visually to gain needed or wanted information, and their overall cognitive set. We try to test the hypothesis that fixation patterns give us design relevant information. To do this we carried out an eye movement recording experiment. One plausible assumption is that the visual focus measured with eye movement recording can be controlled by popping up windows and boxes at several positions on a screen. Another plausible assumption is that all fixations are concentrated on average at specific areas of the screen. To investigate the orienting process on the change of the fixation patterns we analyse the eye fixation pattern in two different situations: (a) place of first fixation on a screen, and (b) place of second and third fixation on a screen. 2 . EMPIRICAL VALIDATION 2 . 1 Method Subjects: A total of 8 subjects participated. Group A consists of 4 men with the average age 25.0 ± 1.1 years. Group B consists of 4 men with the average age 26.8 ± 3.1 years. All subjects were students working as a probationer at the German enterprise DORNIER Inc. Experimental setting: We used the eye tracking system (ETS, accuracy ≤ 1˚) of DORNIER Inc. The subject sat in a normal distance (30"-50") in front of a computer screen (17") without any contact to the eye recording measurement unit (pupil/corneal reflection method based on infrared illuminated eye images). Material: The experiment was run on a PC (Olivetti M386) with colour screen (VGA, 17"). The standard Windows 3.0 environment with a multi media information system of a German bank association was used. The original version was developed by the German multi media software house ADI Inc. in Karlsruhe. This version consists of 62 different screens (masks) with on average 11.6 ± 5.1 objects per screen (number of all objects is 721). The second version of this multi media system was redesigned and programmed at our usability laboratory. This version consists of 51 different screens (masks) with on average 13.2 ± 4.9 objects per screen (number of all objects is 672). Due to the fact that the original interface version and the adopted version differ in the dialog structure and not primarily in the screen layout, we will present results only of four screens of the original version (see Figure 1, 2, 3, and 4). Tasks: Subjects were instructed to solve 10 tasks: (1) Search a house for a price of 450,000.– DM. (2) Who is responsibly for the sales talk about an estate? (3) Where is the office of this person located in the building? (4) To buy the house you need a mortgage. Where can you get this? (5) Where can you get information about buying and selling of securities? (6) The bank offers different events of entertainment. You have a free day (April, 7th, 1993). Which events are offered? (7) You have not enough cash and you are nearby the main station. Where is the next cash service? ('Hbf.' is an abbreviation of the German word 'Hauptbahnhof' -- 'main station' in English; c.f. Figure 4) (8) Where is the cash counter located in the building? (9) Which spectrum of services are available at the cash service desk? (10) Look for the next estate, which you can find? Procedure: Factor A is the 'object type' ('picture' versus 'text'; all objects with more than two ASCII symbols are 'text objects', except the picture with title of screen 3; see Figure 1, 2, 3, and 4). Factor B is the 'design type' of each object ('explicit' versus 'implicit' design; e.g. hot spots like buttons have explicit design, all other hotspots (e.g., logo, picture, signs) have an implicit design; see [12]). Factor C is the 'task relevant information' of each object ('relevant'
267
versus 'not relevant'; only the following objects have task relevant information: the big arrow in the lower right corner of screen-2; the big 'EC-symbol' nearby the symbol 'Hbf' and the 'Hbf'symbol itself in screen-4; all text with 'Info-Center' and the 'red point' nearby 'Foyer' in screen-3). We used a 'Latin-square' test design. Measures: The visual fixation point is given by the ETS as a crossing point of two white lines on the video and as absolute values (x-, y- co-ordinate) in a log file. The frequencies of eye positions were counted with time increments of 20 ms. We defined visual areas as representations of objects (e.g., button, logo, picture, etc.). Each object is characterized by its position and its screen space or area size. We present in this paper the analysis of the first three fixations of all eight users looking on one of four different screens each time, when they came to one of these screens during their task solving process. We differentiate the variable 'number of first fixations' ('# of first fixations') from the variable 'number of total fixations' per object (cf. Figure 1, 2, 3, and 4). The variable 'number of rest fixations' is defined as '# of total fixations' minus '# of first fixations'. The variable '# of relative first fixations' is the ratio of '# of first fixations' divided by 'object area' (measured in dots^2). This was done to eliminate the influence of the object area size on number of fixations. 2 . 2 Results We analysed all presented data in Figure 1, 2, 3, and 4 with analysis of variances and correlation analysis. The screen-1 in Figure 1 is characterized by 12 different objects, 30 first fixations (top number at the right side of each object), and 186 total fixations (bottom number at the right side of each object). The screen-2 in Figure 2 is characterized by 9 different objects, 30 first fixations, and 249 total fixations. The screen-3 in Figure 3 is characterized by 15 different objects, 21 first fixations, and 252 total fixations. The screen-4 in Figure 4 is characterized by 19 different objects, 16 first fixations, and 104 total fixations. Table 4. Results of three analyses of variances for the six dependent variables. Factor A 'Object' dependent variable # of first fixations # of rest fixations # of total fixations # of relative first fix. # of relative rest fix. # of relative total fix.
Factor B 'Design'
df F-Value P-Value 1, 1, 1, 1, 1, 1,
53 5.075 53 10.186 53 10.832 53 1.664 53 0.784 53 0.985
.028 .002 .002 .203 .380 .325
1, 1, 1, 1, 1, 1,
df
F-Value P-Value
53 53 53 53 53 53
0.558 4.518 4.071 1.386 0.242 0.414
.458 .038 .049 .244 .625 .523
Factor C 'Task'
1, 1, 1, 1, 1, 1,
df
F-Value
P-Value
53 53 53 53 53 53
0.169 4.557 3.813 20.644 71.512 61.669
.683 .037 .056 .0001 .0001 .0001
Factor-A 'object type' -- picture versus text: We find a significant difference for the benefit of objects with a textual content (mean of 'first fixations' 2.5 ± 2.5) compared to objects with a pictorial content (mean of 'first fixations' 1.1 ± 2.2; P ≤ .028, see Table 4). There are also significant effects for the variable 'number of rest fixations' (17.1 ± 9.2 for 'text' versus 8.3 ± 11.2 for 'pictures'; P ≤ .002) and for the variable 'number of total fixations' (19.6 ± 10.4 for 'text' versus 9.4 ± 12.6 for 'pictures'; P ≤ .002). These advantages of textual objects disappear completely if we take the influence of the area size of the objects into consideration (variables 'number of relative … fixations'). Factor-B 'design type' -- explicit versus implicit: We find a significant difference for the benefit of objects with an explicit design (mean of 'rest fixations' 18.2 ± 10.1) compared to objects with an implicit design (mean of 'rest fixations' 10.9 ± 10.9; P ≤ .038, see Table 4). A similar effect can be shown for the variable 'number of total fixations' (20.4 ± 10.2 for 'explicit design' versus 12.5 ± 12.8 for 'implicit design'; P ≤ .049). These advantages of explicitly designed objects disappear completely if we take the influence of the area size of the objects into consideration (variables 'number of relative … fixations', see Table 4).
268 Factor-C 'task relevant information': If we compare the mean fixation rate of objects with task relevant information with objects without task relevance then we can find significant differences for the variable 'number of rest fixations' (20.7 ± 8.3 fixations for 'relevant' objects versus 11.4 ± 11.0 fixations for 'not-relevant' objects; P ≤ .037) and 'number of total fixations' (22.8 ± 7.7 fixations for 'relevant' objects versus 13.2 ± 12.7 fixations for 'not-relevant' objects; P ≤ .056). If we take the influence of the area size of the objects into consideration then we find highly significant differences for the benefit of objects with task relevant information's ('number of relative first fixations': 0.27 ± 0.37 for 'relevant infos' versus 0.03 ± 0.05 for 'not-relevant infos', P ≤ .0001; 'number of relative rest fixations': 1.63 ± 1.08 for 'relevant infos' versus 0.20 ± 0.22 for 'not-relevant infos', P ≤ .0001; 'number of relative total fixations': 1.90 ± 1.40 for 'relevant infos' versus 0.23 ± 0.25 for 'not-relevant infos', P ≤ .0001). 0 0
0 1
0 6
4 17
3 32
6 19
1 20
7 27
4 16
3 18
0 20
0 15
0 1 10 42
9 39
7 42
3 35
2 9
1 37 0 2
0 38
Figure 1. Fixations per object on screen 1. 1 4
Figure 2. Fixations per object on screen 2.
2 12
1 12
0 1
0 4
0 22
5 23
2 25
6 31
0 2
0 4 5 23
2 21
0 18
1 13
2 21
0 0
1 9
0 1
1 2 0 0
0 0
3 9 2 7
0 0
0 3
0 6
0 27
Figure 3. Fixations per object on screen 3.
0 9
1 3
1 10
1 26
1 5
0 3
Figure 4. Fixations per object on screen 4.
Orienting phase: We find two significant product moment correlations (R): one between 'number of first fixations' and 'number of rest fixations, R1 = .53 (P ≤ .0001, N = 55), and the other between 'number of relative first fixations' and 'number of relative rest fixations, R2 = .83 (P ≤ .0001, N = 55). If we exclude all data points with 'task relevant information', then both correlations change (R1 = .62, P ≤ .0001, N = 48; R2 = .45, P ≤ .001, N = 48). Objects that have a high attractiveness for the first time tend to keep their attraction over time. Power of the center: If we count the number of all fixations in the center of different screens (e.g., see Figure 1, 2, 3, and 4), then we have an empirical indicator of the attractiveness of this central region. We defined an area of 200 dots by 200 dots (13%) of total screen
269 space (640 dots by 480 dots) in the middle of each screen. We counted 56,350 fixations (26%) in this area of all 217,920 measuring points. This analysis was done with all data points of 62 screens of the original version and of all 51 screens of the adopted version. 3 . DISCUSSION AND CONCLUSION It is worth bearing in mind that no-one knows how perception – with its complexity – really functions. Anyone who works with design uses his powers of perception and possibly also refers to the perceptions of other people. Patterns of seeing are extremely tenacious (and vitally necessary) and extend far beyond the area of design. One methodological approach – to overcome these obstacles' – is eye movement recording during real task solving processes. Results of our eye recording experiment can be used to optimise the strategy to control and to influence the user's primary attention focus (PAF). First, we have to analyse the fixations as one parameter of attention. Picture versus text: Pictorial objects (e.g. icons) are better than textual objects if the user has to solve a search task on a static screen (c.f. [2] [8] [14]). The generalisation of these empirical findings to our design problem is questionable (c.f. [13]): (1) In our case the user does not know what he or she is really looking for (semantically uncertainty), (2) the user has to solve a task in a more complex sense (search time is a minor part of the whole task solving time), and (3) the user deals with different and changing screens (orientation and navigation uncertainty). Due to these three conditions we have to interpret our results. The high attractiveness of textual objects -- measured with number of fixations -- can be possibly explained by their strong impact on the reduction of semantically uncertainty. Otherwise, if we control the influence of the object size, then we can not find anymore a difference between pictorial and textual objects. Explicit versus implicit design: One important advantage of multi media screen design is the unconstrained design space: every type of textual or pictorial structure can be used. The designer is not fixed to use only rectangular windows or buttons, etc. as in the context of Ms Windows, SAA/CUA, OSF/Motif, etc. We call the design of a hotspot, that looks like a traditional button, the 'explicit' design, because the user has explicitly information about the hotspot. On the other side, if we relate hotspots with different shapes to any area on the screen, then we call this approach the 'implicit design' (see [12]). Most of all multi media information systems have a mixed design. In these cases the user has to find out, where the hotspots are on the screen, especially the implicit ones. Our results support an explicit design strategy. Task relevant information: For the design process it would be very helpful, if the designer would know all task relevant information, so that he or she can design appropriate objects on the screen. This can be done with a task analysis during the design phase. On the other side, the results of our variables 'number of relative … fixations' lead us to the interpretation that these variables are very sensitive measures of objects with task relevant information. All objects with a value above 1.0 [100*fixations/dots^2] are candidates to have a look on. Power of the center: Arnheim [1] could show the influence of the whole picture composition on the process of interpretation. One important aspect is the design of the center. The center has a high attraction on the visual attention process. Our results are totally congruent with Arnheim's analysis and composition strategy. Left above placement: Graf [5] found out that the upper part of the screen is an appropriate feedback area. In an additional investigation we could show [11], that the best result for feedback location can be obtained in left above area of the PAF. This feedback placement strategy depends on the actual place of the PAF. Location of the PAF: One of our design goals is the control of the user's PAF. What we need, is a good indicator, that can be used by the interactive program, to determine where the PAF is actually on the screen. We found the actual position of the mouse cursor as such an indicator [11]. We are now able to present the actual information, feedback, etc. nearby the actual focus on the screen (left above placement). This solution is not possible, if we have a touch
270 screen. For this case we have to steer the attention flow of the user. This steering can be done by popping up information, one after the other (or other dynamic factors: video clips, etc.). Orienting and dynamic aspects: Analysing the recorded videos we have to differentiate two situations: (1) the user comes to an unknown screen, (2) the user looks on a known screen. In case (1) a user tries to orient himself. After this orientation phase he is looking for the task related or other interesting information. A new element, that appears dynamically on the screen, interrupts the users' search behavior. If the new information is not task related, then the user is disturbed. In case (2) he has a strong expectation about the dynamics on the screen. If a user expects a specific information appearing on a certain place, then his eyes jump several times to the place, where the information should appear on the screen. In these cases a reduction of time to pop up information could be helpful. Analysing the videos we can observe the strong influence of dynamic screen processes on eye movements. To solve the instructed tasks, most of the users are looking around on the screen to find the right information or a hotspot (mouse sensitive area). If something appears on the screen during this search process, then the normal reaction is to look on this new element. One important condition is the size of appearing elements. If the size is too small, then most of the users have no chance to react on this signal (cf. [11]). 4 . ACKNOWLEDGEMENTS We have to thank the following persons for their generous support: Dr. Karl Schlagenhauf (ADI Software Inc., Karlsruhe, D) and Dr. Scherbarth (Dornier Inc., Friedrichshafen, D). 5 . REFERENCES [1] [2] [3] [4] [5] [6]
[7] [8] [9] [10] [11]
[12] [13] [14] [15]
Arnheim, R. The Power of the Center. Regents of the University of California, 1982. Arend, U., Muthig, K.-P. & Wandmacher, J. Evidence for global feature superiority in menu selection by icons. Behaviour and Information Technology, 6(4), (1987) 411-426. Burroughs Corporation. InterPro (TM) user interface standards, Version E (March 20, 1986). Foley, P. & Moray, N. Sensation, perception, and systems design. In: G. Salvendy (ed.), Handbook of Human Factors. (pp. 45-71), John Wiley, 1987. Graf, W. Ergonomische Beurteilung der Mensch-Computer-Interaktion anhand von Blickbewegungen. Dissertation ETH Nr. 8707, Eidgenoessische Technische Hochschule, 1988. Graf, W., Sigl, F., van der Heiden, G. & Krueger, H. The applicability of eye movement analysis in the ergonomic evaluation of human-computer interaction. In: B. Knave and P.-G. Widebäck (Eds.) Work With Display Units 86. (pp. 803-808), Elsevier, 1987. Groner, R., d'Ydewalle, G. & Parham, R. (Eds.) From Eye to Mind: Information Acquisition in Perception, Search, and Reading. North-Holland, 1990. Kahneman, D. Attention and Effort. Prentice-Hall, 1973. Larkin, J. & Simon, H. Why a diagram is (sometimes) worth ten thousend words. Cognitive Science, 11, (1987) 65-99. OSF/Motif Style Guide. Open Software Foundation. Prentice Hall, Revision 1.1 (1991), p. 4/44. Rauterberg, M. & Cachin, C. Locating the primary attention focus of the user. In: T. Grechenig & M. Tscheligi (Eds.) Human Computer Interaction. (Lecture Notes in Computer Science, 733, pp. 129-140), Springer, 1993. Rauterberg, M. Explizites und implizites Design multimedialer Informationssysteme. multiMEDIA, 8, (1993) 11-14. Scott, D. Visual search in modern human-computer interfaces. Behaviour and Information Technology, 12(3), (1993) 174-189. Scott,D. & Findlay, J. Future attractions: a visual search study of computer icons and words. In: E. Lovesey (Ed.) Contemporary Ergonomics 1990. (pp. 246-251), Francis & Taylor, 1991. Yarbus, A. Eye movements and vision. Plenum Press, 1967.