Modern aircraft use computer screens with a push button interface to replace a
variety of ... Such multifunction displays (MFDs) are gradually being introduced ...
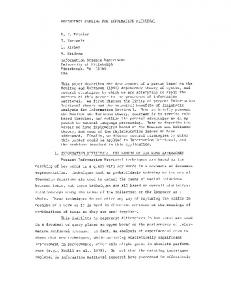
USAARL Report No. 98-33
Designing Optimal Hierarchies for Information Retrieval with Multifunction Displays
By Gregory Francis Purdue University
C30
Aircrew Health and Performance Division
CP C00
July 1998
Approved for public release, distribution unlimited
U.S. Army Aeromedical Research Laboratory Fort Rucker, Alabama 36362-0577
Notice Qualified requesters Qualified requesters may obtain copies from the Defense Technical Information Center (DTIC), Cameron Station, Alexandria, Virginia 22314. Orders will be expedited if placed through the librarian or other person designated to request documents from DTIC. Change of address Organizations receiving reports from the U.S. Army Aeromedical Research Laboratory on automatic mailing lists should confirm correct address when corresponding about laboratory reports.
Dis~gitin Destroy this document when it is no longer needed. Do not return it to the originator.
Disclaimer The views, opinions, and/or findings contained in this report are those of the author(s) and should not be construed as an official Department of the Army position, policy, or decision, unless so designated by other official documentation. Citation of trade names in this report does not constitute an official Department of the Army endorsement or approval of the use of such commercial items. Hiuman use Human subjects participated in these studies after giving their free and informed voluntary consent. Investigators adhered to AR 70-25 and USAMRMC Reg 70-25 on Use of Volunteers in Research. Reviewed:
MORRIS R. LATTIMORE, JR. Colonel, MS Director, Aircrew Health & Performance Division Released for publication:
JC•IN A. CALDWELL, Ph.D. Ctairman, Scientific Review• Committee
I,"FI'o I.',
CHRYt GAFFNE Colonel, MC, SFS Commanding
Unclassified SECURITY CLASSIFICATION OF THIS PAGE
REPORT DOCUMENTATION PAGE
OMB No.0704-0188
lb. RESTRICTIVE MARKINGS
la. REPORT SECURITY CLASSIFICATION
Unclassified 3. DISTRIBUTION / AVAILABILITY OF REPORT release, public I Approved for
2a. SECURITY CLASSIFICATION AUTHORITY
5. MONITORING ORGANIZATION REPORT NUMBER(S)
4. PERFORMING ORGANIZATION REPORT NUMBER(S)
USAARL Report No.
98-33
6a. NAME OF PERFORMING ORGANIZATION
U.S.
7a. NAME OF MONITORING ORGANIZATION
6b. OFFICE SYMBOL
U.S.
(Ifapplicable)
Army Aeromedical
Army Medical Research and Materiel
Command
MCMR-UAD
Research Laboratory
7b. ADDRESS (City, State, and ZIP Code)
6c. ADDRESS (City, State, and ZIP Code)
P.O. Box 620577 Fort Rucker, AL
distribution
unlimited
2b. DECLASSIFICATION IDOWNGRADING SCHEDULE
Fort Detrick Frederick, MD
36362-0577
8a. NAME OF FUNDING ! SPONSORING ORGANIZATION
21702-5012
9. PROCUREMENT INSTRUMENT IDENTIFICATION NUMBER
8b. OFFICE SYMBOL (If applicable)
10. SOURCE OF FUNDING NUMBERS PROJECT PROGRAM ELEMENT NO. NO.
8c. ADDRESS (City, State, and ZIP Code)
TASK NO.
PB
30162787A879
62787A
WORK UNIT ACCESSION NO.
DA336445
11. TITLE (Include Security Classification)
Designing Optimal Hierarchies for Information Retrieval With Multifunction Displays
(U)
12. PERSONAL AUTHOR(S)
Gregory Francis 13b. TIME COVERED
13a. TYPE OF REPORT
Final
FROM
14. DATE OF REPORT (Year, Month, Day)
15. PAGE COUNT
1998 July
TO
64
16. SUPPLEMENTAL NOTATION
18. SUBJECT TERMS (Continueon reverse ff necessary and identify by block number)
COSATI CODES
17.
FIELD
GROUP
SUB-GROUP
Cockpit design,
hierarchy,
multifunction displays,
workload 19. ABSTRACT (Continue on reverse if necessaryand identify by block number)
Modern aircraft use computer screens with a push button interface to replace a variety of Such multifunction displays (MFDs) are gradually being single-purpose instruments. introduced into military helicopters, with future aircraft likely to be highly dependent Studies have shown that poor design of MFD hierarchies has a significant on computers. The purpose of this study was to extend a impact on user satisfaction and performance. theoretical analysis of hierarchy search into a methodology for gathering data and building a hierarchy layout that minimized the time needed to find items in a hierarchy. Pilot studies demonstrate the effectiveness of the methodology and show that optimizing hierarchy layout may lead to a 25% reduction in search times.
20. DISTRIBUTION / AVAILABILITY OF ABSTRACT SAMEASRPT. [] X UNCLASSIFIED/UNLIMITED 22a. NAME OF RESPONSIBLE INDIVIDUAL
Chief,
Science Support Center
DD Form 1473, JUN 86
]
DTIC USERS
21. ABSTRACT SECURITY CLASSIFICATION Unclassified 22b. TELEPHONE (Include Area Code)
(334) Previouseditions are obsolete.
255-6907
22c. OFFICE SYMBOL
MCMR-UAX-SS SECURITY CLASSIFICATION OF THIS PAGE
Unclassified
Table of contents
Page Introduction .....................................................................................................................
1
General approach .......................................................................................................
3
A hierarchical interface .................................................................
........ 3
Measuring motor time ................................................................... ....... 5 Measuring categorization time ................................................................... 5 Optimizing hierarchical layout ................................................................
7
Testing ..........................................................................................................
7
Example 1 .......................................................................................................................
7
Example 2 .....................................................................................................................
12
Conclusions ...................................................................................................................
12
References ....................................................................................................................
15
Appendix A. Hierarchy search computer software ....................................................
17
Appendix B. Summary of Java classes ....................................................................
18
Appendix C. Java source code ................................................................................
28
List of figures
Page 1. Schematized drawing of two pages from an MFD display and its push-button 2
interface .......................................................................................................................... 2. Three displays from the program designed to investigate user interactions in hierarchical search .....................................................................................................
4
3. The program for measuring motor time .....................................................
6
4. Mean search times
9
...........................................
5. Hierarchy displays along the path to Monterrey, Mexico, for the optimized hierarchy. .....................................................................................................................................
11
6. Mean search times for users in the second pilot study ..........................................
13
A-1. The Java classes written to explore hierarchy searches .....................................
17
iiW
Introduction Military and civilian aircraft in the 1960's and 1970's used many separate gauges, dials, lights, switches, buttons, circuit breakers, control wheels, and levels in tightly packed aircraft cockpits. The introduction of new instruments and data sources forced a competition for limited cockpit space. This competition was partly alleviated by the introduction of microcomputers and video displays into the cockpit environment. Multifunction displays (MFDs), capable of presenting a variety of information from different sources, replaced many electromechanical devices, thereby freeing room in the aircraft cockpit. Current MFDs are often similar in appearance and usage to automated teller machines in that crew members push buttons to move through a hierarchy of display pages containing instructions, information, or lists of user-activated functions. They increase the total amount of available information, with the limitation that only some of it is visible at any given time. An additional benefit of MFDs is to provide a simpler layout of cockpit instrumentation, so that crew members spend less time scanning for information and more time piloting the aircraft. The reduction in pilot workload due to the introduction of MFDs in the cockpit was a primary factor in eliminating the need for flight engineers in many current generation transport aircraft. Figure 1 schematizes MFDs as they are used in a variety of modern aircraft. Information is supplied on a large computer monitor. Push-buttons surround the monitor to allow the crew to interface with the MFD computer. Figure 1A shows real-time status information from the aircraft engines and other aircraft systems (SYS). Figure 1B shows targeting information. The push-buttons along the sides of the MFD are associated with software-generated display labels, indicating jumps to additional display pages containing related information. Pressing a soft-key causes the MFD to display a new page containing the information or functions indicated by the key's label. MFDs typically contain a wide range of single and multistep functions. The type of objects and information displayed on the MFD, the data acquisition channels that are represented by the displayed objects, the set of active database links, as well as the functions that soft-keys can activate are commonly grouped together logically on one or more interconnected display pages. Pilots dynamically select a display based on the information and functionality desired to accomplish changing flight management or combat tasks such as situational awareness, navigation, communications, systems monitoring, battlefield and threat monitoring, and targeting. Despite the significant impact of MFDs on the layout of instrumentation in aircraft cockpits and the responsibilities of crew members, little is known about how users search for information in such systems. Several studies have investigated the physical characteristics of the displays and the push-button interface (e.g., Rash and Becher, 1982; Hannen and Cloud, 1995; Klymenko et al., 1997). These studies help insure that crew members can see the monitor and reach the buttons for a variety of conditions (e.g., direct sunlight using protective gloves). Other studies explore the opportunity to create new types of information displays (e.g., Braithwaite et al., 1997). In contrast, there has been little research to insure that crew persons can quickly search through the hierarchy of information in the MFD database to retrieve needed information.
1
A.
B
I,® Oi0l0OlOl0l
siOlOlOllolo I•
0S
0_
"U
OL
-f ~-
~HI
00
".',,,••] =$a
l•t •" ~I -- :M!®!®!81811l1l1El "-÷1O181,
Figure 1. Schematized drawings of two pages from an MFD display and its push-button interface.
In A, the systems page shows information on engines and includes legends along the right to indicate that pressing the associated button will cause the display to present the requested information. In B, the same display screen shows a page with targeting
information. The military guidelines (MIL-STD-1472D) for development of the hierarchical structure of information in the MFD provide few instructions and little justification. The small number of studies investigating hierarchy design issues may reflect the difficulty of the problem. As described in Francis and Reardon (1997), small changes in part of a hierarchy can have profound effects on search times elsewhere in the hierarchy. Such sensitivity makes general guidelines difficult to apply. As a result, hierarchy creation currently remains an artistic endeavor, depending primarily on
the experience and intuition of the designer. The few studies exploring the impact of hierarchy design suggest that it is important. In nonmilitary domains, hierarchy design has been identified as a key factor in overall performance and satisfaction with an MWD type device (Seppala and Salvendy, 1985; Cook and Woods, 1996). Studies using simulated military aircraft suggest that MFD hierarchy design may affect crew workload and situation awareness (e.g., Reising and Curry, 1987; Sirevaag et al., 1993). To promote a more rigorous analysis of hierarchy design, Francis and Reardon (1997) developed a mathematical framework that considers a variety of factors in hierarchy design. The current document shows how to apply that framework to particular cases of hierarchy design.
2
General approach MFDs trade a search of physical space for a search of virtual space through the hierarchy of information. Other things equal, it is desirable to arrange the hierarchy of information in a way that minimizes the search time. Francis and Reardon (1997) provided a theoretical framework to consider this issue. They identified an optimization method that chooses the best layout of information in the hierarchy. For the optimization method to succeed, it required a model of the time needed to search through the virtual space of the MIFD hierarchy. In this section, we briefly summarize the model proposed by Francis and Reardon and show how to apply it to a particular design task. Each page in an MFD hierarchy defines a unique path of button pushes that terminates when the page is shown. Measuring the time to reach a hierarchy page requires knowing the time needed to move to and push the various buttons along the path to the page. These movement and push times all contribute to a motor term. These times are possibly distinct from the time required to decide which button to push. Such decisions require reading various choices until the option leading to the target page is identified. The times to read, interpret, and decide to select contribute to a categorizationterm. Together with any computer response time, this analysis suggests that the time to reach a page in the hierarchy will be: T = (motor) + (categorization) + (computer response). Each of these terms is likely to vary with the pattern of button pushes that define the path, the options to be categorized along the path, and the information displayed by the computer. By considering the variations in these variables for different buttons and items, the optimization method selects a layout that maximizes performance according to any designer-imposed constraint. This approach uses information in the details, or microstructure, of the humancomputer interface to maximize performance. The analysis in Francis and Reardon (1997) was theoretical; it described equations and techniques for identifying an optimal layout of information when specific data were available. We now explore methods for gathering the needed data and demonstrate the utility of the method. For that purpose, we developed a suite of computer prograems to investigate hierarchical searches. The programs will be described briefly in the ensuing text and more fully in the appendices. The next section describes the basic interface used to explore hierarchical search. Data were gathered from this interface.using methods described in subsequent sections. The data were then used to build an optimal layout of pages that considers the microstructure properties of the human-computer interaction. The validity of the optimization method was then verified with further experimentation. A hierarchical interface To investigate the microstructure of hierarchical information retrieval, we wrote a program in the Java programming language that allowed users to select virtual buttons with mouse controls. Selecting a button moved the user through a virtual hierarchy of information and generated a new set of options associated with each button. Figure 2 shows snapshots of the interaction window at various positions along a path to a target item. In this case, the display portrays
-
3
-
Tai RPM, Rotor
-
Ta
-
20
TaIlRPM, Rotor
120
-
TaIllRPM, Rotor mC
120-Figure 2. Three displays from the program designed to investigate user interactions in hierarchical search. The user is given a target item in the center of the window and moves through the hierarchy to find the item. The user moves through the hierarchy with successive mouse clicks on the appropriate buttons to reach the target. A shows the top level, where buttons code major systems in a helicopter. B shows a screen from the second level, where buttons code various aircraft systems. C shows a screen from the bottom level, where buttons code various types of rotor information, including TailRPM, the target item.
4
aircraft information suitable for use in a military helicopter. After pressing the Next target button, a target item (sometimes paired with its parent to help the user find it) was displayed in the center frame. The user was to move through the hierarchy toward the target item as quickly as possible. Figure 2a shows the top level of the hierarchy, where the options are various aircraft information and the target is Tail-RPM,Rotor. Selecting the Aircraft-SYS button changes the labels on the buttons to those shown in Figure 2b, where the options are various choices in aircraft systems. Selecting the Rotor button changes the labels to those in Figure 2c, which show options for the rotor system. Selecting the Tail-RPM button means that the user has found the desired item. This basic scheme was used in a number of different ways to explore hierarchical search. Measuring motor time Defining the motor term of the model requires identifying the time needed to make button presses and to move the mouse control between buttons. This cannot be done during a normal hierarchical search because the time to find an item includes both the time to physically push the correct buttons and the time to categorize items. We hypothesized that the motor time could be isolated in a situation where the user knew in advance where to move the mouse control. In such a situation there would be no categorization time. Thus, we created a program that required the user to select pairs of buttons. Figure 3 shows a snapshot of the program window. Each button is numbered between 0 and 7. The center region specified the pair of buttons that were to be pressed in succession. The program measured the time between the first and second button presses. This measure was repeated for every combination of successive button presses, including repeated selection of the same button. (The only exception was that the user was never asked to make a movement that ended in the Next target button, as such movements never occurred during searches of the hierarchy.) The time for each movement was measured several times, and the average stored in a file for later use. Because the user could plan the movement before the first button press, we hypothesized that the movement time was a pure measure of how long it took to physically move and initiate the mouse control. Measuring categorization time The optimization technique described in Francis and Reardon (1997) required, in addition to the motor times, the time needed to categorize items. Unlike the technique for measuring motor times, there seems to be no direct method of measuring categorization times. Any measure of response time necessarily will include both categorization and motor times. We need to disentangle these terms so that the model can predict response times when the hierarchical layout is restructured and the items are paired with new motor times. To disentangle response times, we modified the basic hierarchy search program so that it measured the time between successive button presses as the user went through a path toward a target item. The time between button presses was coded by item name and stored in a file for later use. We refer to these measures as between item search times.
5
7-> 0
215 Figure 3. The program window for measuring motor time. The center panel displays a
sequence of button presses for the user to perform. The program measures the time between the first and second button press. Since the user can find the buttons to be pressed before starting the movement, the time should include only motor time. Motor time was measured in this way for every pair of buttons. Next, we used the previously measured motor times between button presses and the between item search times to derive categorization times. We used the following logic. The between item search time includes both motor and categorization time. Thus, subtracting the motor time from the between item search time should leave an estimate of the categorization time. This calculation was performed for every item in the hierarchy. This approach has the benefit of avoiding another difficult problem in measuring categorization times. Previous attempts to model hierarchical search have noted that performance critically depends on the search strategy utilized by the user (Lee and MacGregor, 1985; Paap and Roske-Hofstrand, 1986; Vandierendonck, Van Hoe and De Soete 1988). In an extreme case, if the user is very familiar with searching through the hierarchy and knows the button presses needed to reach each item, categorization time will be negligible. On the other hand, if the user has no experience searching through the hierarchy, categorization time will be substantial and highly dependent on the details of the user's strategy. More commonly, a user will know the button presses needed to reach some items in the hierarchy but will need to search
labels to find the path for other items. Such effects are likely to be highly dependent on the items in the hierarchy and their significance to a particular user, so there is probably no way to model
the effects of learning. Our measure of categorization time avoids modeling learning effects by measuring the resulting behavior that depends on those effects. From the point of view of predicting search times, it does not matter why some items are categorized more quickly than others, what does
6
matter is how long it takes to categorize each item. Our measure calculates the needed information directly without worrying about the underlying details. With the motor and categorization data, it is possible to predict the time required by the user to find an item for any layout of information in the hierarchy. To make this prediction for a single item, the computer simply notes the path needed to reach the target item, the buttons that must be pushed along that path, and the items that must be categorized along the path. The time for all button pushes and movements and the time for all categorizations sum to equal the predicted search time. Optimizing hierarchical layout With the ability to predict search times for any layout of information in the hierarchy, it is possible to search through different layouts for the one that minimizes expected search time. Unfortunately, there are so many different possible distributions of items in the hierarchical structure that it is not feasible to consider them all. Instead, we used a computational technique called simulated annealing, as described in Francis and Reardon (1997). This computational algorithm sifts through the possible hierarchical layouts to consider only those that have the best chance of generating small search times. While the algorithm does not guarantee to find the optimal layout of items in the hierarchy, in practice it usually produces a layout with a search time close to the optimal. Testing A final program takes the hierarchical layout generated by the optimization program and generates the button interface for user interaction. As the user searches for specified target items, the computer keeps track of the search times. After the user is finished searching for items, the program writes to a file the predicted mean search time (as generated by the optimization program) and the mean actual search time (as measured during the user's interaction). These are then compared to each other to consider the accuracy of the model's predictions. They are also compared to the original time required to search for items in a nonoptimal hierarchical layout of items. The next two sections describe pilot studies that used this general approach to hierarchy design.
Example 1 The first example shows application of the method using data gathered from a single user (the first author). The hierarchy portrayed geographical information (continent, country, city) instead of the aircraft information portrayed in Figure 2. This change was incorporated to insure that subjects not familiar with aircraft systems could participate. The methodology of building an optimal hierarchical layout remains the same regardless of the information in the hierarchy. Subjects were asked to move through the hierarchy to click on the button for a city, country, or continent.
7
The programs described above were run on a laptop computer. Of note, the mouse control was utilized through a touchpad device, which is common on a variety of laptop computers. A touchpad is a.small touch-sensitive pad. A light touch on the pad gives the user control of the cursor placement. Dragging a finger along the surface of the touchpad moves the mouse cursor in the same direction. A mouse click is initiated by quickly tapping twice on the touchpad in the desired location. The touchpad device is useful for laptop computers because it offers the functionality of a mouse with small space requirements. However, precise control of cursor movement is somewhat difficult with the touchpad, and correction adjustments are frequently necessary. It is also sometimes difficult to start and stop movement of the mouse cursor, especially for small movements. As a result, sometimes a larger movement can be accomplished more quickly than a short movement. None of these characteristics affected the basic approach to hierarchy design, and motor movement times were gathered as described above. For each movement, the average of 10 replications was used as the measure of motor time. If all items in the hierarchy are accessed equally often, and the user is very familiar with the path for each item, there is no difference between hierarchical layouts. Such situations are probably very rare. For most MFD applications, some items are searched for more often than others. The goal of the design proes is to place frequently searched items at the end of hierarchical paths that are quickly accessed. To emulate the inhomogeneity of search frequency, we created artificial missmon scenarios. Each scenario required the user to search for a fixed set of 20 randomly selected items from the full (268 item) set. In each scenario 10 of the items were searched for 5 times and the other 10 were searched for once. For each scenario, we gathered categorization data and built and tested an optimal hierarchy. To gather categorization data, the hierarchical layout was partially randomized so that every item was located underneath its appropriate header category, but was in a random (fixed) position under that header (e.g. each city remained under its appropriate country, but was randomly assigned to a button). The randomization was used to insure that there were no order cues (e.g. alphabetical order) that would guide the user's search process. A scenario was run twice. On the second run of the scenario, between-item time was measured for each item encountered in the hierarchy. These items included both the target items in the mission scenario and the items located along the paths to reach the target items. We did not use data from the first run of the scenario, as it would likely show strong learning effects for those items frequently searched. The average between-item time for every item in the hierarchy was stored in a file to be used by the optimization program. A program that created an optimal hierarchy converted the motor time data and the betweenitem data into independent motor time data and categorization time data. For the mission scenario, the program then considered different hierarchical layouts to identify the one that minimized predicted search time. This was a time-consuming process, requiring approximately 45 minutes for a scenario. When the optimization procedure finished, it wrote to a file the hierarchical position of each item. Finally, a testing program read in the hierarchical data generated by the optimization program, and the user participated in two runs of the scenario. The testing program gathered data on the second run of the scenario to measure the mean time to reach an item in the optimal hierarchy. Figure 4a shows the expected time required to find a single item in the hierarchy for three different mission scenarios. For each scenario, three values are plotted: the expected search
A 4.5 4 Mean
3.5
search time
(seconds)
3-*
Random
2.5 2 1.5
• Random e Optimal (predcted) Optimal (actual)
1 0.5 0 1
3
2
Average
Scenario
B 4.5 4 3.5
Mean search time (seconds)
3 2 2 1.5 1
0.5 0
Alphabetical
Random
Optimal (predicted)
Optimal (actual)
Layout style
Figure 4. Mean search times. A shows expected search times for three scenarios and the average. Three measures are plotted for each scenario. Random indicates that the layout of information was randomly ordered on its appropriate page. Optimal (predicted) is the model's prediction of expected search time, using the layout of information that minimizes predicted search time. Optimal (actual) is the search time for the optimal layout as measured through user interaction. B shows averages across three trials for alphabetical, random, and optimal layouts.
9
time for the random hierarchy (used to gather between-item data), the model-predicted expected search time for the optimal hierarchy, and the actual (from user testing) expected search time for the optimal hierarchy.. Averages across the three scenarios are also plotted. For the random hierarchies it took approximately 4 seconds to find an item in the hierarchy. When the items were rearranged according to the optimization procedure, it took approximately 3 seconds to find an item. This corresponds to a 25% reduction in search time, a substantial savings when one considers the large number of searches in an MFD. Also noteworthy is the close correspondence between the predicted and actual performance on the optimal hierarchy. (By its design, the model must agree perfectly with user performance on the random hierarchies.) The strong agreement between the predicted and actual performance suggests that the model of search times accurately captures many of the important characteristics of hierarchical search. Finally, we wanted to compare the performance on the random and optimal hierarchies to what we suspect would be the default ordering in many situations. We measured mean search times for situations where the hierarchy items were ordered alphabetically on the buttons. Figure 4b shows the averages of three scenarios for the alphabetical, random, and optimal hierarchies. The alphabetical search times are similar to the random search times, and both are substantially larger than the optimal search time. It is instructive to note some characteristics of the optimal layout. With the touchpad mouse controller, it takes substantial time to initiate a movement. As a result, the optimal layout created paths for the most frequently used items that involved repeated pressing of the same button. Figure 5 demonstrates the path for a commonly accessed item. Those items that could not be placed along a repeating path had paths that minimized movement time. In general, this organization is consistent with the guidelines suggested by military standards (MIL-STD1472D). However, the computational method considers more. Certain buttons were more easily accessed than other buttons and certain paths in the hierarchy were more often traversed than other paths. It is no trivial task to decide which set of paths should be associated with which buttons because changing the location of one item requires additional changes among the children of that item. At the same time, one cannot identify the best location of items at the top levels without considering the best locations of items of their children. This type of circular dependence makes the layout choices very complicated. The computational approach is able to weigh all these dependencies simultaneously to generate the best overall hierarchical structure. The overall feel of searching for information was that the target item would likely be found where the user expected it to be and would be easily accessible. We suspect that in addition to reducing search times, such optimal hierarchies will produce fewer errors and increase overall user satisfaction. We have not yet investigated these issues.
10
-A
Monterrey, Mexico %4WMt S. ..
. . . .. . . ..
......................
. ............. . . . ...............................................................
......... ......
B
19 NOt
S~Monterrey, Monterrey, Mexico Mexico,
t
iz
er
19 ...............................
Monterrey, Mexico
19
Figure 5. Hfierarchy displays along the path to Monterrey, Mexico, for the optimized hierarchy. The user needs to make only one movement (from Next target to N_-America) and then simply pushes the same button repeatedly to move through the hierarchy. Items that cannot be placed in such paths (because of interference from other item paths) are placed on paths that minimize movement time.
Eample2 A second study was run to insure that the methodology was general to a number of different conditions. For this purpose, three additional users participated. None had extensive practice working with the geographical hierarchy interface. The programs were run on a PC computer with a standard hand-held mouse. For subject 1, motor time estimates were based on the average of five replications for each movement. The mission scenario was created in the same way as in Example 1. For subjects 2 and 3, motor time estimates were based on the average of three replications for each movement. The mission scenario consisted of seven different items, with individual items assigned a unique number of replications ranging from 1-7. For these users there were 28 target searches. Figure 6 plots the mean search times for the users. The mean search times are generally smaller than for Example 1, probably indicating the more efficient control of the hand-held mouse versus the touch-pad device. The effects of optimization are not as strong as in Example 1. This could be because the users were less practiced searching through the hierarchy and made more mistakes (two participants indicated that they sometimes forgot which continent was associated with a country). Consistent with this interpretation, user 3 seems to show strong practice effects. If such a result were verified, it would emphasize the importance of gathering data from experienced users (which are more likely to mimic crew persons in military aircraft). There may also be floor effects where the advantage of repeated button pushes is not as great for the hand-held mouse as for the touch-pad device. Despite these possible confounds, the optimal hierarchies did result in overall shorter search times than the random hierarchies. For subject 1, additional explorations of search times with alphabetized hierarchies found mean search times slightly above 4 seconds.
Conclusions We have developed a methodology to apply the theoretical framework of Francis and Reardon (1997) to the design of hierarchy layouts. The key insight in this methodology is to factor between-item times into motor and categorization times. By measuring motor times separately and subtracting them from between-item times, the method avoids many complicated issues that would otherwise prevent accurate prediction of search times. We developed computer software to explore hierarchy search and gather data for designing optimal hierarchies. Two pilot studies demonstrate the utility of the methodology. The hierarchies that minimized predicted search time were found to be substantially better than random or alphabetically organized hierarchies. The results verified the benefit of optimizing hierarchy layout and also verified the adequacy of the model at predicting search times.
12
5 4.5 4 3.5 Mean 3 search 2.5 time 2 (seconds) 1.5 1 0.5 0-
U Random E Optimal (predicted) E Optimal (actual)
11" 2 1
-I-
1I Average
3
User Figure 6. Mean search times for users in the second pilot study. The optimized hierarchies resulted in shorter search times than the random hierarchies. To apply the methodology to the design of real MFDs requires gathering motor time in a real (or accurately simulated) cockpit, accurate measures of between-item search times, and good measures of the frequencies with which crew members use the various MFD functions. With this data, it should be possible to optimize the layout of items on buttons and reduce search times. However, one should consider a number of other issues before applying the optimization approach to MFDs in cockpits. First, there may be some functions that must be reached within specific time constraints or they are of no use to the crew (e.g., taking evasive action under fire). The optimization method should take such constraints into account. Second, the motor time data may vary depending on the function being searched for. For example, a pilot going through checklist procedures before take-off may need to spend very little time on flight controls and can quickly move through button pushes of the MFD. In contrast, a pilot taking evasive actions under fire may need to keep his hands on flight controls as much as possible, thereby increasing the average time needed to push buttons on the MFD. The model of search times needs to consider that some items may be associated with conditions that necessarily slow search time. With such considerations, the optimization method can design the hierarchy layout to accommodate those restrictions. Third, real MFDs often place restrictions on which buttons can be used. For example, in Figure 1A, the entire left side of the display is covered by engine information and is unavailable for labels linking to other pages. Such restrictions have not been considered in the hierarchy search programs considered here. Fortunately, there is nothing in the basic methodology to prevent consideration of these issues. Their resolution may require additional programming and data collection, but the theoretical framework remains unchanged. A related issue concerns user variability. Even in the pilot studies, there are notable differences between participants' search times (there were differences in the mission scenarios as well). An MFD in an aircraft must accommodate a variety of users. As such, proper design of the hierarchy must gather data from a variety of users and create a distributionof motor and categorization times. With such data, it should be possible to design the hierarchy so that it
13
optimizes performance over the distribution of users. Nothing in the methodology prevents such design, although it will require that substantial amounts of data be gathered from a variety of users.
The current work provides the first, to our knowledge, scientific method to optimize hierarchical layout that considers the details of the human-computer interactions. Our analysis and experimental results suggest that the method may have a significant impact on usability of
MFDs. Given the growing use of MF~s in both military and civilian aircraft, it is important to insure that they are designed to allow efficient retrieval of information. Our methodology provides a means to that end.
14
References Braithwaite, M., Durnford, S., DeRoche, S., Alvarez, E., Jones, H., Higdon, A., and Estrada, A. 1997. Flight simulator evaluation of a novel display to minimize the risks of spatial disorientation. Fort Rucker, AL: U.S. Army Aeromedical Research Laboratory. USAARL Report No. 97-11. Cook, R. and Woods, D. 1996. Adapting to new technology in the operating room. Human Factors. 38: 593-613. Department of Defense. 1981. Military standard: Human engineering design criteria for military systems, equipment. and facilities. MIL-STD-1472D. Flanagan, D. 1996. Java in a nutshell. O'Reilly & Asociates, Sebastopol, CA. Francis, G. and Reardon, M. 1997. Aircraft multifunction display and control systems: A new quantitative human factors design method for organizing functions and display contents Fort Rucker, AL: U.S. Army Aeromedical Research Laboratory. USAARL Report No. 97-18. Hannen, M., and Cloud, T. 1995. A case study in the design and testing of hands-on controls: The Longbow Apache grip development process. In: Proceedings of the American Helicopter Society 51 st Annual Forum. 1417-1435. Klymenko, V., Harding, T., Martin, J., Beasley, H., Rash, C. and Rabin, J. 1997. Image quality figures of merit for contrast in CRT and flat panel displays. Fort Rucker, AL: U.S. Army Aeromedical Research Laboratory. USAARL Report No. 97-17. Lee, E., and MacGregor, J. 1985. Minimizing user search time in menu retrieval systems. Human Factors. 27: 157-162. Morrison, M. (ed.) 1997. Java Unleashed: Second Edition. Sams.net Publishing, Indianapolis, IN. Paap, K., and Roske-Hofstrand, R. 1986. The optimal number of menu options per panel. Human Factors. 28: 377-385. Rash, C., and Becher, J. 1982. Analysis of image smear in CRT displays due to scan rate and phosphor persistence. Fort Rucker, AL: U.S. Army Aeromedical Research Laboratory. USAARL Report No. 83-5. Reising, J., and Curry, D. 1987. A comparison of voice and multifunction controls: Logic design is the key. Ergonomics. 30: 1063-1077. Sirevaag, E., Kramer, A., Wickens, C., Reisweber, M., Strayer, D., and Grenell, J. 1993. Assessment of pilot performance and mental workload in rotary wing aircraft. Ergonomics. 36: 1121-1140.
15
Seppala, P. and Salvendy, G. .1985. Impact of depth of menu hierarchy on performance effectiveness in a supervisory task: Computerized flexible manufacturing system. Humn Factors. 27: 713-722. Vandierendonck, A., Van Hoe, R., and De Soete, G. 1988. Menu search as a function of menu organization, categorization, and experience. Acta Psychologica. 69: 231-248.
16
Appendix A. Hierarchy search computer software The appendices describe the computer software used to investigate hierarchical search. All software was written in the Java programming language (for a discussion of Java, see Flanagan, 1996; Morrison, 1997). This language was chosen because it has built-in commands for creating windows, buttons, and handling user interfaces. Java programs also have the advantage of being machine-independent, meaning that the programs will run on any machine platform (PC, Macintosh, Unix), provided that platform supports a Java virtual machine. Java is an object oriented programming language, meaning the programmer defines classes that contain attributes and methods for manipulating the attributes. One benefit of this programming approach is that a class can inherit characteristics of another class, thereby reducing the need to rewrite code. Figure A-1 shows the relationships between the classes used to investigate hierarchical search. ierarchyPage isplay.eHierarchy
r tu
otorimie
I
rulld~ptimalHierarchy
Figure A-1. The Java classes written to explore hierarchy searches. HierarchyPage provides data structures and methods useful for working with an item in the hierarchy. It is used by many of the other programs. Displayffierarchyis a class for basic windowing and interfaces with a given hierarchy and mission scenario. The classes Practice,SearchTime, TestHierarchy,and MotorTime all derive from this class and add or change methods to compute different statistics and read/write to different files. Setup provides a general scheme for creating a hierarchy structure. Optimize modifies the general scheme to create an optimal hierarchy. BuildOptimalHierarchyprovides an interface to go through each step in the process of building a hierarchy optimized for a single mission scenario.
17
Appendix B. Summary of Java classes This section provides object specifications for each Java class used. For each class, the object specification provides a brief description of the class' purpose, the attributes associated with the class, and the methods used by the class to carry out calculations.
Description The HierarchyPage class represents an item in the hierarchy. It keeps track of the item name, the path of button pushes needed to reach the item, the single-number position that corresponds to the path, the frequency with which the page is searched for, and the level at which the button path terminates. Attributes name
String
The name of the page.
categorizetime
int
Astatistic of how long it takes to reach the page. Its precise definition depends on the class that invokes the HierarchyPage.
path
int a
num_replics
int
An array that describes the sequence of button pushes needed to reach the page. The number of times the page is to be searched for in the mission scenario.
replics
int
The number of times the page has been searched for.
num buttons
int
The number of buttons in the hierarchy.
num levels
int
The number of levels in the hierarchy.
Methods/Events ~ ~ ~ ~~~~. "I•:::