Int. J. Electrochem. Sci., 3 (2008) 918 - 934 International Journal of
ELECTROCHEMICAL SCIENCE www.electrochemsci.org
EQCM Study of the Adsorption/Desorption Processes of Polyethyleneglycol with Molecular Weight 20,000 on Pt in Perchloric Acid Solution A. Méndez1, P. Díaz-Arista1, L. Salgado2, Y. Meas1, G. Trejo1,* 1
Centro de Investigación y Desarrollo Tecnológico en Electroquímica (CIDETEQ). Parque Tecnológico Sanfandila, Pedro Escobedo, Querétaro, A. P. 064. C.P. 76703, Querétaro, México 2 Universidad Autónoma Metropolitana-I, Area de Electroquímica. Apdo. Postal, D.F. C.P. 09340, México * E-mail:
[email protected] Received: 5 May 2008 / Accepted: 4 June 2008 / Online Published: 30 June 2008
The adsorption of polyethyleneglycol with molecular weight 20,000 (PEG20000) on a Pt-QCM electrode was investigated using an electrochemical quartz crystal microbalance (EQCM). A study of the adsorption of PEG20000 on the surface of the Pt-QCM at the open circuit potential showed that the mass adsorbed reached a stationary value with time. In addition, the adsorption of PEG20000 did not interfere with the oxidation of the Pt surface to form a PtO film. Analysis of simultaneously recorded voltammograms and massograms disclosed that during the potential scan in the negative direction, three processes occur involving the partial desorption from the Pt surface of different species formed by the degradation of PEG20000. During the positive potential scan, an oxidation/adsorption process was observed in the potential range 0.10 to 0.60 V. This process involves the oxidation of products from the reduction of PEG20000, and corresponds to the oxidation of an alcohol ( H - O - (CH2 − CH2 − O)8 − CH2 − CH3 ) to form the corresponding adsorbed carboxylic acid ( CH3 − CH2 − (O − CH2 − CH2 )6 − (O − CH 2 - CH2 - O − CH2 − COOH)ads ).
Keywords: Adsorption, EQCM, Massogram, Polyethyleneglycol
1. INTRODUCTION Polyethoxylated compounds are of great importance in the galvanoplastics industry, where they are principally used as additives in electrolytic baths. Additives have come to be indispensable components of electrolytic baths because their presence substantially improves the quality of the metal coatings obtained. The advantageous effects of additives on the morphology and physical properties of metal coatings include the following: reduction of the grain size of the metallic crystals, which aids in
Int. J. Electrochem. Sci., Vol. 3, 2008
919
the production of smooth, adherent and shiny coatings [1-4]; modification of the crystallographic orientation of the coating; and increased corrosion resistance [5]. The beneficial effects of adding polyethyleneglycol (PEG) to an electrolytic bath have motivated growing interest in the effects of these additives on the morphologies and physical properties of the deposits. In general, the effects of PEG on the morphological characteristics of electrodeposited coatings principally stem from adsorption of the additive molecules on the electrode surface [6-7]. However, in spite of numerous studies of the effects of polyethoxylated compounds on coating characteristics, little is known about the mechanism underlying the adsorption of these compounds on the electrode surface. Recently, on the basis of cyclic voltammetry (CV) data, Safonova et al. [8] proposed that in an H2SO4 electrolyte solution, PEG adsorption onto a Pt/Pt electrode is accompanied by the electrooxidation of PEG molecules (likely via a dehydrogenation mechanism) or by electroreduction of PEG molecules (likely via a hydrogenation mechanism). Using the technique of capacitance measurements, Petri et al. [9] found that PEG molecules are adsorbed on a Au(111) electrode forming two-dimensional condensates. In a study using in situ spectroscopic ellipsometry, Walker et al. [10] showed that PEG is only weakly adsorbed on a Ru electrode in the absence of Cl- ions. In addition, in situ electrochemical scanning tunneling microscopic (EC-STM) images of PEG1000 molecules adsorbed on a Fe (110) surface [11] revealed that PEG1000 has a well ordered structure on this surface. On the basis of this finding, Kim et al. [11] proposed a model for PEG adsorption in which PEG1000 is adsorbed in a planar configuration via the oxygen atoms. Based on Raman spectroscopy data, Healy et al. [12,13] suggested that the type of PEG species adsorbed on an electrode surface depends on the applied potential. Specifically, they proposed that neutral PEG molecules are adsorbed at more negative potentials, where copper deposition occurs, whereas at potentials close to the open circuit potential, PEG adsorbs as a copper chloride complex with the polymer acting as a ligand analogous to a crown ether. In addition, differential capacitance measurements in a PEG-containing H2SO4 electrolyte solution exposed to a copper substrate disclosed that PEG was weakly adsorbed onto the copper surface [14]. Similarly, Hope et al. [15] observed weak adsorption of PEG on steel during the electrodeposition of copper. The weakly adsorbed macromolecules are sufficiently mobile and remain trapped in the deposit by the approaching atomic layer, leading to the incorporation of aggregates rather than individual molecules. In studies using a quartz crystal microbalance and electrochemical impedance spectroscopy, Kelly and West [16,17] found that adding PEG alone to an electrolytic bath had only a small effect on the electrode kinetics, and that Cl- alone promoted the copper deposition reaction. However, they found that when both PEG and Cl- were present in the solution, the PEG monolayer collapsed into spherical aggregates. Using ellipsometry, Bonou et al. [18] found that the adsorption of PEG on a platinum electrode surface depended on the applied potential, with PEG not being adsorbed at the open circuit potential. In addition, various studies suggest that PEG adsorbed on an electrode surface forms a barrier that inhibits metal deposition and increases the overpotential for the discharge of the metal ion, for example Zn(II) [19] or Cu(II) [20], and that the degree of inhibition increases with increasing molecular weight of the polyethoxylated compound.
920
Int. J. Electrochem. Sci., Vol. 3, 2008
Here we present new results on the adsorption/desorption processes of PEG with a molecular weight of 20,000 (PEG20000) on the surface of a Pt-QCM electrode, in perchloric acid solutions. This study was performed using CV in conjunction with a quartz crystal microbalance (QCM).
2. EXPERIMENTAL PART The study of PEG20000 adsorption was performed using solutions S0 (= 0.1 M HClO4) and S0 with 5 µM PEG20000. The solutions were prepared immediately before each electrochemical experiment from ultra-pure water (18 MΩ cm) using analytical grade reagents purchased from J.T. Baker. Before each electrochemical experiment, the solutions was deoxygenated for 30 min with ultra-pure nitrogen (Praxair), and the experiments were carried out under a nitrogen atmosphere at 25.0 ± 0.5 °C. The electrochemical and microgravimetric study was carried out in a conventional threeelectrode cell with a water jacket. A quartz crystal microbalance (Maxtek Mod. 710) and a potentiostat/galvanostat (EG & G PAR Mod. 273A) controlled by independent computers running the software PM710 and EG & G M270, respectively, were used to simultaneously measure electrochemical parameters and the frequency of the quartz crystal. An AT-cut quartz crystal of nominal frequency f0 = 5 MHz, covered on both sides with Pt film (Maxtek, CA), was used as the working electrode (Pt-QCM). The geometric area of the Pt-QCM electrode was 1.37 cm2. The real area of the electrode was estimated to be 4.70 cm2 from the desorption charge of UPD H and the charge corresponding to the desorption of a monolayer of Hads from polycrystalline platinum (0.210 mC cm-2) [21]. A saturated calomel electrode (SCE) and a graphite rod were used as the reference and counter electrodes, respectively. All reported potentials are referred to SCE. In order to minimize iR-drop effects, the reference-electrode and working-electrode compartments were connected with a Luggin capillary. The QCM signal was recorded as ∆f (= f-finitial) as a function of the electrode potential. The experimental frequency change can be expressed as [22,23]: ∆f = −C f ∆m + ∆f η + ∆f r + ...
(Eq. 1)
Where the first term on the right-hand side of Eq. (1) is the Sauerbrey term [24], which represents the total mass change at the electrode surface. Other possible contributions to the frequency change include changes in the solution viscosity ( ∆fη ) [25] and the surface roughness ( ∆f r ) [26]. Experimental studies have shown that surface roughness can drastically affect the resonance frequency. This effect was attributed to rougher surfaces having a higher quantity of solvent molecules trapped in surface cavities [27-30]. In the present work, the use of polished Pt-QCM electrodes (roughness 1.2 nm, as measured by AFM) should minimize the effects of surface roughness, and the effects of viscosity variations are expected to be negligible. Prior to the measurements, the sensitivity factor (Cf = 0.030 Hz ng-1) of the quartz crystal was determined using the chronoamperometry calibration method described by Vatankhah et al. [31].
921
Int. J. Electrochem. Sci., Vol. 3, 2008
3. RESULTS AND DISCUSSION 3.1. Study of the adsorption of PEG20000 on Pt-QCM 3.1.1. Adsorption of PEG20000 on the Pt-QCM electrode at the open circuit potential (EOCP )
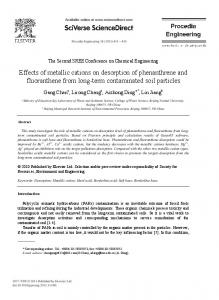
Prior to each experiment, the Pt-QCM electrode was activated by cycling the potential between the onset potentials of hydrogen and oxygen evolution. Typical stationary cyclic voltammograms for the solution S0 (= 0.1 M HClO4) [21,32,33] were taken as indicating an active clean Pt-QCM surface. The value of the open circuit potential (EOCP) for the Pt-QCM electrode in solution S0 was 0.740 V. The study of the adsorption of PEG20000 on Pt-QCM at EOCP was carried out in solutions S0 (= 0.1 M HClO4) and S0 with 5 µM PEG20000. PEG20000 was added according to the following procedure: After the frequency of the microbalance had remained stable ( ∆f = 0 ) for 2 min in the electrolytic solution S0 (with constant agitation), the PEG20000 was injected into S0 to a final concentration of 5 µM. The change in the resonant frequency of the quartz crystal was recorded for 4 min following the addition of the polymer, to monitor the adsorption of the additive (the agitation was continued through this 4-min period). Fig. 1 shows the mass changes, which were calculated using Eq. 1. Immediately after adding the PEG20000, the mass on the electrode surface increases rapidly and reaches a stationary PEG20000 , E OCP state. After 4 min, the amount of PEG20000 adsorbed at the open circuit potential ( ∆mads ) was 210.7 ng cm-2. In a previous study using EQCM and EC-STM, Kim et al. [11] showed that after the initial rapid rise in the mass of polymer adsorbed on the quartz crystal surface, the adsorbed polymer layer enters a stabilization phase in which the adsorbed PEG molecules rearrange into more ordered structures. 250 -2
210.7 ng cm
∆ m / ng cm -2
200
150
100
50
injection
0 0
50
100
150
200 t/s
250
300
350
400
Figure 1. Mass change (∆m) as a function of time after adding PEG20000 to solution S0 (= 0.1 M HClO4), to a final concentration of 5 µM PEG20000. The experiments were carried out at the open circuit potential (EOCP = 0.740 V).
922
Int. J. Electrochem. Sci., Vol. 3, 2008
In our experiments, after the adsorption of PEG20000 on the surface of the Pt-QCM electrode for 4 min, the value of EOCP (= 0.740 V) had shifted to a smaller value, E´OCP = 0.670 V, indicating modification of the electrode surface. In other work in this area, Safonova et al. [8] proposed that the shift in EOCP toward lower values (E’OCP) is associated with the adsorption of PEG, probably by electro-oxidation via a dehydrogenation mechanism. Additionally, such dehydrogenation processes may be accompanied by the scission of PEG molecules. For PEG as an additive, the question of the most relevant chain length is still open, as the PEG molecules are degraded in the acidic electrolyte. It appears that an average chain length of around 13 prevails in a bath under normal operating conditions.
3.2. Cyclic voltammetry study
Immediately after the 4-min period in which the PEG20000 adsorbed onto the Pt-QCM electrode, we performed simultaneous CV and QCM studies. The potential scan was started in the negative direction from E´OCP, over the potential range -0.25 to 1.15 V. Fig. 2 shows typical voltammograms obtained under these conditions. Curve a shows the typical voltammogram for Pt in solution S0. The electric charge density for the desorption of hydrogen, obtained by integrating the anodic current density in region A (-0.24 to 0.10 V, UPD H) of curve a, was 0.19 mC cm-2, after correcting for the double layer charge. Similarly, an electric charge density of 0.56 mC cm-2 was obtained by integrating the anodic current density in regions B and C (0.10 to 1.15 V); this charge density is associated with the double layer charge and oxidation of the electrode surface to form PtO. The addition of PEG20000 to the base solution S0 caused significant changes in the voltammogram profile (curve b, Fig. 2). The intensity of peak Ic, associated with the reduction of the PtO film on the surface, is approximately the same for solutions with and without the polyethoxylated compound, indicating that the adsorption of PEG20000 on the electrode surface does not interfere with the formation of the oxide film. At less positive potentials, in the range of 0.30 to 0.10 V (the double layer region), an oxidation process (P*) is observed during the potential scan in the negative direction, which may correspond to the electrooxidation of adsorbed PEG20000 residues on the surface of the PtQCM electrode. In region A (-0.25 to 0.10 V), the presence of PEG20000 causes a decrease in the current density (cathodic and anodic) associated with the adsorption and desorption of hydrogen. Specifically, in the cathodic part, the current density associated with the adsorption of strongly bound hydrogen (peak H 1c ) decreases considerably, indicative of the displacement of Hads by adsorbed PEG20000. In addition, the current density associated with the adsorption of weakly bound hydrogen (peak H 2c ) increases, indicative of the reduction of adsorbed PEG20000. Under the conditions studied, the current density associated with the adsorption-desorption processes of UPD H was not completely suppressed, indicating that the additive adsorbed on the surface of the Pt-QCM electrode blocked only a fraction of the active sites for the adsorption of hydrogen. The suppression of hydrogen desorption (region A) by adsorbed PEG20000, after the potential scan in the negative direction, can be employed as a measure to estimate the degree of coating of the PEG surface by adsorbed PEG20000 molecules ( Θ ads ) using the following equation: 20000
923
Int. J. Electrochem. Sci., Vol. 3, 2008 PEG20000 PEG20000 Θ ads = (Qdes,H − Qdes ) × (Q des,H ) −1 ,H
PEG where Qdes, H (= 0.19 mC cm-2) and Qdes, H
20000
(Eq. 2)
(= 0.14 mC cm-2) are the electric charge densities
associated with the desorption of hydrogen in the absence and presence of PEG20000 respectively. The charge densities were obtained by integrating the voltammetric current density (Fig. 2) in the corresponding potential range. PEG 20000 Thus, the difference between Q des, H and Q des, is proportional to the number of active sites H
for the desorption of hydrogen that are blocked by PEG20000 residues that remain adsorbed after the PEG potential scan in the negative direction starting from E´OCP. The value of Θ ads obtained was 0.26, 20000
which is less than the value of 0.60 reported by Safonova et al. [8]. This difference may be due to the greater porosity of a Pt/Pt electrode in comparison to a smooth platinum electrode.
C
B
A
0.10
P1 H 2a
0.05
H 1a
P*
i / mA cm -2
0.00
H 1c
-0.05
a b
H2c -0.10 -0.15
Ic -0.20 -0.4
-0.2
0.0
0.2
0.4
0.6
0.8
1.0
1.2
E / V vs. SCE Figure 2. Cyclic voltammograms of a Pt-QCM electrode in solutions (a) S0 (= 0.1 M HClO4) and (b) S0 + 5 µM PEG20000. v = 0.05 V s-1.
During the potential scan in the positive direction, the voltammogram profile (curve b, Fig. 2) showed an increase in the anodic current density beginning at 0.10 V and a well-defined peak (P1) at around 0.50 V; this process is associated with the oxidation of the product of the reduction of adsorbed PEG20000 molecules, produced during the potential scan in the negative direction in the potential range
924
Int. J. Electrochem. Sci., Vol. 3, 2008
-0.25 to -0.17 V. The net charge density of oxidation in the potential range 0.10 to 0.60 V ( Q Ox
(0.1,0.6 V)
)
(after the maximum of peak P1) can be calculated from the difference in the anodic charge density, -2 measured from the voltammograms obtained in the presence ( Q anodic = 0.265 mC cm ) and absence (0.1,0.6 V) of PEG20000 (0.079 mC cm-2). The estimated value of Q
Ox (0.1,0.6 V)
for PEG20000 in the base solution (S0)
was 0.185 mC cm-2, which corresponds to 45% of the total anodic charge density. At potentials greater than 0.60 V,SCE, a broad current density superimposed on the Pt oxide potential region is observed. 3.2.1. QCM Study
The QCM experiments were carried out simultaneously with the voltammetry measurements, immediately after the adsorption of the polyethoxylated compound on the Pt-QCM surface. The QCM data are presented as plots of d∆m dt-1 vs. E, known as massograms [34-36], where d∆m dt-1 is the rate of change of the mass (mass flux) at the electrode surface. For changes in mass associated with charge transfer at the electrode surface (faradaic processes), d∆m dt-1 is directly proportional to the current density and hence the massogram is analogous to the voltammogram. In addition, given that observation of a mass flux in the massogram without a corresponding current density in the voltammogram is evidence of a nonfaradaic mass change (i.e. a mass change without an associated charge transfer) on the electrode surface, it is possible to distinguish between faradaic and nonfaradaic processes by comparing a massogram with its corresponding voltammogram. In the massograms, negative mass flux (-d∆m dt-1) corresponds to the loss of mass (desorption) at the electrode surface, while positive mass flux (d∆m dt-1) corresponds to mass gain (adsorption) at the electrode surface. Fig. 3 shows the massograms corresponding to the voltammograms in Fig. 2. During the potential scan in the negative direction, three desorption processes are observed in different potential regions. At the beginning of the potential scan in the negative direction starting from E´OCP, a peak of negative mass flux (peak I’c, Fig. 3), associated with the loss of mass due to the reduction of the PtO film, is observed. It is important to emphasize that the intensity of this peak increases when PEG20000 is present in the solution (curve b); this behavior differs from that observed for cathodic peak Ic in the corresponding voltammograms (Fig. 2), which exhibited similar intensity for the solutions PEG 20000 with and without PEG20000. The mass lost due solely to the desorption of PEG20000, ∆m des, (=15.7 Ic
ng cm-2), was determined from the difference between the mass loss in peak I’c in the absence of PEG20000 and that in the presence of the polymer additive. The second desorption process, peak I’c1, is observed at potentials less positive than the potential of peak I’c. It is important to note that the potential range in which peak I’c1 is observed in the massogram (0.04 to 0.30 V, curve b, Fig. 3) corresponds to the potential range in which the oxidation process P* is observed in the voltammogram (curve b, Fig. 2) during the potential scan in the negative direction. On the basis of these results, it is possible to propose that peak I’c1 corresponds to the loss of mass due to the oxidation of adsorbed PEG20000. The amount of mass lost in this potential range, associated with the oxidation and desorption of PEG20000 adsorbed on the electrode surface, PEG 20000 -2 ∆mdes (0.04,0.33 V) (= 33.77 ng cm ), was calculated from the following equation:
925
Int. J. Electrochem. Sci., Vol. 3, 2008
PEG20000 H 2O PEG 20000 total ∆mdes (0.04,0.33 V) = ∆mdes ( 0.04 , 0.33 V) − ∆mdes (0.04,0.33 V) (1 - Θ ads (0.04,0.33 V) )
total where ∆mdes (0.04,0.33
V)
(Eq. 3)
(= 38.4 ng cm-2) is the amount of mass desorbed in the interval 0.04 to 0.33 V,
which was determined from the massogram in Fig. 3 (curve b), using the following equation: E =0.33 V
∫ (d∆m dt )
total ∆m des(0.04,0 = .33 V)
−1 With PEG 20000
v −1dΕ (Eq. 4)
E = 0.04 V
with v = 0.05 V s-1 -2 H 2O ∆mdes (0.04,0.33 V) (= 7.77 ng cm ) is the mass of water desorbed in the absence of PEG20000 in the H 2O interval 0.04 to 0.33V during the potential scan in the negative direction. ∆mdes (0.04,0.33 V) was
determined from the changes in mass as a function of potential, i.e., ∆m vs. E (data not shown). PEG The degree of coating of the surface ( Θ ads (0.04,0.33 V) = 0.40 ) before the desorption of adsorbed 20000
PEG20000 in the potential range 0.04 to 0.33 V (Peak I’C1) was calculated using the following equation:
20000 Θ PEG ads (0.04,0.33 V)
E OCP PEG 20000 ∆m − ∆m ads des, I' c × Θ PEG 20000 = ads E = 0.33V E = −0.17V PEG 20000 , E OCP PEG 20000 H 2 O/PEG 20000 −1 withPEG 20000 −1 −1 withPEG 20000 −1 ∆m ads − ∆m des , I´c − ∫ (d∆m dt ) v dE + ∫ (d∆m dt ) v dE − ∆m des E = 0.04V E = −0.25V
(Eq. 5)
Where: PEG20000 , E OCP ( ∆mads ) = 210.7 ng cm-2
PEG 20000 ∆m des, =15.7 ng cm-2 Ic E = -0.17 V total ∆m des( −0.25, −0.17V) =
∫ (d∆m dt )
−1 With PEG 20000
v −1dΕ = 41.9 ng cm -2
E = -0.25 V
∆m
H 2O / PEG20000 des
H 2O PEG (= ∆mdes (1 − Θ ads ) = 12.6 ng cm -2 ) is the amount of water desorbed during the
H 2O potential scan in the negative direction in the presence of PEG20000. ∆mdes (= 17.0 ng cm-2) is the mass
of water desorbed in the absence of PEG20000 in the interval 0.33 to -0.25 V, obtained from a plot of PEG ∆m vs. E (data not shown), and Θ ads (= 0.26) is the fraction of the surface blocked by PEG20000 molecules adsorbed after the potential scan in the negative direction. The third desorption process (peak I’C2) occurs in the potential region -0.25 to -0.17 V, and corresponds to the replacement of water molecules with Hads. It is important to point out that in the voltammogram in Fig. 2 (curve b), an increase in the cathodic current density is observed in the same potential range, suggesting that the loss of mass detected by QCM may contain a contribution from the product of the reduction of adsorbed PEG20000 residues. The amount of mass desorbed, associated with the reduction of PEG20000, in this potential range PEG 20000 -2 total ( ∆mdes (-0.25, -0.17 V) = 37.6 ng cm -2 ) was calculated using Eq. 3, with ∆mdes (-0.25,-0.17 V) (= 41.9 ng cm ),
926
Int. J. Electrochem. Sci., Vol. 3, 2008
H 2O -2 evaluated from Fig. 3 (curve b) and using Eq. 4. The values of ∆mdes (-0.25,-0.17 V) (= 6.57 ng cm ) and
d∆ ∆ m dt-1 / ng cm-2 s-1
PEG 20000 Θ ads (-0.25,-0.17
V)
= 0.34 were obtained as described above.
20 15 10 5 0 -5 -10 -15 -20 -25 -30 -35 -40 -45 -50
P’1 H2a
H1a
H2c H c 1
a b
I’c1 I’c
I’c2 -0.4
-0.2
0.0
0.2
0.4
0.6
0.8
1.0
1.2
E / V vs. SCE Figure 3. Massograms obtained at the same time as the cyclic voltammograms in Fig. 2, for solutions of composition (a) S0 (= 0.1 M HClO4), (b) S0 + 5 µM PEG20000. v = 0.05 V s-1.
Thus, the total mass lost due to the desorption of PEG20000 from the electrode surface during the PEG20000 PEG 20000 PEG 20000 PEG cathodic potential scan in the negative direction, ∆mdes (= ∆mdes + ∆mdes , Ic (0.04,0.33 V) + ∆mdes (-0.25, -0.17 V) ), ( −0.25,0.65V) 20000,
was 87.0 ng cm-2. In addition, the difference between the mass adsorbed at the open circuit potential PEG20000 , EOCP PEG cathodic ( ∆mads = 210.7 ng cm-2) and ∆mdes suggests that some adsorbed PEG20000 residues ( −0.25,0.65V) 20000,
PEG20000 ( ∆mads = 123.7 ng cm-2) remain adsorbed on the Pt-QCM surface after the potential scan in the PEG negative direction. These remaining adsorbed species block a fraction ( Θ ads = 0.26) of the active 20000
sites on the electrode surface, rendering it partially inactive. In the anodic part of the massograms, the beginning of peak P’1 of positive mass flux (i.e. mass gain) is observed at 0.1 V. The maximum of this peak appears at EP´1= 0.50 V, a value similar to the peak potential of the oxidation process observed in the voltammogram (Peak P1, curve b, Fig. 2). The amount of mass adsorbed ( ∆m anodic PEG 20000 = 35.7 ng cm -2 ) during the potential scan in the positive ads (0.1,0.6 V)
direction in the potential range 0.10 to 0.60 V, associated with the oxidation of the product of the reduction of adsorbed PEG20000, was calculated using the following equation:
927
Int. J. Electrochem. Sci., Vol. 3, 2008
[
PEG20000 PEG20000 H2O total PtO ∆manodic, = ∆mads ) + ∆mads(0.4,0. ads (0.1,0.6 V) (0.1,0.6V) − ∆m ads (0.1,0.4V) (1- Θ ads 6)
]
where total (= 70.1 ng cm-2) is the total mass adsorbed in the potential interval 0.1 to 0.6 V, ∆mads ( 0.1, 0.6 V )
H 2O -2 obtained from Fig. 3 (line b), using Eq. 4. ∆mads (-0.25,0.4 V) (= 38.5 ng cm ) is the mass of water PEG adsorbed in the interval -0.25 to 0.4 V in the absence of PEG20000 (data not shown). Θ ads
20000
= 0.26 is
the fraction of surface active sites for hydrogen adsorption blocked by PEG20000 molecules adsorbed -2 PtO after the potential scan in the negative direction. ∆mads ( 0.4, 0.6V ) (= 5.9 ng cm ) corresponds to the mass gain associated with the formation of the PtO film in this potential interval. The value of ∆m anodic PEG 20000 obtained corresponds to 43% of the total mass adsorbed during the positive potential ads (0.1,0.6 V) scan.
3.2.2. Experiments varying the switching potential (Eλ) To identify the mechanism of adsorption, as well as the nature of peak P1 in the voltammogram (Fig. 2) and peak P’1 in the massogram (Fig. 3), CV with potential switching was employed. In this technique, the potential scans were initiated in the negative direction from E’OCP and were switched to the positive direction at different values of the switching potential, Eλ. The values of Eλ were chosen to coincide with potential regions where desorption processes occurred in the massograms. Figs. 4 and 5 show the massograms and voltammograms, respectively, obtained for different values of Eλ. Analysis of the plots in Figs. 4 and 5 discloses the following characteristics: During the potential scan in the negative direction starting from E’OCP, the intensity of peak I’C in the massograms (Fig. 4) is higher when PEG20000 is present in the solution. This behavior differs from that observed in the corresponding voltammograms (Fig. 5), in which the intensity of peak Ic is similar for the solutions with and without PEG20000. These findings suggest that the increase in mass loss in this potential PEG20000 region, ∆mdes (=15.7 g mol-1), is due to a nonfaradaic process corresponding to the desorption of , Ic species adsorbed on the PtO film. When the PtO film is reduced, adsorbed species are desorbed from the film. To analyze the desorption process that occurs in the potential range 0.09 to 0.30 V (peak I’c1, Fig. 4) during the potential scan in the negative direction, the ratio ( PM C1 × n −1 ) cathodic is evaluated for Eλ each value of Eλ (Eλ∈(0.09, 0.20 V)). ( PM C1 × n −1 ) cathodic can be determined based on the changes in Eλ PEG 20000 anodic, P* mass ( ∆mdes, E λ (0.09,0.2 V) ) and charge density ( ∆Q E λ (0.09,0.2 V) ), using the following equation:
[
PEG
]
anodic, P* −1 (PM C1 × n −1 ) cathodic = ∆m des.E20000 F Eλ (0.09,0.2V) × ( ∆Q E λ (0.09,0.2V) ) λ
PEG 20000 The values of the mass change ( ∆mdes, E λ (0.09,0.2 V) ) were calculated using Eqs. 3-5.
(Eq. 6)
928
Int. J. Electrochem. Sci., Vol. 3, 2008 15
d∆ ∆ m dt-1 / ng cm-2 s-1
10
H1
5
a
H1
a
H1
c
P'1
0 -5 -10
H2
c
sol. S 0 E λ = -0.250 V E λ = 0.085 V E λ = 0.150 V E λ = 0.200 V
I'c1
-15 -20
I'c -25 -30
I’c2
-35 -0.2
0.0
0.2
0.4
0.6
0.8
1.0
E / V vs. SCE Figure 4. A series of massograms obtained at the same time as the cyclic voltammograms in Fig. 5, for different switching potentials, Eλ.
0.10
H2
a
P1
i / mA cm -2
0.05
H1
a
p*
0.00
H1
-0.05
-0.10
H2
c
sol. S 0 E λ = -0.250 V E λ = 0.085 V E λ = 0.150 V E λ = 0.200 V
c
-0.15
Ic -0.20 -0.4
-0.2
0.0
0.2
0.4
0.6
0.8
1.0
1.2
E / V vs. SCE Figure 5. Cyclic voltammograms of a Pt-QCM electrode in solution S0 + 5 µM PEG20000, obtained using different values of the switching potential, Eλ. v = 0.05 V s-1.
929
Int. J. Electrochem. Sci., Vol. 3, 2008
( ∆Q
The charge density associated with the oxidation (desorption) of adsorbed PEG20000 molecules ) was obtained by integrating the voltammetric current density during the potential scan
anodic, P* E λ (0.09,0.2 V)
in the negative direction (Fig. 2), in the corresponding potential range. Table 1. Mass changes ( ∆m ) and charge density ( ∆Q ) in different potential ranges (Eλ(0.085,0.2 V,SCE), 0.30 V,SCE) obtained from the voltammograms (Fig. 2) and massograms (Fig. 3), during the potential scan in the negative direction. The values of the ratio ( PM C1 × n −1 ) cathodic for different values of Eλ are Eλ also listed. Total ∆mdes, E
Eλ
λ∈(0.09,0.2 V)
H 2O/PEG 20000 ∆mdes, E
λ∈(0.09,0.2 V)
PEG20000 ∆mdes, E
λ∈(0.09,0.2 V)
QEanodic, P
*
λ(0.09,0.2 V)
( PM C1 × n −1 ) cathodic Eλ
V vs. SCE
(ng cm )
0.200
-19.1
-2.3
-21.0
0.03
67.53
0.150
-31.7
-2.7
-29.0
0.04
69.95
0.085
-37.6
-3.9
-33.8
0.05
65.22
-2
-2
(ng cm )
(ng cm-2)
(mC cm-2)
(g mol-1 )
has an average value of The results obtained (Table 1) show that the ratio (PM C1 × n −1 ) cathodic Eλ 67.56 g mol-1. This finding suggests the simultaneous oxidation and desorption of fractions of PEG20000 adsorbed (PMCI = 135 g mol-1, n = 2), leading to the formation of the corresponding aldehyde by transfer of 2 electrons. Considering the model of PEG1000 adsorption on Fe (110) proposed by Kim et al. [11], in which the PEG molecules are adsorbed in a planar configuration via the oxygen atoms, the PMCI calculated in the present work (= 135 g mol-1) corresponds to the molecular weight of the number of oxygen atoms (approximately 8) that are desorbed from the Pt-QCM electrode surface, in accordance with the following reaction:
[HO - (CH 2 − CH2 − O −)n CH 2 − CH 2OH]ads
−2e−
→ HO - (CH 2 − CH 2 − O −)n − CH 2 − CHO + 2H + ,
n≈6
The species [HO - (CH 2 − CH 2 − O − )n CH 2 − CH 2 OH]ads is quite possibly present on the electrode surface, given that the adsorption of PEG20000 on the Pt surface at EOCP occurs via a dehydrogenation process that is typically accompanied by the scission of PEG molecules [8,37]. For the reduction process and mass loss that occurs in the potential range -0.25 to -0.17 V -1 (Peak Ic2), the ratio (PM C2 × n −1 ) cathodic was evaluated with Eq. 6 using the values of Eλ ( −0.25, −0.17 V) ( = 81.9 g mol ) PEG 20000 red.PEG 20000 red.PEG 20000 -2 -2 ∆m des (-0.25, -0.17 V) (= 37.6 ng cm ) and ∆Q ( −0.25,−0.17 V) (= 0.05 mC cm ). The value of ∆Q ( −0.25, −0.17 V) was
obtained from the following equation:
930
Int. J. Electrochem. Sci., Vol. 3, 2008 des, H 2 O/PEG 20000 total 20000 ∆Q (red.PEG −0.25, −0.17 V) = Q ( −0.25, −0.17 V) − Q ( −0.25, −0.17 V)
-2 where Q (total −0.25, −0.17 V) (= 0.13 mC cm ) corresponds to the total charge density obtained in the potential H 2O/PEG 20000 -2 interval -0.25 to -0.17 V. Q des, ( −0.25, −0.17 V) (= 0.08 mC cm ) corresponds to the charge density associated
with the desorption of H2O molecules in the presence of PEG20000 in the same potential range and was calculated using Eq. 7, considering that only a fraction (0.28) of a H2O molecule is adsorbed on a hydrogen site [38]: 1 ∆m ( −0.25,2 −0.17V)20000 nF 0.28 PM H 2O des,H O/PEG
H 2O/PEG 20000 Q (des, = −0.25, −0.17 V)
(Eq. 7)
H 2O PEG -2 2 O/PEG 20000 where ∆m des.H (= ∆m des (1 − Θ ads ( −0.25,−0.17 V) ( −0.25− 0.04 V) ) = 4.33 ng cm ) is the mass of water desorbed H 2O during the potential scan in the negative direction in the presence of PEG20000. ∆mdes (= 6.57 ng cm-2)
is the mass of water desorbed in the absence of PEG20000 in the interval 0.33 to -0.25 V, obtained from PEG 20000 a plot of ∆m vs. E. Θ ads ( −0.25, −0.04 V) (= 0.34) is the fraction of the surface blocked by PEG20000 molecules adsorbed before the potential scan in the negative direction in the potential interval -0.25 to -0.17 V. -1 The value of the ratio (PM C2 × n −1 ) cathodic is consistent with a mechanism Eλ ( −0.25, −0.17 V) ( = 81.9 g mol ) involving the simultaneous desorption and reduction of adsorbed PEG20000 residues, in a process including hydrogenolysis on the OH groups. Considering that PEG adsorbs on the Pt-QCM in a planar configuration via the oxygen atoms, the molecular weight of the desorbed species −1 ( (PM C2 ) cathodic Eλ ( −0.25, −0.17 V) = 163.6 g mol , n = 2 ) corresponds to the molecular weight of the oxygen atoms (approximately 10) desorbed from the Pt-QCM electrode surface. -
+ 2e [ H − O − (CH 2 − CH 2 − O) 9 − H ] ads + 2PtH → H - O - (CH 2 − CH 2 − O) 8 − CH 2 − CH 3 + H 2 O + 2Pt
The formation of hydrocarbons via the reduction of alcohols has been proposed by Horanyi et al. [39]. Next we analyze the anodic part of the plots in Figs. 4 and 5. When the switching potential (Eλ) was in the potential range of 0.09 to 0.20 V in the voltammograms (Fig. 5), the anodic current density increased during the potential scan in the positive direction and its intensity was independent of Eλ. In addition, the corresponding massograms (Fig. 4) exhibit a constant positive mass flux. Inspection of the voltammograms and massograms additionally reveals that the peaks P1 (Fig. 5) and P´1 (Fig. 4) are observed only when Eλ = -0.25 V. From these results, it is evident that the anodic current density (Peak P1, Fig. 5) and the positive mass fluxes (peak P’1, Fig. 4) that manifest during the potential scan in the positive direction in the potential range 0.09 to 0.60 V, when Eλ = -0.25 V, correspond to a complex process that involves the oxidation of various species. To determine the mechanism of the oxidation process that occurs during the potential scan in the positive direction in the potential range 0.09 to 0.60 V, we evaluate the ratio (PM × n −1 ) for each - PEG value of Eλ, using the anodic charge densities ( ∆Q ox ) and the corresponding positive mass ads, E 20000
λ
931
Int. J. Electrochem. Sci., Vol. 3, 2008
− PEG 20000 - PEG 20000 changes ( ∆m ox ). Table 2 summarizes the results of the variation of ∆Q ox and ads, E λ ads, E λ − PEG 20000 ∆m ox when Eλ was in the range of 0.085 to 0.20 V. ads, E λ − PEG 20000 From the mass gain ( ∆m ox ) and the charge density consumed during the potential scan ads, E λ - PEG 20000 in the positive direction ( ∆Q ox ), it is possible to calculate the apparent molecular mass of the ads, E λ
species that is adsorbed during the oxidation process, using Eq. 6. The value of the ratio is similar for the different values of Eλ, with a mean value of 17.5 g mol-1 (see (PM × n −1 ) anodic Eλ (0.09,0.2 V) Table 2). For an oxidation process that involves the transfer of two electrons (n = 2), PM Eanodic λ ( 0.09 , 0.2V ) is equal to 35 g mol-1, which is approximately equal to the molecular weight of two oxygen atoms. This result is consistent with a situation in which during the potential scan in the positive direction, in the potential interval 0.09 to 0.6 V, a carboxylic acid forms via oxidation of the aldehyde previously formed during the potential scan in the positive direction: HO - (CH 2 − CH 2 − O −)6 − CH 2 − CHO + H 2 O
-
2e -→
HO - (CH 2 − CH 2 − O −)6 − CH 2 − (COOH ) ads + 2H +
In this scheme, the two oxygen atoms of the carboxylic acid are adsorbed on the Pt-QCM electrode surface. Table 2. Mass changes ( ∆m ) and charge density ( ∆Q ) in different potential ranges (Eλ, 0.30 V) obtained from the massograms (Fig. 4) and voltammograms (Fig. 5), during the potential scan in the positive direction. The values of the ratio ( PM C1 × n −1 ) anodic Eλ∈( 0.085, 0.2 V ) for different values of Eλ are also listed
∆mTotal ads, E
Eλ
λ∈ (0.09, 0.2 V)
H 2O/PEG 20000 ∆m ads, E
λ∈ (0.09,0.2 V)
V vs. SCE
(ng cm-2)
0.200
22.96
2.05
0.150
24.62
0.085
30.35
-PEG20000 ∆mox ads,E
λ∈(0.09,0.2 V)
(0.09, 0.2 V)
λ(0.09,0.2 V)
(mC cm-2)
(g mol-1 )
12.45
0.068
17.5
2.98
13.18
0.073
17.3
3.91
17.98
0.097
17.8
(ng cm-2)
(ng cm-2)
ox -PEG 20000 ( PM × n −1 ) anodic Qads, Eλ E
total total -2 ∆Q anodic When Eλ = -0.25 V, the values of ∆m anodic and Eλ (0.1,0.6 V,SCE) and Eλ (0.1,0.6 V,SCE) were 34.08 ng cm
0.20 mC cm-2, respectively. From the above results, the apparent molecular mass of the adsorbed species (peak P’1, Fig. 4) that is the product of the oxidation process (peak P1, Fig. 3) can be calculated using Eq. 6, with ox - PEG 20000 P1 anodic ∆m oxidation (= 16.1 g mol −1 ) = ∆m Etotal E λ = −0.25 V λ (0.1,0.6 V) − ∆m ads, E λ
932
Int. J. Electrochem. Sci., Vol. 3, 2008 ox - PEG 20000 P1 anodic Q oxidation (= 0.10 mC cm −2 ) = Q Etotal E λ = −0.25 V λ (0.1,0.6 V) − Q ads, E λ
The value obtained for the ratio (PM oxidation
P1
-1 P1 × n −1 ) oxidation Eλ = − 0.25 V was 14.6 g mol . Supposing that 4
electrons are transferred during the oxidation process that gives rise to peak P1 (n = 4), we obtain
PM oxidation
P1
= 58.4 g mol-1, which corresponds to the molecular weight of the species that is adsorbed
(mass gain) during the oxidation process (peak P1) when Eλ = -0.25 V. This value of PM oxidation P1 is close to the molecular weight of four oxygen atoms. On the basis of these results (n=4, PM oxidation P1 = 58.4 g mol-1), we propose that each alcohol group formed during the reduction process gains an oxygen atom via the oxidation of the alcohol to give the corresponding carboxylic acid. The carboxylate moieties, as well as two oxygen atoms of the chain, are adsorbed to the surface. −
4e H - O - (CH 2 − CH 2 − O) 8 − CH 2 − CH 3 + H 2 O − → CH 3 − CH 2 − (O − CH 2 − CH 2 ) 6 − (O − CH 2 - CH 2 - O − CH 2 − COOH) ads
These results support the argument of Damaskin et al. [37], who proposed that oxidation of an alcohol occurs in the potential range where peak P1 appears. In another study of the oxidation of ethylene glycol in an acidic medium, Chbihi et al. [40] used SNIFTIRS to detect the presence of carbonyl groups (C=O) that they attributed to a carboxylic acid adsorbed on the Pt surface.
4. CONCLUSIONS In the present study, we examined the adsorption/desorption processes of PEG20000 on the surface of a Pt-QCM electrode by analyzing quantitative data obtained from simultaneous CV and QCM measurements. A study of the adsorption of PEG20000 on the surface of the Pt-QCM at the open circuit potential (EOCP) showed that the mass adsorbed reached a stationary value with time. The mass of the adsorbed PEG20000 at EOCP was 210.7 ng cm-2. In addition, the adsorption of PEG20000 did not interfere with the oxidation of the Pt surface to form a PtO film. The present study using a combination of CV and QCM disclosed three desorption processes during the potential scan in the negative direction, each in a distinct potential range. The first desorption occurred in the region of the reduction of the PtO film, and corresponds to the non-faradaic desorption of PEG20000 species adsorbed on the PtO film. When the PtO film is reduced, the PEG20000 species are desorbed from the film. The second desorption process was observed at less positive potentials, in the range 0.10 to 0.30 V. The average value of the ratio (PM C1 × n −1 ) cathodic (= 67.5 g mol-1) for this process suggested Eλ the simultaneous oxidation and desorption of fractions of PEG20000 adsorbed (PMCI = 135 g mol-1, n = 2), leading to the formation of the corresponding aldehyde by transfer of 2 electrons. From the model of the adsorption of PEG1000 molecules on Fe (110) proposed by Kim et al. [11], in which the PEG molecules are adsorbed in a planar configuration via the oxygen atoms, the value of PMCI calculated in the present work (= 135 g mol-1) corresponds to the molecular weight of the number of oxygen atoms
933
Int. J. Electrochem. Sci., Vol. 3, 2008
(approximately 8) that desorb from the Pt-QCM electrode surface, in accordance with the following reaction:
[HO - (CH 2 − CH 2 − O −)n CH 2 − CH 2 OH]ads
−
−2e → HO - (CH 2 − CH 2 − O − )n − CH 2 − CHO + 2H + ,
n≈6
At the lower potential limit, the third desorption process is observed. This process corresponds to the desorption of the product formed by the reduction (via a hydrogenation mechanism) of adsorbed PEG molecules. + 2e-
[ H − O − (CH 2 − CH 2 − O) 9 − H ] ads + 2PtH → H - O - (CH 2 − CH 2 − O) 8 − CH 2 − CH 3 + H 2 O + 2Pt
Finally, comparison of the electrochemical and QCM results indicates that the oxidation process observed at 0.50 V corresponds to the oxidation of alcohols formed during the reduction process. On the basis of the results (n=4, PM oxidation P1 = 58.4 g mol-1), we propose that each alcohol group formed during the reduction process gains an oxygen atom via the oxidation of the alcohol to give the corresponding carboxylic acid. The carboxylate moieties, as well as two oxygen atoms in the chain, are adsorbed to the surface. − 4e −
H - O - (CH 2 − CH 2 − O)8 − CH 2 − CH 3 + H 2O → CH3 − CH 2 − (O − CH 2 − CH 2 )6 − (O − CH 2 - CH 2 - O − CH 2 − COOH)ads
ACKNOWLEDGEMENTS The authors are grateful for financial assistance provided by CONACyT, projects 48440-Y and 48335Y. A. Méndez is grateful to CONACyT for scholarship support.
References 1. 2. 3. 4. 5. 6. 7.
L. Oniciua and L. Muresan, J. Appl. Electrochem. 21 (1991) 565 T.C. Franklin, Plat. Surf. Finish. 81 (April 1994) 62 A. Gomes and M.I. da Silva Pereira, Electrochim. Acta 51 (2006) 1342 J.J. Kelly, Ch. Tian and A.C. West, J. Electrochem. Soc. 146 (1999) 2540 F. Lallemand, L. Ricq, P. Bercot and J. Pagetti, Electrochim. Acta 47 (2002) 4149 G. Trejo, H. Ruiz, R. Ortega and Y. Meas, J. Appl. Electrochem. 31 (2001) 685 T.Ya, Safonova, D.R. Khairullin, G.A. Tsirlina, O.A. Petrii and S.Yu. Vassiliev, Electrochim. Acta 50 (2005) 4752 8. T.Ya. Safonova, N.V. Smirnova and O.A. Petrii, Russ. J. Electrochem. 42 (2006) 995 9. M. Petri, D. M. Kolb, U. Memmert and H. Meyer, J. Electrochem. Soc. 151 (2004) C793 10. M.L. Walker, L.J. Richter, D. Josell and T.D. Moffat, J. Electrochem. Soc. 153 (2006) C235 11. J.W. Kim, J. Y. Lee and S. M. Park, Langmuir 20 (2004) 459 12. J. Healy, D. Pletcher and M. Goodenough, J. Electroanal. Chem. 338 (1992) 155 13. J. Healy, D. Pletcher and M. Goodenough, J. Electroanal. Chem. 338 (1992) 167 14. D. Stoychev, I. Vitanova, S. Rashkov and T. Vitanov, Surf. Technol. 7 (1978) 427 15. G. Hope, G. Brown, D. Schweinsberg, K. Shimizu and K. Kobayashi, J. Appl. Electrochem. 25 (1995) 890
Int. J. Electrochem. Sci., Vol. 3, 2008
934
16. J.J. Kelly and A. West, J. Electrochem. Soc. 145 (1998) 3472 17. J.J. Kelly and A. West, J. Electrochem. Soc. 145 (1998) 3477 18. L. Bonou, M. Ayraud, R. Denoyel and Y. Massiani, Electrochim. Acta 47 (2002) 4139 19. T. Akiyama, S. Kobayashi, J. Ki, T. Ohgai and H. Fukushima, J. Appl. Electrochem. 30 (2000) 817 20. J.D. Reid, and A.P. David, Plat. Surf. Finish. 74 (January 1987) 66 21. R. Woods, in: A.J. Bard (Ed), Electroanalytical Chemistry, vol. 9, Marcel Dekker, New York, 1977, p.1 22. S. Langerock and L. Heerman, J. Electrochem. Soc. 151 (2004) C155 23. V. Tsionsky, L. Daikhin and E. Gileadi, J. Electrochem. Soc. 143 (1996) 2240 24. G. Sauerbrey, Z. Phys. 155 (1959) 206 25. K.K. Kanazawa and J.G. Gordon, Anal. Chim. Acta 175 (1985) 99 26. M. Urbakh and L. Daikhin, Langmuir 10 (1994) 2836 27. L. Daikhin and M. Urbakh, Faraday Discuss. 107 (1997) 27 28. M. Yang, M. Thompson and W.C. Duncan-Hewih, Langmuir 9 (1993) 80 29. R. Schumacher, J.G. Gordon and O. Melroy, J. Electroanal. Chem. 216 (1987) 127 30. R. Schumacher, G. Borges and K.K. Kanasawa, Surf. Sci. 163 (1985) L621 31. G. Vatankhah, J. Lessard, G. Jerkiewicz, A. Zolfaghari and B.E. Conway, Electrochim. Acta 48 (2003) 1619 32. M.C. Santos, D.W. Miwa and S.A.S. Machado, Electrochem. Commun. 2 (2002) 692 33. A. Zolfaghari, B.E. Conway and G. Jerkiewicz, Electrochim. Acta 47 (2002) 1173 34. G.A. Snook, A.M. Bond and S. Fletcher, J. Electroanal. Chem. 526 (2002) 1 35. E. Bahena, P.F. Méndez, Y. Meas, R. Ortega, L. Salgado and G. Trejo, Electrochim. Acta 49 (2004) 989 36. G. Trejo, in: M. Nuñez (Ed.) Electrochemistry New Research, Nova Science Publishers Inc, New York, 2005, Ch. 2 37. B.B. Damaskin, O.A. Petrii and V.V. Batrakov, Adsorption of Organic Compounds on electrodes, Plenum Press N.Y. 1971 38. F. Gloaguen, J.M. Léger and C. Lamy, J. Electroanal. Chem. 467 (1999) 186 39. G. Horanyi, G. Inzelt, K. Torkos, K. Kozponti, I. Kutato and A. Magyar, Kemial Kozlemenyek 54 (1980) 163-176 40. M.E.M. Chbihi, D. Takky, F. Hahn, H. Huser, J.M. Léger and C. Lamy, J. Electroanal. Chem. 463 (1999) 63
© 2008 by ESG (www.electrochemsci.org)