Feb 15, 2010 - Spread Spectrum Communication Signals using the. Kurtosis Algorithm. Sidharth Misra, Christopher Ruf and Rachael Kroodsma. Department ...
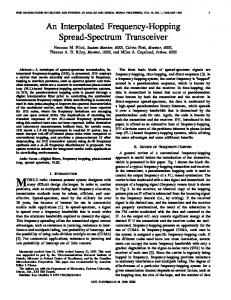
Detectability of Radio Frequency Interference due to Spread Spectrum Communication Signals using the Kurtosis Algorithm Sidharth Misra, Christopher Ruf and Rachael Kroodsma Department of Atmospheric, Oceanic and Space Sciences University of Michigan 2455 Hayward St., Ann Arbor, MI, 48109-2143 USA
Abstract— Analysis of detectability of the kurtosis algorithm for pulsed-sinusoidal Radio Frequency Interference (RFI) has already been performed in detail. The detectability for wideband spread-spectrum RFI is investigated here. A commercial RF communications product XBee is used for generating the spread-spectrum signal which is fed to the Agile Digital Detector (ADD) through a bench-top radiometer. ADD measures the probability distribution function of the incoming signal. The performance of the detection algorithm for spread-spectrum RFI is characterized and compared to pulsed-sinusoidal RFI. The sensitivity of the kurtosis algorithm with respect to the spectral properties of the wide-band signal is also investigated. Index terms – Microwave radiometry, radio frequency interference
I. INTRODUCTION easurements made by space-borne microwave radiometers operating at L- and C-band can be corrupted by man-made Radio Frequency Interference (RFI) signals. These interfering signals introduce error into the geophysical science parameters estimated from the measurements. Numerous techniques have been developed in the analog and digital domain to detect and mitigate RFI from microwave radiometer measurements [1, 2]. A detection algorithm that measures the higher-order moments of the predetection voltage for flagging RFI corrupted samples has been successfully tested in various campaigns [3, 4]. The kurtosis statistic is effective in detecting the deviation of an incoming thermal signal from normality, and hence RFI is identified. The � performance of the detection algorithm has been characterized for RFI sources that have radar-like pulsed sinusoid properties [5]. The source of this RFI is primarily air-traffic control radars and early warning defense radars that operate near the L-Band region. As demonstrated in [5] the kurtosis algorithm has high sensitivity to pulsed-sinusoid RFI in most practical cases. This paper considers the performance of the detection algorithm for another major source of RFI, wide-band
M
� This work has been supported in part by the NASA Earth Science Technology Office under NNG05GL97G.
978-1-4244-2808-3/08/$25.00 ©2008 IEEE
communication signals. This type of RFI is expected to be dominant at urban centers. Specifically, spread-spectrum signals are becoming ubiquitous with the growing popularity of wireless technology. Low power RF devices with a long battery life using spread spectrum communications are becoming commonplace for applications such as Wireless Personal Area Network (WPAN) and identifying chips (RFID). Spread spectrum signals have noise-like spectral properties and would be difficult to detect using conventional threshold detection techniques. In order to generate the spread-spectrum signals a commercial RF communication module based on the IEEE 802.15.4 standard called XBee is used. To evaluate its effect on a typical radiometer operation the signal is demodulated and coupled into a bench-top radiometer before feeding it into the Agile Digital Detector (ADD) used for measuring the histogram of the incoming signal [3]. ADD divides the incoming signal into eight frequency sub-bands to improve RFI detectability. By varying the power level of the incoming RFI signal, it is found that the kurtosis algorithm is able to detect the presence of spread spectrum signals with a relatively high sensitivity. Analysis of the histogram of the spread spectrum signal suggests that, even though spread spectrum modems have noise-like power spectra, the probability distribution of their radiated amplitude is not the same as that of thermal noise. The kurtosis algorithm can reliably detect low-level spread spectrum RFI that is approximately three times the noise floor of the radiometer. This sensitivity threshold is less than that for low duty-cycle radar-like pulsed sinusoidal RFI signals. In Section II, we give a brief background on the kurtosis detection algorithm. The performance of the detection algorithm for pulsed sinusoidal RFI is summarized in Section III. Section IV describes the hardware setup used for the experiment and Section V presents the results obtained by injecting spread-spectrum RFI into a radiometer noise signal. II. KURTOSIS DETECTION ALGORITHM Thermal emission sources measured by a radiometer are inherently random in nature. These sources include natural
II - 335
IGARSS 2008
Authorized licensed use limited to: University of Michigan Library. Downloaded on February 15,2010 at 10:43:15 EST from IEEE Xplore. Restrictions apply.
emission from the observed scene as well as radiometric noise generated due to ohmic losses and active components of the hardware. If the incoming signal is thermally generated, the probability distribution of its amplitude will be normally distributed. Man-made sources such as RFI mostly have a non-Gaussian distribution. The kurtosis algorithm tests the normality of the measured signal. ADD measures the histogram of the incoming signal, from which the 2nd and 4th central moments are measured. The 2nd central moment is proportional to the radiometer system temperature Tsys. The nth central moment is given by (1) �x � x n mn where x(t) is the pre-detection voltage signal and represents the expectation of the measured signal. Taking the ratio of the 4th central moment to the square of the 2nd central moment gives the kurtosis, or m4 (2) N m22 The kurtosis equals three when the signal is purely Gaussian and no RFI is present. The kurtosis is independent of the natural variation in the observed brightness temperature. Ideally, the ratio deviates from three in the presence of a nonGaussian interfering signal. Such a sample is then flagged as being corrupted by RFI and discarded. The kurtosis parameter itself is influenced by digitization factors such as clipping, bit length, number of samples, correlation etc and there is a standard error associated with its measurement due to a finite integration time. III. PULSED-SINUSOIDAL RFI AND KURTOSIS The pulsed sinusoid is considered to be the typical type of RFI and kurtosis performance has been characterized with respect to such an interfering source [5, 6]. Kurtosis value with pulsed-sinusoidal RFI (0.01% duty-cycle) 20 18
Kurtosis value
16 14 12 10
Minimum Detectable RFI
8 6 4 2
Kurtosis Detection Threshold 0
2
4 6 RFI magnitude (NE' T units)
8
10
Fig 1: Plot indicating change in kurtosis as a function of the RFI magnitude for pulsed-sinusoid interference with a 0.01% duty cycle. The dashed line indicates the kurtosis 3V detection threshold
For pulsed sinusoids, the performance of the kurtosis algorithm depends on its duty cycle and amplitude. The
kurtosis is below three if the incoming RFI is a continuouswave (CW) signal and above three if the duty cycle is below 50%. The algorithm is extremely sensitive to RFI with a low duty cycle, and it has a blind-spot for sinusoids with a 50% duty cycle. Since radars typically operate at very low duty cycles, the kurtosis can detect low-level RFI near the NE'T level. Figure 1 indicates the minimum detectable RFI for a duty cycle of 0.01% and kurtosis threshold of three times the kurtosis standard deviation. As shown in Fig. 1, the kurtosis algorithm can detect RFI with power levels as low as the NE'T level. IV. XBEE AND ADD HARDWARE SETUP XBee is a commercial product developed for creating wireless networks with lower data rate, simple connectivity and battery operation in mind [7]. XBee operates using the IEEE 802.15.4 standard for wireless communication. We operate the XBee transceiver module in the 2.400-2.4835GHz range. The frequency scheme is shown in Fig. 2. The device has 16 channels that are approximately 5MHz wide. It operates using the Direct Sequence Spread Spectrum (DSSS) technology using Offset Quadrature Phase-Shift Keying (O-QPSK).
Fig 2: Frequency scheme of IEEE 802.15.4 communication standard [7]
The device is configured to operate at 2.410GHz. The signal from XBee is split, with half of it coupled into the demodulator and radiometer and the other half coupled to an antenna that transmits and receives data from another XBee transceiver in loop-back mode. The output from XBee is demodulated down to a frequency near 25.5MHz and fed into ADD. ADD then digitizes the incoming signal at 110 MSa/sec before sending it to a bank of eight sub-band poly-phase filters that operate from over15 to 39 MHz, with each sub-band 3MHz wide. The output of each sub-band is processed by totalizers that calculate the discrete pdf of the incoming signal every 36ms. The resulting XBee signal falls in sub-band 4, and it can be further swept between 15 to 39MHz by varying the LO frequency of the demodulator before ADD. V. SPREAD-SPECTRUM RFI AND KURTOSIS Spread-spectrum signals are generally below the noise threshold of a receiver and have noise-like qualities due to their low SNR. Analysis of the discrete pdf obtained from
II - 336 Authorized licensed use limited to: University of Michigan Library. Downloaded on February 15,2010 at 10:43:15 EST from IEEE Xplore. Restrictions apply.
ADD indicates a non-normal probability distribution of spread spectrum signals. Fig. 3 indicates the normalized histograms of clean 36ms period data and two 36ms period data corrupted with spread-spectrum RFI. The pdf of spread-spectrum RFI corrupted signals is generally wider at the base than clean data samples. Higher powered RFI have “bumps” at the outliers giving rise to a high kurtosis value. In this sense, the spreadspectrum RFI corrupted histogram is similar to those of pulsed-sinusoid RFI corrupted Gaussian noise.
Kurtosis value with spread-spectrum RFI 4.1 4 3.9
Kurtosis value
3.8
RFI free
3.5
Minimum Detectable RFI
3.4
3.2
RFI corrupted (pow er S1) RFI corrupted (pow er S2)
0.05 Normalized Histogram
3.6
3.3
0.06
Kurtosis Detection Threshold
3.1 0
0.04
10
20 30 40 RFI magnitude (NE' T units)
50
60
Fig 4: Plot indicating change in kurtosis as a function of the RFI magnitude for spread spectrum interference. The dashed line indicates the kurtosis 3V detection threshold
0.03 0.02 Bump
0
-60
x 10
-40
The above results are presented when the spread spectrum signal is centered in one of the sub-bands of ADD. Since the bandwidth of the signal is 5MHz and the sub-bands are 3MHz wide, a majority of the signal spectrum is within one subband. Fig. 5 indicates kurtosis values when the signal spectrum is swept across the frequency sub-bands by changing the LO of the demodulator. As a result, the spectrum is divided amongst adjacent sub-bands. Kurtosis values are higher when the spectrum is offset within a sub-band compared to when the spectrum is centered for the same RFI power values. Detectability thus improves when the power spectrum of the RFI becomes less uniform.
Wider Base
0.01
-20
0 Digitizer Bin
20
40
60
-3 RFI free
9
RFI corrupted (pow er S1) RFI corrupted (pow er S2)
8 Normalized Histogram
3.7
7 6 5 4
4.4
3
5 NE'T
2
4.2
1
15NE' T 25NE' T 35NE' T
4 -60
-50
-40
-30 Digitizer Bin
-20
-10
Kurtosis Value
0 -1
Detectability of Spread Spectrum Interference
0
Fig 3: (a) Normalized histogram of the signal received by ADD for a clean sample (solid line), RFI corrupted sample with power S1 (dashcross) and RFI corrupted sample with power S2(dashed) (S1 > S2) (b) Histogram tail (zoomed) showing “bump” of RFI corrupted sample
The kurtosis also seems to perform well for lower-level RFI signals near the NE'T value. Fig. 4 indicates the deviation of the kurtosis value with respect to RFI power in terms of NE'T units. The kurtosis has a monotonic dependence on the power of the spread spectrum signal. The dashed line in the figure indicates the kurtosis threshold similar to Fig. 1. The kurtosis algorithm manages to detect RFI as low as 5 to 6 times the NE'T level.
45NE' T
3.8 3.6 3.4 3.2 3 2.8 -1.5
-1
-0.5 0 0.5 Offset Frequency (MHz)
1
1.5
Fig 5: Kurtosis values when the spread spectrum signal is offset in frequency from the center of sub-band 4 of ADD. The straight line represents the kurtosis detection threshold
The solid line in Fig. 5 indicates the detection threshold of the kurtosis algorithm. The signal is swept from -1.5MHz to +1.5MHz with respect to the original local oscillator frequency. At 0 MHz, the signal is centered in sub-band 4, at +/-1.5MHz the spread-spectrum signal is evenly divided between sub-bands 4/5 and 3/4, respectively.
II - 337 Authorized licensed use limited to: University of Michigan Library. Downloaded on February 15,2010 at 10:43:15 EST from IEEE Xplore. Restrictions apply.
V. CONCLUSION AND DISCUSSION RFI mitigation performance of the kurtosis detection algorithm has been previously analyzed for pulsed-sinusoidal radar-like RFI. In this paper we present results from a laboratory experiment investigating the detectability of wideband spread-spectrum communication signals. In order to generate such RFI signals a commercial product XBee was used that implements a popular protocol suite for WPANs. The XBee signal was coupled into a bench-top radiometer that demodulates the signal down from 2.4GHz to nearly 25.5MHz before it is fed into ADD. ADD is responsible for spectrally dividing the incoming signal and measuring the discrete pdfs, which are then used to calculate the kurtosis. The discrete pdf obtained from ADD suggests that even though spread-spectrum signals have noise-like spectral properties, the probability distribution is non-Gaussian. This makes it possible to detect using the kurtosis algorithm. The algorithm can detect RFI at power levels near the NE'T level. The algorithm is somewhat less sensitive to spread-spectrum RFI compared to low duty-cycle radar-like RFI. Results indicate that the kurtosis was higher as the signal was swept across ADD sub-bands. This suggests that the kurtosis sensitivity increases as the wide-band or “spreading” properties of the signal decrease. ACKNOWLEDGMENT The authors would like to acknowledge S.M.Gross of the University of Michigan Space Physics Research Laboratory for his valuable assistance. REFERENCES [1] A. J. Gasiewski, M. Klein, A. Yevgrafov, and V. Leuskiy, "Interference mitigation in passive microwave radiometry," presented at Geoscience and Remote Sensing Symposium, 2002. [2] J. T. Johnson, G. A. Hampson, and S. W. Ellingson, "Design and demonstration of an interference suppressing microwave radiometer," presented at Geoscience and Remote Sensing Symposium, 2004. [3] C. S. Ruf, S. M. Gross, and S. Misra, "RFI detection and mitigation for microwave radiometry with an agile digital detector," Geoscience and Remote Sensing, IEEE Transactions on, vol. 44, pp. 694, 2006. [4] C. Ruf, S. Misra, S. Gross, and R. De Roo, "Detection of RFI by its Amplitude Probability Distribution," presented at Geoscience and Remote Sensing Symposium, 2006. [5] R. D. De Roo, S. Misra, and C. S. Ruf, "Sensitivity of the Kurtosis Statistic as a Detector of Pulsed Sinusoidal RFI," Geoscience and Remote Sensing, IEEE Transactions on, vol. 45, pp. 1938, 2007. [6] J. Piepmeier and F. Pellerano, "Mitigation of Terrestrial Radar Interference in L-Band Spaceborne Microwave Radiometers," presented at Geoscience and Remote Sensing Symposium, 2006. [7] "Demystifying 802.15.4 and Zigbee," MaxStream Inc. 2006.
II - 338 Authorized licensed use limited to: University of Michigan Library. Downloaded on February 15,2010 at 10:43:15 EST from IEEE Xplore. Restrictions apply.