Aug 25, 2008 - determined by multi-temporal and multi-spectral Landsat images from 1973 to. 2007? ...... 2007), Microsoft Office Excel, and Adobe Illustrator.
Detecting Changes in a Wetland: Using Multi-Spectral and Temporal Landsat in the Upper Noun Valley Drainage Basin-Cameroon
AN ABSTRACT OF THE THESIS OF Stephen Koghan Ndzeidze for the degree of Master of Science in Geography presented on August 25, 2008 Title: Detecting Changes in a Wetland: Using Multi-Spectral and Temporal Landsat in the Upper Noun Valley Drainage Basin-Cameroon Abstract approved: ________________________________________________________ Laurence Becker Since the early 1980s, satellite imagery has been commonly used to detect change in wetlands. The overall objective of this study is to utilize remote sensing and Geographic Information Systems (GIS) technology to determine the extent of change of the wetland area and of other land use and land cover classes in the Upper Noun drainage basin from 1973 to 2007. Specific objectives were 1) to map land cover and related land use practices within the wetland and surrounding areas of the drainage basin using the supervised maximum likelihood algorithm classification method; 2) to map land use and land cover classes by seasons in order to determine human-induced pressure on the wetland area and the drainage basin using available Landsat MSS, TM and ETM+ imagery; 3) to utilize GIS in confirming and finalizing the land use and land cover classes and delimitation of the Upper Noun drainage basin by incorporating auxiliary data such as settlements and hydrology. The Upper Noun drainage basin is an important wetland that lies within the western high plateau of Cameroon where it supports a wide range of wildlife. The study defines twelve different land cover and land use classes that are grouped into four major categories. The first category is the humid floodplain class that makes up the wetland area, including the floodplain lake (1973), the reservoir, the permanent and seasonally flooded prairies, and irrigated farmlands. The second category consists of the agropastoral classes which are made of upland grazing areas and mixed
farming areas. The third category is the montane and semi montane forest zone at elevations above 1,500 - 3,000 m. The fourth category is comprised of major settlements, and settlements with enclosures and openfields. This study is an example of an application of spatio-temporal data in assessing the close relationship existing between humans and their environment. This is a Sub Saharan African community that has a long history of direct dependence on the available resources for its daily livelihood. A detailed physical and historical background is presented to provide a context for spatio-temporal variation discovered through change detection using Landsat imagery without ground truth data. The data analysis reveals considerable change within the Upper Noun drainage basin from 1978 to 2002. Within the wetland area in the floodplain, the reservoir shows evidence of large fluctuations in area since the construction of the Bamendjin dam in 1975. Within the reservoir area, an acute siltation has been observed since 1988 and is increasing in area. A significant drop in area of permanent and seasonally flooded prairies was observed. Irrigated farmland areas also show downward trends from 1988 to 2002. Concerning the agropastoral landscape, the upland grazing areas showed a general drop in area, while the mixed farming area increased from 1978 to 2002. The montane forest also decreased in area; however, it appeared to have recovered slightly in 2002 following the successful implementation of the Kilum/Ijim community forest management project. Settlement also showed some expansion in area as a result of growth of most enclosures and openfields to larger villages and major settlements. This study thus provides base data for monitoring human impacts on the Upper Noun drainage basin and its natural habitats, especially within and around the wetland.
©Copyright by Stephen Koghan Ndzeidze August 25, 2008 All Rights Reserved
Detecting Changes in a Wetland: Using Multi-Spectral and Temporal Landsat in the Upper Noun Valley Drainage Basin-Cameroon
by Stephen Koghan Ndzeidze
A THESIS
submitted to
Oregon State University
in partial fulfillment of the requirements for the degree of
Master of Science Presented August 25, 2008 Commencement June 2009
Master of Science thesis of Stephen Koghan Ndzeidze presented on August 25, 2008
APPROVED:
__________________________________________________________ Major Professor, representing Geography
___________________________________________________________ Chair of the Department of Geosciences
___________________________________________________________ Dean of the Graduate School
I understand that my thesis will become part of the permanent collection of Oregon State University libraries. My signature below authorizes release of my thesis to any reader upon request.
___________________________________________________________ Stephen Koghan Ndzeidze, Author
ACKNOWLEDGEMENTS This work has been realized through concerted efforts made by different people at various levels. I wish to express my profuse gratitude to the following: My supervisors Professor Laurence Becker and Denis White for their unflinching devotion to the successful realization of this work. Their valuable criticisms and immeasurable suggestions have immensely added value to this work and my intellectual ability carry out scientific research and writing. Worth gratifying is Professor Jon Kimerling chair of the department, who accepted to be a member of the committee of my thesis. Professor Anne Nolin is specially acknowledged for the independent study with me on digital processing. Her valuable corrections and directions gave this study the desired standard. Special thanks go to the general staff of the Department of Geosciences. In particular, I call to mind Professor Aaron Wolf, Professor Dawn Wright, Professor Roger Nielsen, Professor Gordon Matzke, Professor Julia Jones, Dr. Stephen Lancaster, Dr. Hannah Gosnell, and Professor Brent Steel of department of political science, and Dr. Tracy Arras of department of civil engineering for imparting a great deal of knowledge to me that has greatly upgraded my educational standards. The effort of Joyce Bryan of Oregon State University English Language Institute is specially acknowledged for devoting her valuable time to read and correct the manuscript. The pertinent corrections and valuable suggestions greatly improved my English language skills and enriched the work. My classmates in the department of geosciences are not left out for their constructive criticisms, intellectual cooperation and moral encouragement. I think here particularly of Kyle Hogrefe, Robert Peckyno, Jeremy Adams, Michelle Kinzel, Michele
Lizon, Patrick MacQuarrie and Yarrow Murphy. I am immensely indebted to my dear parents Maurice Ndzeidze and Irene Lantom for their wonderful moral and spiritual assistance. Whole-heartedly I acknowledge with special thanks the United Stated Institute of International Studies for awarding me the Fulbright scholarship to Oregon State University in the department of geosciences.
TABLE OF CONTENTS Page 1
2
INTRODUCTION........................................................................................................ 1 1.1
Research questions .................................................................................................7
1.2
Hypothesis ..............................................................................................................7
1.3
Objectives ...............................................................................................................7
The scientific background of the study ........................................................................ 9 2.1
Defining change detection and remote sensing of wetlands...................................9
2.2
Land use change research relevant to this thesis ..................................................10
2.2.1
Land use change research relevant to Cameroon and Upper Noun .............. 11
2.2.2
Land use change research relevant to Africa and the world ......................... 12
2.3
Combining remote sensing and GIS .....................................................................14
2.4
Conclusion ............................................................................................................15
3 The Physical and Human Background of Upper Noun Drainage Basin and the Wetlands ........................................................................................................................... 16 3.1
Physical characteristics of the Upper Noun drainage basin and the wetlands......16
3.1.1
Climatic contrast within the Upper Noun drainage basin and the wetlands . 17
3.1.2
Water regime, Bamendjin reservoir and the wetlands .................................. 21
3.1.3
Soils in the Upper Noun drainage basin and the wetlands............................ 24
3.1.4
Vegetation, forest exploitation and the wetlands in upper Noun Basin ........ 28
3.2
Human background of the Upper Noun drainage basin .......................................31
3.2.1
Settlement pattern in the Upper Noun drainage basin and the wetlands ...... 35
3.2.2
Land tenure systems in the drainage basin and the wetlands........................ 36
3.2.3
Agricultural systems in the Upper Noun drainage basin and the wetlands .. 37
TABLE OF CONTENT (Continued) Page 3.2.4
UNVDA, land development for swamp rice cultivation and the wetlands... 41
3.2.5 Grazing, transhumance and the wetlands in the Upper Noun drainage basin……………………………………………………………………………………………45 3.3 4
5
Conclusion ............................................................................................................48
Methodology .............................................................................................................. 50 4.1
Data collection ......................................................................................................50
4.2
Data processing.....................................................................................................51
Results ........................................................................................................................ 59 5.1
Changes observed as a result the classification of the land use and land cover for
the Upper noun drainage basin .......................................................................................61 5.1.1. 1978 Rainy season land cover and land use classes for the Upper Noun valley drainage basin ............................................................................................................. 61 5.1.2. 1988 Dry season land cover and land use classes for the Upper Noun valley drainage basin ............................................................................................................. 65 5.2
Change detection analysis for specific land use and land cover classes ..............71
5.2.1
Change detection within the floodplain wetland area. .................................. 73
5.2.2 Change detection within the agropastoral landscape of the Upper noun drainage basin ............................................................................................................. 81 5.2.3
Forest cover ................................................................................................... 83
5.2.4
Settlement in the drainage basin ................................................................... 86
5.3
Other images: classification with challenges.......................................................88
5.3.1 1973 land cover and land use classes for the Upper Noun valley drainage basin……………………………………………………………………………………...……89
TABLE OF CONTENT (Continued) Page 5.3.2 1984 land cover and land use classes for the Upper Noun valley drainage basin……………………………………………………………………………………………91 5.3.3 2001 dry season land cover and land use classes for the Upper Noun valley drainage basin ............................................................................................................. 93 5.3.4 2002 Dry season land cover and land use classes for the Upper Noun valley…………………………………………………………………………………...……...95 5.3.5 2003 dry season total area cover and percentages of the land cover and land use classes in the Upper Noun valley drainage basin................................................. 97 5.3.6 2006 rainy season land cover and land use classes for the Upper Noun valley drainage basin ............................................................................................................. 99 5.3.7 2007 dry season land cover and land use classes for the Upper Noun valley drainage basin........................................................................................................... 101 6
Discussion and Interpretation ................................................................................... 103 6.1
Reservoir creation and change related issues. ....................................................103
6.2
Land reclamation and change related issues with flooded prairies and swamp
forest. ............................................................................................................................104 6.3
Land reclamation and change related issues with swamp rice irrigation. ..........105
6.4
Agropastoral landscape and change related issues within the drainage basin. ...108
6.5
Semi montane and montane forest change and related issues within the drainage
basin…………………………………………………………………………………..108 6.6 7
Settlement and change related issues within the drainage basin. .......................109
Study Evaluation ...................................................................................................... 110 7.1
Future Perspectives and Recommendations .......................................................111
7.2
General conclusion .............................................................................................113
8
References ................................................................................................................ 116
LIST OF FIGURES Figure
Page
1.1
Location of the study area .......................................................................................... 5
1.2
Upper Noun drainage basin and relief ....................................................................... 5
3.1
The relief of the Upper Noun drainage basin........................................................... 18
3.2
The average monthly rainfall for the Upper Noun drainage basin .......................... 19
3.3
The average monthly temperature for the Upper Noun drainage basin ................... 20
3.4
The drainage system and the settlement pattern of the Upper Noun drainage basin 22
3.5
Soil units within the Upper Noun drainage basin .................................................... 25
3.6
Geology of the Ndop floodplain .............................................................................. 26
3.7
Vegetation distribution in the Upper Noun drainage basin ..................................... 29
3.8
Concentric model of the settlement pattern of ethnic communities around the wetlands in the Upper Noun drainage basin............................................................... 33
3.9
The distribution of rice plots in the irrigated areas of the Upper Noun drainage basin .................................................................................................................................... 44
3.10
Cattle movement in the Upper Noun drainage basin during transhumance .......... 48
5.1
1978 percentages of the land cover and land use area cover in the Upper Noun valley drainage basin .................................................................................................. 63
5.2
1978 land use and land cover map ........................................................................... 64
5.3
1988 percentages of the land cover and land use area cover in the Upper Noun valley drainage basin .................................................................................................. 66
5.4
1988 land use and land cover map ........................................................................... 67
5.5
2002 rainy season percentages of the land cover and land use area cover in the Upper Noun valley drainage basin ............................................................................. 69
5.6
2002 land use and land cover map ........................................................................... 70
5.7
Total percentages of the land use and land cover area changes observed and classified for the Upper Noun drainage basin from 1978 to 2002 ............................. 73
LIST OF FIGURES (Continued) Figure
5.8
Page
Change in area cover of the Bamendjin reservoir from 1978 to 2002 ..................... 74
5.9 Change in area cover by silt deposit around the reservoir from 1988 to 2002 in the floodplain. .................................................................................................................. 76 5.10 Comparative change detection within the reservoir area from 1973 to 2007. Notice the conversion of the floodplain lakes (1973) to reservoir 1978, 1988 and 2002. ........................................................................................................................... 76 5.11
Change in permanently flooded prairie change in area cover from 1978 to 2002 . 77
5.12 Change in seasonally flooded prairie percentages of area cover from 1978 to 2002 .................................................................................................................................... 78 5.13
Change in the swamp forest area cover from 1978 to 2002 .................................. 79
5.14
Percentages of irrigated farmlands change in area cover from 1988 to 2002 ........ 80
5.15
Change in upland grazing area cover from 1978 to 2002 ...................................... 82
5.16 Percentages of area cover change in the mixed farming area within the Upper Noun drainage basin from 1978 to 2002. ................................................................... 83 5.17
Semi montane forest area cover change from 1978 to 2002 .................................. 84
5.18 Montane forest area cover change from 1978 to 2002 in the Upper Noun Valley drainage basin ............................................................................................................. 86 5.19 Change in the Ndop settlement area from 1978 to 1988 following swamp introduction in the floodplain. .................................................................................... 87 5.20 Percentages of major settlements, enclosures and openfields area cover change from 1978 to 2002 within the Upper Noun drainage basin. ....................................... 88 5.21 1973 land cover and land use area cover in the Upper Noun valley drainage basin .................................................................................................................................... 90 5.22 1984 land cover and land use area cover in the Upper Noun valley drainage basin .................................................................................................................................... 92 5.23 2001 rainy season land cover and land use classes in the Upper Noun valley drainage basin............................................................................................................. 94 5.24 2002 dry season land cover and land use classes in the Upper Noun valley drainage basin............................................................................................................. 96
LIST OF FIGURES (Continued) Figure
Page
5.25 2003 dry season land cover and land use classes in the Upper Noun valley drainage basin ............................................................................................................. 98 5.26 2006 rainy season land cover and land use classes in the Upper Noun valley drainage basin........................................................................................................... 100 5.27 2007 dry season land cover and land use classes in the Upper Noun valley drainage basin ........................................................................................................... 102 6.1
Degrading grazing land at the slopes of the Mbam massif that over look Ber ...... 104
6.2
Swamp rice production under directives from the UNVDA and the number of farmers from 1977/78 to 2002/23 production year. ................................................. 107
LIST OF TABLES Table
Page
3.1
Effects of altitude on average yearly temperatures on selected areas within the drainage basin ............................................................................................................. 19
3.2
Average monthly rainfall distribution in the floodplain and high elevation (units are mm) ...................................................................................................................... 19
3.3 Average monthly temperature for Ndop plain .......................................................... 20 3.4 Altitudinal zonation of vegetation in the Upper Noun drainage basin ..................... 30 3.5 Population distribution in the drainage basin............................................................ 35 3.6 Crops and periods introduce in study area. ............................................................... 38 3.7 Agricultural calendar of some crops in the Drainage Basin ..................................... 40 3.8 UNVDA 5 zones of action ........................................................................................ 43 3.9 Transhumance in the Upper Noun drainage basin .................................................... 46 4.1 The acquisition dates, orbital Path/Row and the Landsat sensor data used in the analysis. ...................................................................................................................... 50 4.2
Land use and land cover classes, and spectral signatures identified in the Upper Noun drainage basin ................................................................................................... 56
5.1
1978 total area cover and percentages of the land cover and land use classes in the Upper Noun valley drainage basin ............................................................................. 62
5.2
1988 total area cover and percentages of the land cover and land use classes in the Upper Noun valley drainage basin ............................................................................. 66
5.3
2002 rainy season total area cover and percentages of the land cover and land use classes in the Upper Noun valley drainage basin. ...................................................... 69
5.4
Percentages of the different land cover and land use classes for the area cover and change within the different classes for the Upper Noun drainage basin from 1978 to 2002. ........................................................................................................................... 72
5.5 Change in the reservoir area from 1978 to 2002....................................................... 74 5.6 Change in the area covered by sediments from 1988 to 2002 .................................. 75
LIST OF TABLES (Continued) Table
Page
5.7 Change in permanently flooded prairies area cover from 1978 to 2002................... 77 5.8 Change in seasonally flooded prairies area cover from 1978 to 2002. ..................... 78 5.9 Swamp forest and change in area cover from 1978 to 2002 ..................................... 79 5.10 Change detection in the irrigated farmlands in the floodplain from 1988 to 2002 .................................................................................................................................... 80 5.11
Change in upland grazing area from 1978 to 2002 ............................................... 82
5.12
Mixed farming and grazing area cover from 1978 to 2002 .................................. 83
5.13
Semi montane forest area cover change from 1978 to 2002 ................................. 84
5.14
Montane forest area cover change from 1978 to 2002 ......................................... 85
5.15 Major settlement areas and openfields and enclosures area cover from 1978 to 2002 within the Upper Noun drainage basin .............................................................. 87 5.16 Total area covered and percentages of land use and land cover for the Upper Noun valley drainage basin .................................................................................................. 89 5.17 1984 rainy season total area cover and percentages of the land cover and land use classes in the Upper Noun valley drainage basin ....................................................... 91 5.18 2001 total area cover and percentages of the land cover and land use classes in the Upper Noun valley drainage basin ............................................................................. 93 5.19 2002 dry season total area cover and percentages of the land cover and land use classes in the Upper Noun valley drainage basin. ...................................................... 95 5.20 2003 dry season total area cover and percentages of the land cover and land use classes in the Upper Noun valley drainage basin. ...................................................... 97 5.21 2006 rainy season total area cover and percentages of the land cover and land use classes in the Upper Noun valley drainage basin. ...................................................... 99 5.22. 2007 dry season total area cover and percentages of the land cover and land use classes in the Upper Noun valley drainage basin. .................................................... 101
1
1
Detecting Changes in a Wetland: Using Multi-Spectral and Temporal Landsat in the Upper Noun Valley Drainage Basin-Cameroon
1
INTRODUCTION Detecting change of Earth’s surface features provides the foundation for better
understanding of relationships and interactions between human activities and natural phenomena. Increased understanding is necessary for improved resource management (Lu, et al. 2004; Jensen, 2005). Detecting change involves applying multi-temporal datasets to quantitatively analyze the temporal effects of phenomena (Lu, et al. 2004; Zoran, 2006). Since the early 1980s, satellite imagery has become commonly used to improve change detection in wetlands. Major data sources for such analyses include Landsat, Satellite Probatoire d’Observation de la Terre (SPOT), radar, and Advanced Very High Resolution Radiometer (AVHRR). Landsat multispectral and temporal imagery is a particularly important source of data for observing changes in wetlands. This is because it provides continuous coverage since the 1970s and contains bands that are sensitive to changes in vegetation coverage and soil moisture. The earliest Landsat imagery dates to 1972 (Jensen, 2005 Bauer et al. 2003). Remote sensing thus provides a unique opportunity to characterize the spatio-temporal distribution of these changes (Pietroniro and Töyr, 2002; Dixon and Candade, 2008) and to collect important baseline wetland information that is too difficult to obtain using field-based methods. Early images paired with more recent images can be used to detect changes in the landscape over that period (Jensen, 2005; Chen et al. 2007). Remotely sensed images are being used to address critical wetland resource management problems, providing researchers with the ability to make rapid decisions
2
about large spatial areas using recent data (Yaw and Edmund, 2007). Wetland dynamics operate at multiple spatial and temporal scales, requiring researchers to be able to make multi-scale observations using satellite images (Zhou et al. 2008). Satellite images can easily detect and map both local and large area land use/land cover changes, and the impact they have on wetland processes (Zhou et al. 2008; Lu et al. 2004). Concern about change in the size and quality of many of the world’s wetland systems has been growing as more and more wetlands are being converted to agricultural or urban use and affected by natural factors like drought (Munyati, 2000). To date, satellite-sensor-based monitoring techniques have demonstrated a potential for determining changes in wetland cover (Nelson et al. 2002; Jensen et al. 1995; Alex et al. 2003). Wetlands are among the most productive life support systems in the world (Ramsar Convention Secretariat, 2008). They are critical for the maintenance of biodiversity by supporting the growth and development of wide varieties of natural vegetation and serve as breeding grounds for many wildlife and fish species (Ramsar Convention Secretariat, 2008). Wetlands serve as “sinks,” scrubbing carbon dioxide from the atmosphere, which combats global warming (Ramsar Convention Secretariat, 2007)1. Communities that live around these wetlands in some parts of the world depend directly and indirectly on them for indigenous agro-pastoral activities such as farming, cattle rearing, and fishing that generate more income for the rural population. Wetlands are thus an important natural resource that can serve humans and natural ecosystems in a variety of ways. Some of these include agriculture, fishing, hunting, grazing, collecting herbs, wood and other building materials, power generation, and for other industrial purposes. As a prelude to wetland resource conservation, 1
Volume 9
3
it is necessary to map them, determine whether or not they have changed over specified time periods, and quantify the changes, if any (Munyati, 2000). Insufficient reference data to assess the state of changes in the wetlands of subSaharan Africa, and Cameroon in particular, because of few studies has been one of the major obstacles to the formulation of better management strategies to guard against persistent habitat degradation and loss. Wetlands occupy about 345,000 km2 in Africa (Mitsch and Gosselink, 2000). Most of these wetlands are found south of the Sahara Desert and north of the Tropic of Capricorn (Mitsch and Gosselink, 2000). Major wetlands include the Democratic Republic of Congo swamps (200,000 km2), the interior delta of the Niger in Mali (320,000 km2), the Sudd of Upper Nile, (more than 30,000 km2), and the Okavango (16,000 km2) (Mitsch and Gosselink, 2000). Cameroon has a diverse array of wetlands (WWF, 1999). These wetlands maintain a hydrological balance and support a wide range of physical, biological and chemical exchanges that take place in the wetland surroundings and beyond the area (Mbenkum, 1999). These wetlands are undergoing tremendous ecological changes largely due to human activities, such as land development and unsustainable exploitation of wetland products. The Upper Noun Valley is an important wetland that plays a significant socio-economic and ecological role in sustaining human, plant and animal life. The drainage basin constitutes a peculiar relief entity on the high-dissected Bamenda plateau. Rainfall at these altitudes and in most of the region attains 2,500 to 3,000 mm per year. This humid nature and substantial precipitation of the region supports extensive wetlands. These wetlands are particularly unique in character because they lie within the western high plateau of Cameroon where they support a wide range of wildlife, especially
4
waterfowl that are protected in wetland habitats (Ramsar Convention Secretariat, 2007)2. Also referred to as the “iron belt” of the grassfields of Cameroon, the floodplain has iron ore and kaolin deposits and was the center of pre-colonial iron smelting and production of local handicrafts (Warnier and Fowler, 1979). The drainage basin contains montane forest at high altitudes (above 2,000m) and sub-montane forest (at altitudes 1,200 to 2,000 m). Sub-montane forest in the river valleys, with its original sudano-guinean shrubs and tree savanna, extends into the floodplain. The river valleys are interspersed with swamp forests and seasonally flooded prairie dominated by Pennisetum purpureum. Located between latitude 5o42’ and 6o10’ north of the equator and longitude 10o11’ and 10o40’ east of the Greenwich Meridian (Figure 1.1 and Figure 1.2), the basin is bounded to the north and northwest by the Menchum and Katsina Ala River basins (Ngwa, 1985). To the East are the Tikar plain (another wetland), the Mbam and Lower Noun River Valleys. The Upper Noun Valley covers a surface area of about 2,347 km2. Northwest of the basin are distinct mountain blocks whose main escarpment overlooks the rest of the basin. The rock basement is made up of basaltic lava and trachytes, which also condition the soils of the area. These geologic features are also made of volcanic rocks in the Mount Oku range that largely account for the fertile alluvial volcanic deposits on the floodplain. In the west are the Bamboutos (2,740 m) and Lefo (2,550 m) peaks. To the north and northwest lie Mount Santa (2,011 m) and Oku (3,011 m) (Ngwa, 1985). The two isolated Mbam (2,335 m) and Nkogam Massifs (2,263 m) emerge in the east and southeast section of the basin, respectively. The average altitude of the floodplain ranges from 900 to 1,200 m above sea level (Figure 1.1 and Figure 1.2). 2
Volume 5
5
Figure 1.1 Location of the study area
Figure 1.2 Upper Noun drainage basin and relief Source: Adapted from Ngwa (1985), Lambi (2001), Ndzeidze (2004)
Much of the water in the Upper Noun wetland originates in the surrounding highlands. Numerous streams draining into the floodplain arise from the surrounding
6
highlands giving the area its wetland characteristics such as swamp forest, lakes, and marshes that sustain abundant wildlife, including fishes, birds, waterfowls and animals (Mbenkum, 1999). Vegetation has however undergone profound modification due to human intervention in the drainage basin. As a result, the plain has become a large lake, with swamps, marshes and a savanna mosaic (Ndueh, 1990). Rich in fish, wood, fodder, herbs and game wildlife, the plain attracts seasonal in-migrants (Ngang, 1998). The Upper Noun plain is home to thirteen different ethnic groups, which depend directly on these wetland products for their daily survival during both the rainy and dry seasons. Land use practices include agriculture, grazing, swamp rice cultivation, and reservoir development. These land use practices within the wetland area and the drainage basin perturb the ecological processes and lead to loss of wetland area. An imbalance may thus be created in the flood plain wetland ecosystem. Changes in ecological characteristics may result in the extinction of some indigenous plants and fish species and diffusion of exotic species. The Upper Noun Valley drainage basin is an example of a changing wetland. Little is known about land use and land cover change, and related impacts on the natural habitats in the Upper Noun to the best of the researcher’s knowledge. No change detection study using satellite remote sensing and GIS has been carried out in this region. Land use practices, such as wetland reclamation and agropastoral activities on the surrounding hill slopes, are unsustainably carried out within and around the wetlands areas without a clear understanding of the consequences to humans and the environment (Ndzeidze, 2004). Multi-temporal and multi-spectral satellite images can provide an effective means for monitoring human impacts on natural habitats within and around the
7
wetland (Ghanavati et al., 2008). An assessment using satellite imagery can thus guide policy makers to develop sustainable conservation plans. 1.1
Research questions The following are this study’s key research questions to determine the extent of the
change on the wetland area and the drainage basin as a whole: -
What changes have been observed in the Upper Noun drainage basin as determined by multi-temporal and multi-spectral Landsat images from 1973 to 2007?
-
To what extent can available Landsat MSS, TM, ETM and ETM+ imagery for the Upper Noun drainage detect the state of change in land use and land cover?
1.2
Hypothesis The central working hypothesis is that: multispectral and temporal analysis of
Landsat imagery enables the assessment of change and classification of land cover and land use both within and outside the wetlands area in the Upper Noun drainage basin from 1973 to 2007 during the dry and rainy season. 1.3
Objectives The overall objective of this study was to utilize remote sensing and GIS
technology to determine the extent of change on the wetland area and the Upper Noun drainage basin from 1973 to 2007. Specific objectives were
8
1) to map land cover and related land use practices within the wetland and surrounding areas of the drainage basin using Landsat images from 1973 to 2007 using the supervised maximum likelihood classification algorithm. 2) to map land use and land cover classes by seasons in order to determine humaninduced pressure on the wetland area and the drainage basin using available Landsat MSS, TM and ETM+ imagery. 3) to utilize GIS in confirming and finalizing the land use and land cover classes and delimitation of the Upper Noun drainage basin by incorporating auxiliary data such as settlements and hydrology.
9
2
The scientific background of the study
2.1
Defining change detection and remote sensing of wetlands Current trends in assessing wetlands land cover and land use changes using
satellite images show many applications of change detection methods. However, very few applications have focused on change detection of wetlands using remote sensing. Change detection using satellite remote sensing entails spatio-temporal assessment of land cover and land use dynamics within a defined area of study. Many change detection techniques have been developed, and these have been summarized and reviewed by Lu et al. (2004), Singh (1989), Coppin and Bauer (1994), Jensen (2005), Jensen et al. (1987), Yuan et al. (1998), Bruzzone and Serpico (1997), Dewidar ( 2004). This change detection study is both multi-temporal and multi-spectral. It is multitemporal because it uses a time series analysis of particular or different satellite sensors. Satellite images could be from multi-spectral from optical sensors or multifrequency/multi-polarization synthetic aperture radar (SAR) images (Chen, 1998; Jensen 2005; Baghdadi et al. 2001). Singh (1989) defines change detection as a “process of identifying differences in the state of an object or phenomenon by observing it at different times”. Change detection requires a comparison of the spectral reflectance values between two or more periods of time (Christensen, et al., 1988). Lu, et al., (2004) concluded that change detection involves the application of multi-temporal datasets to quantitatively analyze the temporal effects of the phenomenon. Jensen (2005) indicated that good change detection performance requires a geographic zone of interest, time period, and appropriate land use and land cover classification systems. The basic idea behind any change detection task is comparing two or more images/maps or, in general,
10
comparing the data of the same geographical area to find and mark non-similar features on the available data (Ghanavati et al., 2008). Lu et al, (2004) also point out that good change detection research should provide the following information: area of change and change rate, spatial distribution of changed types, change trajectories for land cover types, and accuracy assessment of change detection results. In a more detailed approach to analysing spatio-temporal patterns using remote sensing change detection and monitoring based on previous methods by Singh (1989), Coppin et al (2004) and Lu et al. (2004), change detection approaches were characterized into two broad groups. These groups are bi-temporal change detection and temporal trajectory analysis (Zhou et al., 2008). The former measures land cover changes based on a ‘two-epoch’ timescale, i.e. the comparison between two dates. Even if land cover information is sometimes acquired for more than two epochs, the changes are still measured on the basis of pairs of dates. The latter group analyzes the changes based on a continuous timescale, i.e., the focus of the analysis is not only on what has changed between dates, but also on the progress of the change over the time period. In general, the aim of bi-temporal change detection is to obtain details of change/no change or ‘from–to’ information in between the detection dates (Zhou et al., 2008). This study examines the progressive change over the period from 1973 to 2007 in the Upper Noun Basin. 2.2
Land use change research relevant to this thesis Detecting changes on wetlands using satellite remote sensing has greatly
facilitated qualitative and quantitative spatial and temporal analysis of change due to diverse human factors. There is a paucity of studies on change detection and wetlands
11
using remote sensing for Sub-Saharan Africa and Cameroon in particular, and more especially for the study area, despite its ecological, socio-cultural and economic importance in the region. 2.2.1
Land use change research relevant to Cameroon and Upper Noun Related studies that bring to light the associated environmental problems due to
observed changes in wetland ecological characteristics do not include change detection analysis using remote sensing and GIS. Such studies have been carried out by IUCNCameroon (1997), Mouafo et al. (2002), Lesinge and Garthland (1997), WWF Cameroon (1999), Gerrish (2005), Mbenkum (1997, 1999) (on the Waza Logone flood plain in the northern province of Cameroon). In the Upper Noun Valley drainage basin, Mbenkum et al. (1997), Ndzeidze (2001, 2004), Ngang (1998), and Oijen and Kemdo (1996), focused on the Cameroon wetlands types and the observed changes especially in the Upper Noun floodplain due to excessive human intervention. Wirngo (1989), Ngwa, E. (1979, 1985, 1995, 2000), and Ngwa, C. (2003), Fonjong and Mbah (2007) provided an assessment of swamp management in the Upper Noun floodplain. Meanwhile, Fogwe (1990), Nkwemoh (1999), and Hawkins and Brunt (1965) studied the soils and ecology in Upper Noun Basin in general, while Lambi (1999, 2001) and Ndueh (1990) studied the creation of the Bamendjin dam and its related human and environmental impacts. Agro-pastoral activities studies with a particular reference to the Upper Noun flood plain as a transhumance and mixed farming zone include: Course (1965), Ngwa, E. (1985), Nkwemoh (1999), Dongmo (1983, 1989), and Boutrais (1974). Generally, these studies examined the relationship between the uphill grazing
12
areas during the rainy season and the flood plain during the dry season, with related environmental, socio-economic and cultural implications. This study will attempt to determine the far-reaching role of these human factors on the land cover and land use in the Upper Noun drainage basin. Annual reports that are updated quarterly by the various concerned administrative departments are significant because they help explains some of the changes observed from satellite images in the Upper Noun drainage basin. Such available reports for the Upper Noun are from the Ministry of Agriculture (MINAGRI; 1972, 1977, 1984, 1987, 2000, 2002), Ministry of Environment and forestry (MINEFNgoketunjia, 2002), and Ministry of Livestock Fisheries and Animal Industry (MINEPIA-Ministere des elevage, Peche et Industriel Animal- Ngoketunjia; 2002, 2003). These reports provide the major source of primary (non-remote sensing) data for the study area. This change detection study will use these available data. 2.2.2
Land use change research relevant to Africa and the world Several change detection studies elsewhere in Africa played a helpful role in
guiding this study. Munyati (2000), in assessing wetland change detection on the Kafue Flats floodplain wetland system in Zambia, used four Landsat images (MSS 1984, 1988 and TM 1990, 1994) to calculate area cover change from year to year through an evaluation of each land cover and land use class in different images. A change detection map was produced for the floodplain that distinguished the different vegetation classes in the upstream areas of the wetland in this part of Zambia. Similarly, the change detection in Upper Noun will utilize the supervised maximum likelihood algorithm to obtain land cover and land use classes, but with a time series spectrum stretching from 1973 to 2007.
13
A similar study in the Okavango Delta wetland (Neuenschwander and Crews-Meyer, 2006) on multi-temporal mapping of disturbances in land cover used landsat TM and EMT+ images in a time series from 1989 to 2002. The annual history of flooding and fire was mapped. This study showed that both flooding and fire play a combined role in the floodplains of the lower Okavango, an area where less frequently grazed grasses accumulate sufficient biomass to sustain frequent burning. Land cover change within wetland areas has been the main concern of many change detection studies. Dewidar (2004), Kiage et al. (2007), Diuk-Wasser et al. (2004), Ma et al. (2007) and Nelson et al. (2002) applied change detection with a particular focus on land cover changes using remote sensing. Generally two or more sets of images were compared, for example the detection of land use/land cover changes for the northern part of the Nile delta using two sets of Landsat-5 images between 1984 and 1997 (Dewidar, 2004). Kiage et al. (2007) acquired two datasets from Landsat TM (1986) and ETM+ (2000) to detect evidence of land cover and land use changes and associated land degradation, especially for wetlands adjacent to Kenya’s important Lake Baringo in east Africa’s savanna region. Simple image differencing was adopted for the change detection, which enabled the comparison of land-cover/use classification maps for 1986 and 2000. Supervised maximum likelihood classification algorithm is used for change detection in Upper Noun because supervised classification depends to a greater extent than other methods on a combination of background knowledge and personal experience with the study area (Jensen, 2005). The study by Kashaigili et al. (2006) on the dynamics of Usangu Plain wetlands in Tanzania investigated long-term and seasonal changes that
14
have occurred as a result of human and developmental activities for the periods between 1973 and 1984, and between 1984 and 2000. Similarly, the historical and contemporary human and physical background of the Upper Noun drainage basin will be examined to better understand the extent of the change using remotely sensed Landsat data. Baker et al. (2007) also used Landsat satellite imagery from 1988 and 2001 to map changes in wetland ecosystems in the Gallatin Valley of southwest Montana. Data sources from various satellite sensors have become available for monitoring and analyzing wetland ecological dynamics during the past four decades. A wide range of studies using these sensors shows their effectiveness in detecting and quantifying change using several methods of change detection. Townsend (2001), Civco et al. (2002), Parmuchi et al. (2002), Peterson and Aunap (1998), Jensen et al. (1993) and Yong et al. (2002) are examples of these studies. 2.3
Combining remote sensing and GIS Remote sensing and GIS have been widely used jointly in change detection
methods. Yaw and Edmund, (2007) in using remote sensing and GIS in the analysis of ecosystem decline in the Niger River basin acquired multi-seasonal landsat TM and ETM+ images. Using satellite imagery and GIS facilitated the analysis of the geographic diffusion of riverine ecological decline. In this study, ArcGIS will be used to delimit the drainage basin, and related data such as hydrology and settlements from the Upper Noun will be extracted from Global Forest Watch Cameroon auxiliary data, after radiometric and atmospheric correction, and multi-spectral classification of the Landsat images in ENVI. This process is easy with ArcGIS because the extracted limits of the drainage
15
basin give the exact values of the delimited area. Other studies combining GIS and remote sensing include Owor et al. (2006), Jinghui (2005), Iverson and Risser (1987) and Xiuwan (2002) 2.4
Conclusion Change detection from remote sensing data and its application in natural resource
management and wetland studies in particular have led to advances in methods, concepts, and theory. In general, change detection simply means comparison between two or more dates to observe a difference based on acquired or available data from satellite images, aerial photos, or personal experience and archives about a particular area of interest or study. In practice, much has been done around the world to study change detection of land cover and land use on wetlands and other natural resources using satellite images. However, very little has been done in Africa and Cameroon, with relatively none in the Upper Noun drainage basin. This study is, therefore, of paramount importance in contributing to the scientific background and long term assessment of observed changes in the drainage basin from 1973 to 2007. This study covers a broad spectrum of spatiotemporal realities of land cover and land use assessment in the drainage basin given the diverse related land use practices and the excessive exploitation of the available natural resources, especially the wetlands (Ndzeidze, 2004).
16
3
The Physical and Human Background of Upper Noun Drainage Basin and the Wetlands To better understand the extent of changes in the Upper Noun drainage basin
through remote sensing requires a detailed presentation of the physical environment and human background. This chapter examines in detail the historical and contemporary physical and human constituents of the Upper Noun drainage basin as a prelude to understanding spatio-temporal variation through change detection using Landsat imagery. Presenting the physical and human background is important because the study is largely using satellite images for change detection in the drainage basin. These empirical realities will aid understanding the extent of spatio-temporal variation through change detection using Landsat imagery without ground truth data. The Upper Noun basin has a population density of approximately 70 persons per square kilometer. This population density is far above the national figure of 32 persons per square kilometer (MINAGRI, 2002). Agriculture is the main human activity in the drainage basin and involves more than 85% of the total population (MINAGRI, 2000). The historical and contemporary physical and human background of the Upper Noun drainage basin and the wetlands is presented. 3.1
Physical characteristics of the Upper Noun drainage basin and the wetlands Two hypotheses concerning the geological origin of the drainage basin have been
proposed by Ngwa (1985). The first suggests that the basin was created by tectonic activity; this hypothesis is supported from study of the escarpments surrounding the basin (Figure 3.1). They are very abrupt, and this can only be due to repeated violent tectonic disturbances. The escarpments that separate Jakiri from Babessi, Sabga and Bamessing,
17
and Santa from Bali-Gansin are evidence to support the down-warping of the basin through such visible scarp faces. The second hypothesis suggests tectonic movements, which were accompanied by volcanic lava flows and resulting different phases of erosion. According to Ngwa (1985) there must have been a lava flow across the Upper Noun River, blocking and creating an inland lake. Later, there must have been down cutting to open up a south-east gateway, draining the lake. Evidence for such an inland lake is based on the existence of the marshes and swamps with other associated ecological elements which cover the areas stretching from Bamunka, through Babungo to Babessi and across to Bambalang and Ber (Ndzeidze, 2004; Ngwa, 1985; Ngang, 1998). An intricate ecological system resulted from these relief elements and led to a unique wetland on the dissected Bamenda Plateau. 3.1.1
Climatic contrast within the Upper Noun drainage basin and the wetlands The Upper Noun basin’s main physical element is altitude as it affects
temperature and precipitation, and the subsequent daily and annual variations in temperature and rainfall distribution. The basin has a warm climate in the floodplain and cold climate in high elevations. Considered one of the hottest parts of the western plateau of Cameroon, the floodplain experiences tropical climate conditions. This is characterized by two distinct seasons - a dry season which lasts for four months (November to March) and a rainy season that lasts for eight months (March to October) with the wettest months between June and October. Northward and southward displacement of the Intertropical Front (ITF) and the consequent effects of major air masses associated with the fronts, dictates this climate. However, variations in altitude within the basin further create a
18
heterogeneous distribution of temperature with a sharp contrast between the upland and the floodplain (Figures. 3.2 and 3.3, and, Tables 3.1 and 3.2).
Figure 3.1 The relief of the Upper Noun drainage basin
19
Table 3.1 Effects of altitude on average yearly temperatures on selected areas within the drainage basin Locality (Figure 3.1) Altitude
Bambalang (Floodplain) 1,170 m
Babungo (Floodplain) 1,180 m
Babanki-Tungo (Slopes Jakiri (Slopes east West of the Basin) of the basin) 1,300 m 1,800 m
Average yearly Temperature
21.4°C
21.8°C
21.5°C
17.5°C
Source: Direction de la meteorologie Douala. Tableau climatologique Décennal 1991. Bamenda station Latitude 6 o13’ and longitude 10o07’. Table 3.2 Average monthly rainfall distribution in the floodplain and high elevation (units are mm) Region
Attitude
Bamunka 1,160m (Ndop) Jakiri 1,800m
J
F
M
A
M
J
JY
A
S
O
N
D
6
19
112
159
178
187
209
217
273
178
43
7
Yearly Total 1,589
8
45
143
157
176
247
301
337
303
271
48
6
2,041
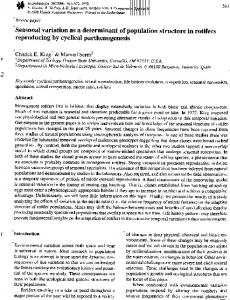
Fig. 3.2. Average monthly rainfall in the Upper Noun drainage basin
Rainfall
400 200
Ndop Jakiri
0 J
F
M A M
J JY A Months
S
O
N
D
Figure 3.2 The average monthly rainfall for the Upper Noun drainage basin Source: Direction de la meteorologie Douala. Tableau climatologique Décennal 1991. Bamenda station Latitude 6 o13’ and longitude 10o07’. The rainfall in the plain is between 1,000-2,500 mm compared to the high mountain region receiving 3,000 mm (annually) because of the misty and cloudy conditions and orographic effects. The rainfall is induced both by orographic and convectional effects due to the surrounding hills and prevailing winds.
20
Table 3.3Average monthly temperature for Ndop plain Months
J
F
Ndop mean 22 monthly average 22 o TC Jakiri mean monthly average 20.1 21.8 ToC
M
A
M
J
J
A
S
O
N
24
22.5
22
21
21
21
25
21.5
21.75 21.7
21.6 20.5
20.0 19.1 18.1 17.7 18.7 19.2
19.4
D
20.9
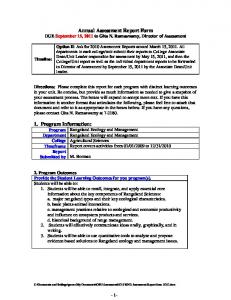
Temperature
Fig. 3.3. Average monthly temperature for Upper Noun drainage basin 40 20
Ndop Jakiri
0 J
F M A M J J A S O N D Months
Figure 3.3 The average monthly temperature for the Upper Noun drainage basin Source: Direction de la meteorologie Douala. Tableau climatologique Décennal 1991. Bamenda station Latitude 6 o13’ and longitude 10o07’. Generally, large wetlands such as the Upper Noun floodplain function ecologically in stabilizing the local climatic conditions particularly rainfall and temperature. There is a very distinct dry season between November and March and the wettest months are from June to October. March is the month within which the rainy season starts. The first rains set in motion intense agro-pastoral activities which range from land preparation through planting of crops to the uphill migration of pastoralists and their cattle. Average temperatures during the day are usually above 25oC with peaks of 36 oC in the afternoons during February/March. Temperature during the day in the Ndop floodplain varies little with different periods of the day, for instance 24 oC in the evening and 25 oC in the morning (Ngang, 1998). However a high diurnal variation occurs as night temperatures
21
fall as low as 16 oC with little or no rainfall in contrast to the usually heavy rainfall during the day. 3.1.2
Water regime, Bamendjin reservoir and the wetlands The floodplain often becomes flooded during the rainy season, particularly in the
months of July, August and September. Rivers overflow their banks from March to October due to runoff from the surrounding highlands, giving the area its wetland characteristics. The wetland characteristics here are swamp forest, lakes, and marshes with hydromorphic soils supporting hydrophytes that sustain abundant wildlife such as fish, birds, and especially waterfowl and mammals. Floodwaters in the wetlands are derived from six main rivers which merge in the plain to form the tributary of the Noun River (Figure 3.4). These rivers are Monoun flowing from the Mbam Massif, Rivers Nankon, Noun and Mukie that flow from the Mount Oku and Njinikom range to form the Nun marsh, and Rivers Tambou and Tengueng flowing from the Santa range through Balikumbat into the Bamendjin reservoir (Figure 1.2). Following the completion of the construction of the reservoir in 1975, and land development for paddy rice cultivation by the Upper Noun Valley Development Authority (UNVDA) by 1985, there has been a great adjustment in the water regime. The channeling and diverting of some of the rivers into embankments, and draining of some floodplain lakes, swamp forest and marshes to prepare for rice cultivation significantly changed the ecological character of some parts of the floodplain. This was typical in the Monoun section of the floodplain (Ndzeidze, 2001). These floodplain lakes that were generally referred to as the Ndop floodplain lakes and the swamp forest acted as water
22
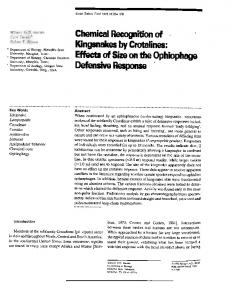
storage facilities for ground water recharge and discharge in springs and wells.
Figure 3.4 The drainage system and the settlement pattern of the Upper Noun drainage basin
23
The feasibility study and subsequent construction of the Bamendjin reservoir started in 1971 to hold back the river Noun and its braided tributaries in the flood plain. In 1975, construction was completed across the Noun River at Bamendjin. This held back water to reinforce the hydroelectric plant downstream at Edea during the dry season. Since its construction, waters held behind have generated a number of problems on the one hand, and set into motion a number of competing water and land use systems on the other hand (Ngwa, 2003). When the dam water reaches the highest level, which at the dam recording station is 1,151 meters, the dam is said to be at full capacity (Ndueh, 1990). When the sluice of the Bamendjin dam is closed during the first week of June, the accumulation of flood water begins and by late August or September full capacity is usually reached (Ndueh, 1990). The water held behind the dam floods all lowlands and the flooding reaches the fringes of the floodplain as far inland as Bamessing, Ber, Bangolan, Bamessing, Babungo and Bamukumbit (Ngwa, 1985; Ngang, 1997; Mbenkum, 1999; Ndzeidze 2001). At such times the lake covers an area of some 333 km2 and holds about 1,875,500 m3 of water. Any rise above the limit earlier mentioned is closely observed and the dam is opened so as to allow excess water to flow out. If the water level reaches the highest peak of 1,155 meters it will cover a land area of 442 km2 and hold 3,434,000 m3 of water, flooding all the valley heads (Ngwa, 1985; Ngang, 1997; Mbenkum, 1999; Ndzeidze, 2001). On the other hand, extreme dry conditions are created during the dry season. This corresponds to the opening of the sluice in the Bamendjin dam between December and January to supply water into the River Sanaga basin (River Sanaga is the largest and longest river in Cameroon and places Cameroon second to the Democratic Republic of Congo in terms of
24
hydroelectricity potential in Africa (Encyclopedia of the Nations, 2008)). During this period the reservoir influences flooded areas that are completely dry except for the permanent swampy and marshy wetland areas, and remaining dam waters. The opening and closing of the dam, however, depends on the water level of the Sanaga River and the volume of water needed to supply the hydroelectric power station at Edea. Operating since 1975, the opening date falls in December and January, depending on the annual fluctuation of the Sanaga River. 3.1.3
Soils in the Upper Noun drainage basin and the wetlands Topography and other elements such as volcanic activities and the numerous
streams that drain the basin are largely responsible for the distribution of various soil types found in the Ndop floodplain (Figures 3.5 and 3.6). Generally identified soils units are hydromorphic (histosols3) depositional soils that are rich in mineral and organic content and associated colluvial and alluvial (fluvisols4) soils (Hawkins and Brunt, 1967) (Figure 3.5 below). The hydromorphic depositional soils range from highly organic to moderately organic and weakly organic soils. The marshy nature of areas sustaining these hydromorphic depositional soils in the Ndop plain is due to large quantities of water accumulating on the plain from the surrounding highlands, and the lava which obstructed the flow of the Noun tributaries (Ngwa, 1985; Ndzeidze, 2001). Sub-types of depositional soils distinguished are colluvial soils, derived from granitic rocks and occur mostly at the edge of the plain at the foot of the escarpment.
3 4
FAO soil class for hydromorphic soil FAO soil class for alluvial soil
25
Peculiar pockets of colluvial deposits are located at the Monoun in Ber (Ndzeidze, 2001) and the western Noun tributary valley heads of the flood plain in Bamessing, Bamunka, Bamali, Bangolan, and the lower slopes of Njigombe and Njitapon (Ngwa, 1985). Alluvial soils made of lava and granitic material result from the drainage characteristics of main rivers entering the plain.
Figure 3.5 Soil units within the Upper Noun drainage basin
26
Figure 3.6 Geology of the Ndop floodplain
Three types exist: better-drained upper alluvial soils, deposited by all the main rivers entering the plain, alluvial soils of the seasonally affected Noun flood plain, and
27
the swamp soils. Alluvial soils of the seasonally flooded zones and the swamp soils are rapidly permeable, but occasionally flooded at the end of the rainy season. The top soil is silt loam and black in color (Ngwa, 1985; Mbenkum, 1999; Ngang, 1997). Surrounding the main basin, especially to the south and south-west, are a mixed occurrence of granitic or less evolved soils, the pyroclastic or recent lava soils. On the higher slopes are rejuvenated soils on granito-gneissic colluvium or simply on weathered basalts. The valley heads sustain deep gleyed, modal gleyed alluvial soils and organic gleyed alluvial soils (Ngwa, 1985). Soils on the steep slopes tend to be stony due to human influence through over-grazing, annual vegetation burning, and poor farming methods. This is typical on the Mbam and Nkogam massifs and Oku range with ferrallitic soils (Figure 3.5). Cattle graze around such places continuously during the rainy season. The soils peat, high mineral and organic content favors the growth of raphia palms (Raphia spp), oil palm (Elaeis guineensis), Raphia mambillensis, rice, vegetables and many food crops. Granitic rocks are exposed mainly on the eastern limit of the drainage basin as shown by the Mbam and Nkogam massifs. Other patches are exposed to the north of Bamunka, north of Galim and south-east of Babanki-Tungo. These rugged and mountainous environments are highly erodible and the major land use practice here is grazing or mixed subsistence farming. Pyroclastic and recent lava soils occur only in patches in the southern portion of the Upper Noun drainage basin, especially on the elevated eastern relief around Njitapon, in central Galim and Bamendjin (Ngwa, 1985).
28
3.1.4
Vegetation, forest exploitation and the wetlands in upper Noun Basin Due to altitudinal zonation in the drainage basin, vegetation varies from the high
plateaus to the low plateaus including the piedmonts with their alluvial fans, and to the marshy plain. This variation in altitude influences variation in the soil types, the hydrology and edaphic environment. The high plateaus (above 1,500 meters) which receive abundant precipitation have undergone multiple anthropogenic influences (Ngwa, 1985). High population densities have led to deforestation, overgrazing and intensive cropping systems with few or no fallow periods, especially since the early 1980s. Remnants of dense vegetation dominated by Symphonia globulifera, and Strombosia scheffleri still exist in inland valleys and slopes, especially those exposed to high precipitation (Table 3.4 and Figure 3.7) (Asanga, 2002). Other species found here are Albizia gumnifera, and Allophylus bullatus, (Mbenkum 1999) (Table 3.4). A large part of the plateau stretching from Sabga through Oku to Jakiri is covered by “prairie” vegetation. This makes this area one of the main valuable grazing lands in Cameroon. On the low plateaus or piedmonts about (1,500-1,000 meters), remnants of humid forests still occur and are protected in some areas as sacred places for traditional sacrifices typically found around the Fon’s5 palaces in Bamunka, Babungo, Bamessing and Bafanji (Ngwa, 1985; Ndzeidze, 2004). Excessive human intervention through bush fires, intensive cultivation and grazing has transformed most of these low plateaus into tree and grass savanna vegetation. Many herbaceous strata and arboreal plants make up this vegetation (Table 5
“Fon” is the title of the ruler of an ethnic group. Commonly used in the western grasslands of Cameroon.
29
3.4 and Figure 3.7) (Mbenkum, 1999). Settlement units and mixed subsistence crop cultivation areas constitute enclosures6 and openfields7. Also afforestation with eucalyptus, coffee plantations, raffia palm bushes and fruit trees provides shade and fences against the prevailing winds around enclosures and openfields, and thereby protect the watershed.
Figure 3.7 Vegetation distribution in the Upper Noun drainage basin 6
Enclosures are settlement units belonging to a particular family or community with less than ten settlements clustered together and surrounded by farmlands or grazing areas usually fenced. This is common in the western highlands of Cameroon because of the land tenure system whereby particular portions of land belong to certain families. Enclosures grow to villages with time (Tchindjang, 1996; Gautier,1994; Tchawa, 1991) 7 Openfields are smaller settlement units usually isolated with one or two houses surrounded by grazing areas and farmlands. They occur closely with enclosures in the western highlands of Cameroon and grow to enclosures as the family grows larger with time (Tchindjang, 1996; Gautier, 1994; Tchawa, 1991).
30
The humid part of the basin makes up the low lying zone (below 1,000-900 meters). Gallery forests along the narrow inland valleys are principally raffia palms and montane forest (Table 3.4). Seasonally flooded swamp forest of semi montane forest, Sudano-guinean shrubs and tree savanna dominates in Noun swamps and marshes, near Monoun, Babungo and Babessi. Part of this forest remains permanently flooded and swampy during the dry season. Table 3.4. Altitudinal zonation of vegetation in the Upper Noun drainage basin Zones Plant species Location land cover and land use types High plateau above 1,500 m Made partly of upland grazing and farmlands
Low plateaus or piedmonts about 1,500-1,000 meters. Intensive cultivation and grazing dominated with open fields and enclosures around settlements. Humid low lying zone (below 1,000900 meters). Farmlands and grazing especially transhumance, with irrigation and growth of settlements.
Montane forest dominated by Symphonia globulifera,Strombosia scheffleri, Piptadeniastrum africanum, Tabrnaemontana spp., Zanthoxylum rubescens and Garcinia sp, Podocarpus latifolius, Prunus africana, Rapanea melanophloeo, Albizia gumnifera, Allophylus bullatus, Pygeum africanum, and Syzgium guineense. Rich pasture includes: grass associations of Hyparrhenia spp, Sporobolus africanus, Pennisetum clandestinum and Paspalum spp Relics of humid forests, grass savanna vegetation made of Pennisetum purpurum and Andropogon gayanus with aboreal strata comprised of Terminalia glaucescens, Nauclea latifolia and Hymenocardia. Semi montane forest and montane forest on inland valleys intermixed with sudano guinean shrubs (Daniella oliveri and Lophira lanceolata, Albizia gummifera, Allophyllus bullatus, Pygacum africanum, Syzgium guineense, Schefflera abysinica, and Gaguza rubescens.
Plateau stretches from Sabga through Oku to Jakiri
Seasonally flooded swamp forest of semi montane forest, Sudano-guinean shrubs and tree savanna dominated by Raphia mambillensis, Ficus trichopoda, Mitragyana stipulosa, Phoenic reclinata, Albizzia glaberrima, Cleistopholis patens, Vitex cienkowskii, Mitragyna stipulosa and Uapaca topoensis. Herbaceous strata consist of Aframomu spp, Brillantaisia spp, Pilisota spp. Seasonally flooded prairie dominated by Pennisetum purpureum, Andropogon spp Coecorhachis afraurita, Hyparrhenia spp like Hirufa H. diplandra, H. bracteata, H. mutica, Loudetia phragmitoides, Schizachy phacelata, var sericea. Herbs include Biophytum petersianum, Borreria scabra, Eulophia spp, Impatiens, Ivving, Laparis Nervosa,
Titayavkov in Ber and Bangolan, Mbashie, Lower Bamunka Bambalang Babungo, Bamessing and Bafanji,
Part of the Plateau that stretches from Sabga through Oku to Jakiri at this altitude.
31
Pteridium aquilinum, Brachiaria ruzizien. Hydrophyte species are permanently flooded, dominated by Cyperus giganteus, Digitaria abyssinia and Echinochloa crusparonis
Source: compiled from Asanga, 2002, Mbenkum 1999 Seasonally flooded prairies dominated by Pennisetum purpureum are found on flat alluvial soils. These soils are flooded when rivers overflow their banks in the rainy season (July-October). Grasses with herbs and sedge vegetation constitute the principal vegetation cover (Mbenkum, et al 1997; Ndzeidze, 2001). Aquatic vegetation of various hydrophytic species (Table 3.4) is sustained on marshes and bog soils which for most parts of the year are not affected by fire due to their permanently flooded nature. Forest exploitation is mostly for cooking, generating heat for drying of grains, smoking of fish, and carving of drums and xylophones, masks and other handmade artifacts. Such wood is mostly from the sudano gallery forest and tree savanna (Table 3.4). In some villages, such as Ber and Wasi, wood constitutes more than 98 % of the household cooking and heating fuel, while gas, cow dung and kerosene make up 2 % (Ndzeidze, 2001). Some timber is still being exploited by local loggers for construction from patches of natural forest in the plain and the surrounding gallery forest on the hill slopes and inland valleys. Swamp forest is exploited during the dry season from Titayavkov in Ber and Bangolan, Mbashie, Lower Bamunka and Bambalang (Ngang, 1997; Ndzeidze, 2004). 3.2
Human background of the Upper Noun drainage basin The Upper Noun basin is inhabited by diverse populations that settled around the
wetlands, mainly the Tikar and Bamelike ethnic groups that inhabit the western grass lands of Cameroon. The Tikars sub-group of Bamoum and Nso inhabit the eastern and
32
southeastern portions of the basin. The Bamileke and many other groups are located further to the west of the plateau. The rich environment with abundant wetland resources and fertile agropastoral landscape has fostered relatively larger concentrations of population compared to areas surrounding the basin and it remains the main centre of attraction for these diverse populations. The location of wetlands and ethnic groups accounts for the population distribution and the settlement patterns within the basin, in which there is a correlation between ethnic groups and settlement pattern. A concentric pattern of diverse ethnic groups around the wetland area describes the network of settlement around the wetland area and its environs. The argument is that “diverse ethnic population concentrates around the wetland area and reduces in number of groupings and density as one moves away from the wetland area and the drainage basin” (Ndzeidze, 2004). This concentration suggests the role played by wetlands to attract these ethnic groups to the drainage basin (Figure 3.8). Although diverse, the human population has similar ethnic roots that include up to 21 autonomous strong centralized traditional political chiefdoms that practice direct rule over their subjects. Population movements in the Central Cameroon highlands, according to Ngwa (1985), are explained in detail in oral history describing the foundation of each dynasty or chiefdom. The Bantu people entered Cameroon from northern Nigeria in 200 to 100 BC and were traditionally agricultural, requiring lots of space for farmland (Cameroon Timeline, 2008). Very little is documented about their movement south to Upper Noun, but tribal wars and famine are the major documented causes of early migration (Mzeka, 1980).
33
Figure 3.8 Concentric model of the settlement pattern of ethnic communities around the wetlands in the Upper Noun drainage basin Source: Ndzeidze 2004
When the Portuguese occupied Cameroon in 1472 and set up plantations by 1520, two main factors determined population movement and to an extent the settlement - slave trade and pastoral nomads immigrating from Nigeria were pushing the indigenous people southward (Chilver and Kaberry, 1965; Cameroon Timeline, 2008). When the Dutch took over the slave trade in Cameroon in the 1600’s many people were taken from this region to the plantations in the south west and this significantly reduced the active population. Ethnic wars remained pronounced and presented a major challenge to Europeans. In 1885, when Baron von Soden became governor of the new German colony, called "Kamerun”, his major task was reconciling fighting rebellious tribes inside the country (Austen, 1996; Cameroon Timeline, 2008). In the Upper Noun basin the Germans built a ranch and their residence in Jakiri, in 1909 after the Nso-German war of 1906 (Fanso and
34
Chem-Langhee, 1996; Mzeka, 1980). During the German Cameroon period, in the late 19th century, population movements within the drainage basin were determined by pressure from Fulani herders from the north and the increasingly stronger chiefdoms of the Bamoum, Kom and Nso (Chilver and Kaberry, 1965). These strong centralized traditional political economies were referred to as “floating populations,” because they were not permanently settled due to ethnic wars (Chilver and Kaberry 1967). Most of these ethnic groups finally moved to specific regions further south to form villages or chiefdoms after the Germans forcefully put an end to ethnic division (Chilver and Kaberry 1968). Such settling down was usually around a strong leader, the Fons, or alternatively they consolidated themselves under powerful groups that could defend themselves from neighboring aggression due to disputes over land occupancy. The increasing realization of a wetland rich in biodiversity and the quest for fertile farming areas triggered this wave of floodplain occupation, especially as the slave trade was already abolished in Cameroon on 10 June, 1840 (Cameroon History - 2004) and most ethnic groups were permanently settled. The first Tikar to descend to the basin were among those who established the highly centralized villages of the area today (Ngwa, 1985). Ngwa (1985) identified three such descending waves. The first is the Tikar wave that led to the founding of Bafanji, Bamessing, Bamali and Babessi. The second led to the establishment of the autonomous villages of Bambalang, Bamunka and Bamukumbit. The third wave, not Tikar, however, is the most recent and include the Hausas who came in and settled in Sabga and Bamali in 1916. Ngoketunjia division alone has 13 different chiefdoms of Tikar ethnic sub-groupings and includes Bangolan, Babessi, Baba, Babungo, Bamunka, Bamessing, Balikumbat, Bambalang, Bafanji,
35
Bamukumbit, Bali Ghansi, Bali Gashu, Bangouren, and Bangola (Figure 3.8b). Ethnic wars were more frequent around the wetland area (flood plain) than in the surrounding highlands, according to tribal oral history. 3.2.1
Settlement pattern in the Upper Noun drainage basin and the wetlands The major settlements in the drainage basin, especially within the flood plain, are
contained around ethnic groups. This ethnic-affiliated settlement pattern is common among the 13 different ethnic groups that make up Ngoketunjia division or Ndop. Bamunka (Ndop town), the divisional capital is the major settlement. Further to the south east of the plain are Njitapon, Njingoumbe, Bamendjin west and east (Ndzeidze, 2004). On the north west of the basin slopes are Babanki Tungo and Sabga that constitute other clusters (Figure 3.4). Table 3.5. Population distribution in the drainage basin Division Ngoketunjia
Bui Noun Bamboutos Mezam
Total
Area Babessi Balikumbat Ndop Jakiri (Dzekwa) Njitapon Njingoumbe Bamendjin Sabga Babanki Tungo
Urban pop 3 780 4 262 22 950
30 992
Source: UNVDA and MINEPIA Ndop 2004
Rural pop 3 5 903 31 130 41 071 18 802
Total 39 683 35 392 64 021 18 802
4 400 4 600 2 400 15 500 14 200
4 400 4 600 2 400 15 500 14 200
165 606
196 598
36
On the gentle slopes of Dzekwa, the Jakiri region overlooks the plain and constitutes one of the major settlements in the drainage basin. Jakiri town and Wainamah are the major clusters. The Upper Noun Basin has a population density of approximately 70 persons per square kilometer. The Ngoketunjia division alone has a density of about 120 persons per square kilometer. The study area is under the administration of six divisions and two provinces, namely: Ngoketunjia, Mezam, Bui, and Boyo (in the northwest), while Bamboutous and Noun are in the west province (Figure 1.1b). 3.2.2
Land tenure systems in the drainage basin and the wetlands Generally, land tenure systems in the floodplain and the drainage basin as a whole
operate like others in the grassfields of Bamenda (Chilver and Kaberry, 1968). Land acquisition and ownership is under centralized traditional ethnic political systems. The Fons are the overall landlords and have titular claim to all the land. However, for the purpose of land administration the land rights are vested on traditional notables who themselves are lineage heads. These rights include the rights of giving land to citizens wishing to obtain farmland. The land tenure system has undergone radical modification due to penetration of a cash economy plus land scarcity among ethnic communities in the drainage basin. Systematically land is being sold and bought in opposition to the rules guiding its acquisition. That is, land is to be handed down from one generation to another by these traditional notables and family heads. Traditional ownership of land included the swamps and marshes. However, following the introduction of swamp rice cultivation all the swamps and marshes were
37
decreed to be state land. This resolved land disputes that often resulted in tribal conflicts. Swamps are now state property and in principle can be legally exploited by anybody especially for wet rice cultivation, fishing, hunting and grazing. Exploitation requires authorization, especially rice cultivation under directives from the UNVDA, fishing permits from Department of Fisheries under the Ministry of Livestock Fisheries and Animal Husbandry, hunting from the Ministry of Environment and Nature Protection, and forest exploitation from the Ministry of Wildlife and Forestry. Very few people possess permits on the grounds that they were displaced following the creation of the Bamendjin dam and so they claim unconditional rights to products associated with the dam’s water regime, especially fish harvesting (Ndzeidze, 2004). This is typical of the reservoir shore settlements of Bambalang and Bangolan where a majority of the fishermen and women are not registered (Ndzeidze, 2004). 3.2.3
Agricultural systems in the Upper Noun drainage basin and the wetlands Agriculture is the main human activity in the drainage basin and involves more
than 85% of the total population (Ndzeidze, 2004). The physical factors such volcanic soils, rich alluvial deposits, swamps and marshes, and the low elevation, makes Upper Noun floodplain the main fertile and farming area in the western high plateau. Other associated factors such as land development for swamp rice irrigation, and land tenure systems largely influence the cultivation and production of subsistence related crops. Such crops are grown as important staples and include maize, cocoyam, beans, cassava, yams, groundnut and vegetables (Table 3.6). Rice is the main cash crop cultivated through irrigation.
38
Table 3.6.Crops and periods introduce in study area. Precolonial crops 1750 - 1900 Crops Cereals
Root crops
Vegetables
Spice
Fruits
Cash crops
Local names
Scientific names
Finger millet Sorgum Maize Cowpeas Cassava Yams Cocoyams Local carrot Bambara groundnut Groundnuts Huckle Berry Floated pumpkin Garden eggs Cowpeas Fresh colocasia Only small red pepper
Eleusine coracana Sorghum vulgare Zea mays Vigna unguiculata Manihot utilissima Dioscorea cayenensis Colocasia antiquorum “Long” in local language (Nso) Voandzeia subterranea Arachis hypogaea Solamum nigrum Cucurbita pepo Solanum melongena (as vegetable) vigna unguiculata colocasia esculenta (as vegetable) Capsicum frutescens
Banana Plantains Sugar cane
Musa sapientum Musa paradisiaca Saccharum officinarum
Kola nuts Tobacco Raphia palm
Cola nitida Nicotiana tabacum Raphia spp
Colonial period and improved species 1900-1960 Cereal Maize Beans – black, white, and spotted beans, Root crop Fruits
Phaseolus vulgaris from Germany
Soya bean (Glycine max) Cocoyams Yams and cassava Banana Post colonial crops 1960 - present
Root crops
Fruits
Sweet potatoes Irish potatoes Oranges Avocado Guava Pineapples Beetroots Mango
Ipomoea batatas Solanum tuberosum Citrus sinensis Persia americana Psidium guajava Ananas comosus Beta vulgaris Mangifera indica
39
Vegetables
Cash crop
Tomatoes Cabbage Garden egg Carrot Leaks Shallot Celery Hot pepper Lettuce Arabica coffee Rice Tobacco Cocoa Oil palm Robusta coffee
Lycopersicon esculentum Brassica oleracea As vegetable Daucus carota Allium porrum Allium cepa Apium graveolens Capsicum annum Lactuca sativa Coffea arabica Oryza sativa Nicotiana tabacum Theobroma cacao Elaeis guineensis Coffea canephora
Vegetables are cultivated throughout the year in some drained marshes around Bamessing fishery station, lower Bamumka swamps and Babessi (Ngwa 2000, Ngang 1997). Irrigation has made possible the intensive cultivation of vegetables, especially huckleberry, okra and garden eggs in the dry season and these are sold to major urban areas of Cameroon such as Bamenda, Douala and Yaounde (Ndzeidze 2004). The economic crisis that struck Africa in the 1980s leading to devaluation of currencies (in the 1990s) accompanied by salary reductions led to an upsurge of civil servants and military men taking up farming as an alternative in the plain. This was further compounded by Structural Adjustment Program that led to laying off civil servants through voluntary retirement and privatization of state owned cooperations in the mid 1990s (Kengne and Georges, 2000; Minter, 1998). Land acquisition has been made competitive and expensive per hectare in some areas like Bamunka, Ber, Wasi, Bangolan and Babessi (Ndzeidze, 2004). Table 3.7 describes the agricultural calendar showing how some of the crop cultivation and harvesting is done in the plain. Apart from vegetables, fruits are widely grown in the plain with mangoes, guava and oranges being the primary income generating fruits. These fruits grow together in
40
intercrop farms of maize and coffee or around houses as shelters or fences surrounding houses and livestock rearing areas like piggeries and poultry yards. Sugar cane that was formerly a dominant income-generating crop has suffered a setback because of an increase in transhumance activities resulting in cattle feeding on the canes (Ndzeidze, 2001; Ngwa, 2000). Plantains, bananas and avocados can equally be seen intermixed with other crops in farmlands around households and plays the role protecting against strong prevailing winds and shelters against the hot, dry season temperatures. Farmlands have recently been extended to the hill slopes and the catchment areas that overlook the drainage basin. Areas with larger population densities such as the Jakiri slopes are intensively cultivated with no fallow period and for a very short duration of four to five years of high productivity and then abandoned due to heavy erosion. Land scarcity around this region largely accounts for intensive cultivation with no fallow periods. Such areas on the north eastern slopes of the basin are Ntohti, Wainamah and Sarkong, immediately above and below (respectively) the escarpment that overlooks the Babessi. Table 3.7. Agricultural calendar of some crops in the Drainage Basin Crops
Planting
Weeding
Harvesting Approximate
Rainy season Beans Dry season Beans Maize Peanuts
March-April Sept-Oct March-April March-April
May –June Oct-Nov May-June June-July
July –Aug Jan-Feb Aug- Sept Aug – Oct
4 months 5 months 5 months 5 months
Yams
Jan-Feb
April-May
Nov- Dec
11 months
Coco yams Rice
April- May July- Aug
July- Aug Sept-Oct
Nov-Dec Dec-Jan
7 months 5 months
41
3.2.4
UNVDA, land development for swamp rice cultivation and the wetlands Swamp rice cultivation accounts for one of the major land development projects
in the floodplain that transformed the wetlands through draining to prepare it for irrigation. Rice cultivation spread through the villages of the Upper Noun Valley in the 1970s under the BPDA (Bureau de Production et Developpement d’Agriculture). This was mostly on an experimental basis between 1970 and 1975 in the villages of Bamessing, lower Bamunka and Babungo, Baba 1, Babessi, Bangolan, Wasi and Ber as upland rain-fed cultivation. This method of cultivation failed because of severe droughts that affected the entire country and Sub Saharan Africa (Wirngo, 1989). As a consequence of this failure, irrigated swamp rice was introduced with supervision from the department of agriculture and the Upper Noun Valley Development Authority (UNVDA) in 1979. The UNVDA was created and established in Ndop by Presidential Decree Number 70/DF/579 of 29th October 1970. This decree transformed the then BPDA (1967-70), a crop research institute that introduced rice cultivation in the Ndop plain, into UNVDA. In preparing the plain for rice cultivation, the plots were first cleared in the dry season and burnt. Then a demarcated plot of 1,000 m2 was pegged into 5 subplots of 20 by 10 meters, or subplots of specific dimensions were created where the land area was less than 1,000 m2. Canals were then dug by hand, to channel water to the fields (Ndzeidze, 2001). The major problem here was the extensive nature of the swamps that limited farm extension, especially around the Monoun region, because of floods and poor management of the canals that were communally constructed. Canal blockages by alluvial deposits of mud and sand were common around Babungo, Babessi and Ber. The
42
change from upland rice cultivation to irrigated swamp rice, however, offered more opportunities for expanded productivity, stimulating migration into the plain from many parts of the grassfields (Ndzeidze, 2001). The Chinese Aid Mission and French Cooperation in Cameroon trained rice farmers on basic irrigation techniques (Ngwa, 1979). Rice proved to be more productive and profitable than maize, beans and coffee. Thus a major land development activity in the Upper Noun was the conversion of the swamps and marshes to prepare the area for paddy rice irrigation in the wetlands. This land development and mass movement of people into the plain led to more swamp drainage by UNVDA. Later, the Presidential Decree Number 78/157 of 11th May 1978 transformed the UNVDA into a public corporation, with the monopoly of buying paddy rice in its zone of activities, and also it was given authority over all the swamps and marshes in the Upper Noun Valley. The floodplain swampy and marshy zones were consequently decreed state land (MINAGRI, 1984). The UNVDA operated in two provinces, West and North West, involving at the time five divisions, Bamboutos, Noun, Bui and Mezam and later Ngoketunjia (Figure 3.5) (Ndop plain). About 3000 ha of wetland were developed in Ndop plain, for about 6000 farmers. The cost of the project was estimated at 1.76 billion FCFA (French Currency in Africa), sponsored by the government of Cameroon (MINAGRI, 1984:1). The UNVDA zone of action was demarcated to involve the whole of the Upper Noun Valley drainage basin. This necessitated rough tilling in preparation of the swamps and marshes into suitable rice fields. The plain was divided into five extensive zones of action: Monoun, Bangolan, Babungo, lower Bamunka and Upper Bamunka (Table 3.8 and Figure 3.9). Figure 3.9 shows the distribution of irrigated areas and the rice plots
43
observed and classified from the 2002 satellite image. Table 3.8. UNVDA 5 zones of action Zone Areas 1 Monoun Ber, Mapot, Koutoupit 2 Bangolan Bangolan, Wasi, Mambin 3 Babungo Babungo, Mbunkung; Baba 1 4 Lower Bamunka Palace road, Mbansale, 5 Upper Bamunka Mile 25, Bamessing, Balikumbat, Source: Ndzeidze 2004
44
Rice plots located from table 3.8
Figure 3.9 The distribution of rice plots in the irrigated areas of the Upper Noun drainage basin
45
3.2.5
Grazing, transhumance and the wetlands in the Upper Noun drainage basin Grazing as one of the main activities in the drainage basin has greatly transformed
the agrarian landscape both in high elevations and in the floodplain. Transhumance as a recent land use practice in the Ndop flood plain began in 1916 following the introduction of cattle in the Bamenda grass fields by “Ardo” Sabga (Ardo is the title of a Fulani ruler). Attracted by the good highland pasture and the floodplain and river valleys for dry season grazing, the Fulani chief settled on the high granitic mountains in the northwest part of the drainage basin with about 10,000 cattle. This area was later called Sabga (Ngwa, 1979). Because of the rich flood plain, other Fulani with their cattle came in successive waves from Nigeria and the Adamawa plateau to the Bamenda highlands, targeting the flood plain for transhumance. This mass movement also provoked the Aku’s (sub group of the Fulani’s) immigration in the 1950s. Their movement came through the Nigeria section of the Adamawa into the Menchum Division and entered the plain through the border between Bui and Menchum. Here they settled at the Mbokam, Vekovi, Jakiri and Tan grazing areas overlooking the plain. During transhumance the Ndop flood plain receives about 30,000 cattle (Ngwa, C. 2003). The Ber, Wasi and Bangolan area receives close to 12,000 cattle (Ndzeidze 2001) while Babungo, Bamunka, Bamessing and Bafanji receive some 8,000 to 10,000 cattle (MINEPIA, Ndop, 2002). Before the construction of the Bamendjin dam, and the subsequent development of UNVDA rice fields, the Ndop plain had a total pasturage of 30,000 hectares on which 50,000 cattle grazed. This has been drastically reduced to about 10,000 hectares by the ever expanding lake of the Bamendjin dam. These cattle move
46
downstream to the riverbank and the swamp and marshes fringes where pasture is available all over the plain. During the dry season, especially when the hydromorphic soils of the floodplain start drying up, the high grass vegetation is grazed by cattle. In the Ndop plain transhumance zone a total of 104 (Table 3.10) herders were registered with 9,498 cattle in 2002 (Ndzeidze 2004). Herders in the basin have specific areas where they keep and move their herds as shown in table 3.9 and figure 3.10. Table 3.9. Transhumance in the Upper Noun drainage basin Grazing zone
Origin of animals (rainy season grazing zone) Jakiri Ibal-oku Oku Ngemsibaa Belo Vekovi
During Dry Season in the floodplain
Tan Kutupit Mbokam Bangorain Sabga Awing Bamenyam Bamukumbit Babungo Bamessing Bamunka Galim Santa
Total
No of herders
No of cattle
Place of transhumance (dry season grazing zone)
4 4 4 1 3 1 1 7 1 6 1 1 1 6 4 5 4 3 3 3 22 8 06 05 104
107 375 850 32 75 24 20 840 150 257 80 90 90 1150 330 750 150 750 720 300 1825 206 190 362 9723
Babungo Bamunka Bambalang Babungo Babungo Babungo Babungo Bangolan, Wasi Babessi Bangolan, Ber Ber, Wasi Ber, Wasi Ber, Wasi Bambalang Bamunka Bambalang Bamali Bambalang Bambalang Baba Bamali Bamunka Balikumbat Balikumbat
Source: Divisional Delegation of MINEPIA Ngoketunjia (2003) and Jakiri Sub Divisional Delegation of MINEPIA (2003).
There are two particularly abundant and high quality species of fodder, Pennisetum purpureum and Brachiaria vizizien. Hyparrhenia spp and Imperata
47
cylindrica are of low quality. Cattle depend on rice stabble after harvest but because of conflicts between farmers and herders some farmers are now burning the straw after harvest in protest, thereby reducing the pasturage highly needed by herders from January to March (Ndzeidze 2001, Ngang 1997). Cattle also feed on re-germinating shoots of rice after harvest. Farmer-herder conflicts are pronounced in places like Ber, Balikumbat, Bafanji and Babessi and are less intense in Bamunka and Babungo because of amicable resolutions by the traditional council (Ndzeidze 2004). The plain, however, is a mixed farming zone as defined by the MINEPIA and MINAGRI, i.e. where transhumance is carried out alongside dry season farming.
48
Figure 3.10 Cattle movement in the Upper Noun drainage basin during transhumance Source: Sushuu, 2007 and table 3.10 3.3
Conclusion This chapter explains the historical and contemporary physical and human
constituents of the upper Noun Drainage basin and the wetlands. The physical realities of
49
the basin largely determine the land cover and to a greater extent the land use practices. The altitudinal variation from the floodplain (900 m) to above 3,000m at the Mount Oku shows a corresponding variation in land use from floodplain swamp rice cultivation to upland grazing on the hillslopes that make up the drainage basin. The importance of this ecological variation has over the years influenced greatly the changes in the agrarian landscape such as swamp rice irrigation, reservoir construction and human population increase. This background information is very important for this change detection study.
50
4 4.1
Methodology Data collection Ten Landsat scenes (Table 4.1) from 1973 to 2007 were purchased from the
United States Geological Survey (USGS). The Upper Noun Drainage basin requires one Landsat scene to fully cover the geographical extent; this scene is orbital Path-200/Row56 for MSS, and Path-186/Row-56 for TM and ETM+ (Table 4.1). The image acquisition dates were selected to correspond as much as possible to both the dry season and the rainy season in one year. This is because the agropastoral activities are more discernable in the drainage basin as they change with seasons. However, this seasonal variation in land use and land cover introduced the uncertainty of some classes being likely misclassified. The classes in question were vegetation, grazing, and agricultural fields. In some cases these classes were overestimated for the rainy season compared to the dry season because of reflectance differences and variation in land cover. Consequently, the two seasons were considered separately to compare the changes across years.
Table 4.1. The acquisition dates, orbital Path/Row and the Landsat sensor data used in the analysis. Landsat sensor MSS MSS TM TM TM ETM ETM
Rainy Season Landsat scenes/Date acquired
Dry season Landsat scenes/Date acquired 1973-02-01
1978-11-17 1984-11-29 2001-11 2002-11-07 2006-11-18
1988-02-02 2002-02-19 2003-01-05 2007-02-06
Path/Row
200/56 200/56 186/56 186/56 186/56 186/56 186/56
51
Topographic maps of the Upper Noun drainage basin were acquired from the SRTM (Shuttle Rader Topography Mission) and DEM (Digital Elevation Model) GeoTIFF data from the USGS/University of Maryland Global Land Cover Facility from WRS2 (World Reference System) Tiles orbital Path 186 and Row 056. The Cameroon data for habitats, roads and hydrology were acquired from Global Forest Watch and were projected to WGS 1984 UTM (Universal Traverse Mercator) Zone 32N coordinate system to overlay on the DEM and SRTM. With respect to the hydrographic pattern, this enabled the accurate delimitation of the drainage basin. The soils data were obtained from Food and Agriculture Organization (Hawkin and Brunt, 1967). 4.2
Data processing Data were processed using ENVI 4.2, Erdas Imagine 8.9, ArcGIS 9.2 (ESRI,
2007), Microsoft Office Excel, and Adobe Illustrator. ENVI was used to classify the land cover and land use for the different Landsat images. First the Landsat scenes were loaded into ENVI and spatially subsetted to eliminate areas outside the study area. The raw digital numbers (DN) of each Landsat scene were converted to radiance values. The equation to convert digital numbers (DN) back to at-satellite spectral radiance units was:
Radiance = (((LMAX-LMIN)/(QCALMAX-QCALMIN))*(QCAL-QCALMIN)+LMIN)) where QCALMIN=1(Level 1 Product Generation System (LPGS) product), QCALMAX=255, and QCAL=DN. The LMINs and LMAXs were the spectral radiances for each band at DN 1 and 255 (i.e. QCALMIN, QCALMAX). These values were obtained from the Landsat website.
52
The radiance digital numbers were converted to exoatmospheric reflectance (top of the atmosphere (TOA) reflectance) using the equation:
where ρp= unitless planetary reflectance, Lλ = spectral radiance at the sensor's aperture, d = Earth–Sun distance in astronomical units, ESUNλ = mean solar exoatmospheric irradiances and θS = solar zenith angle in degrees. The goal of radiometric correction is to remove or compensate for all of the above effects except for actual changes in ground target to retrieve surface reflectance (absolute correction) or to normalize the digital counts obtained under the different conditions so that they are on a common scale (relative correction). Finally combined surface and atmospheric reflectance of the Earth was to compute atmospheric correction using the dark pixel subtract method (Chavez, 1988). The scenes were then processed through ENVI Supervised Maximum Likelihood Classification algorithm using bands 2, 3 and 4. These bands were chosen because band 2 (green) spans the region between the blue and red chlorophyll absorption bands and detect the green reflectance of healthy vegetation. Band 3 (red) is the chlorophyll absorption band of healthy green vegetation and is useful for vegetation discrimination. It also can exhibit more contrast than bands 1 and 2 because of the reduced effect of atmospheric attenuation (Jensen, 2005), and thus supports the analysis of land use and vegetation characteristics. Band 4 (near-infrared) is very responsive to the amount of vegetation biomass present and especially to land and water contrast.
53
The supervised maximum likelihood classification was chosen and is particularly important for this study because it identifies and locates land cover types that are known a priori through a combination of personal experience, interpretation of aerial photography, map analysis and fieldwork (Jensen, 2005). The supervised maximum likelihood algorithm is also the most widely use supervised classification algorithm. The maximum likelihood decision method is based on probability. Other classifiers are primarily based on identifying decision boundaries in feature space using training class multispectral distance measurements (Jensen, 2005). The maximum likelihood algorithm assigns each pixel having pattern measurements features X to the class i (i . X) whose units are most probable or likely to have given rise to feature vector X (Jensen, 2005). The probability that the pixel belonging to each predefined set of X classes is calculated and the pixel is then assigned to the class for which the probability is highest (Jensen, 2005). Using the Region of Interest tool (ROI) the classes (the training sets of pixels), were selected based on observed land cover classes combined with the author’s knowledge of the Upper Noun drainage basin and visible combinations of Landsat bands 2, 3 and 4. Specific land use and land cover sites were located in the remotely sensed data that represented homogeneous observed class types. Every selected pixel both within and outside the training sites was evaluated and assigned to the class where it had the highest likelihood of being a member. The maximum likelihood method introduced the uncertainty of exaggerating certain classes such as settlements. Each class’s identification was also complicated by seasonal variation and cloud cover; these factors introduce pronounced uncertainties in the digital image processing.
54
The technical failure problem of the Scan Line Corrector (SLC) in Landsat 7 that resulted in image geometric error presented another challenge. The Landsat 7 ETM+ sensor was launched on April 15, 1999 with a design life of five years. Landsat 7 ETM+ has been orbiting for more than eight years. The SCL compensates for the forward motion of the satellite and efforts to recover the damaged SCL were not successful (Jensen, 2005). Landsat 7 has suffered from an SLC malfunction since May 31, 2003, and is marginally capable of acquiring global coverage in a timely manner, thus resulting in SLC-off data. Landsat 7 ETM+ SLC-off data has been difficult to use due to this hardware failure that has resulted in 22 percent of the data missing from each scene. The Landsat project has developed several products that can minimize the gaps. The most popular is the “off-to-off” product that takes two (or more) ETM+ scenes, radiometrically matches them, and then combines them for more complete coverage. Users can combine their own scenes, however, in this study none of these methods could be used because a change detection study requires a very closely dated scene to fill the gaps in order to have a higher degree of precision. Thus the images were digitally processed with the SLC-off data and the land use and land cover classes that were classified in the lines were excluded from the data analysis. Classes identified within the drainage basin are in table 4.2. The criteria for the selection of the pixels for the classes are also described in table 4.2 and figure 4.1 below. Figure 4.1 shows the land cover and land use classes for the Ndop floodplain and their selection criteria.
55
Permanently flooded Prairie Irrigated farmlands Major settlement Mixed farming areas
Reservoir Swamp forest
Seasonally flooded prairie Irrigated farmlands Siltation
Figure 4.1 Examples of the selection of land use and land cover classes within the floodplain. The Ndop floodplain shown from a combination of Band 2 (green), Band 3 (red) and Band 4 (near-infrared) in the image from the February, 02, 2002 dry season
56
Table 4.2. Land use and land cover classes, and spectral signatures identified in the Upper Noun drainage basin Identified land use and land cover
Ndop Floodplain Lake 1973 dry season image
Spectral composition selection criteria for the pixels judging from the spectral profile, other studies and personal field experience Lake waters were clearly distinctive and location was confirmed and identified from past maps (Hawkins and Brunt, 1965).
Grazing area intermixed with sudano shrubs - 1973 dry season image
Distinctive vegetation was observed in 1973 and confirmed from past maps (Hawkins and Brunt, 1967)
Reservoir Landsat 2002 dry season image
Water distinctive from the satellite images and confirmed from maps showing a clear delimitation between the water body and land. Distinctive at the mouth of major rivers into the reservoir. Major rivers are determined from the overlay in ArcGIS Higher reflection in bands 4 location was identified from past maps (Hawkins and Brunt, 1967) personal field experience of the study area.
Silt deposits Landsat 2002 dry season image Permanently flooded prairie
Seasonally flooded prairie
Occur close to permanently flooded areas and were determined from their medium reddish color and from past maps
Composite color (RGB) observed that distinguish the classes from screen Water was viewed dark in the R(b3) G(b2) B (b1) combination. The MSS average spectral band range between R:0, G:14, B:15 The RGB (R(b3) G(b2) B (b1)) combination distinguished this vegetation class with light green intermixed with light red, located particularly on the Sabga region, Jakiri/Tan grazing zones - R:140 G:153 B:73 R (b4) G (b3) B (b2) combination on the screen is R:0, G:29, B:54
R (b4) G (b3) B (b2) combination on the screen is R:0, G:97, B:146 and looks more blue Looks medium reddish with an RGB screen combination of R:245, G:102, B:164 (Landsat 2002) and R:159, G:127, B:136 (Landsat 1973). Looks low reddish with screen RGB combination of R: 119, G: 175, B: 192 (Landsat 2002) and R:
57
Swamp forest
Semi montane forest
Montane forest
Upland grazing areas
Mixed farming areas
Irrigated farmlands
(Hawkins and Brunt, 1967) compounded by past field experience (Ndzeidze, 2001 and 2004). Was also determined from past maps (Hawkins and Brunt, 1967) compounded by past field experience (Ndzeidze, 2001 and 2004) and its floodplain location.
Was also determined from past maps (Hawkins and Brunt, 1967) compounded by past field experience (Ndzeidze, 2001 and 2004). Surrounds montane forest on high elevation. Elevation determined from ArcGIS analysis. Determined from past maps (Hawkins and Brunt, 1965) Located at the highest elevation. Elevation was determined from ArcGIS analysis.
126, G:98, B:73 (Landsat 1973).
Looks deep red and high reflection in bands 4 in the spectral profile and with a screen RGB combination of R:230, G:27, B:73 (Landsat 2002) and R:158, G:61, B:73 (Landsat 1973). Reflects medium reddish and looks less dense with a screen RGB combination of R: 203, G:24, B:36 (Landsat 2002) and R:139, G:42, B:25 (Landsat 1973)..
Reflects deep red on hill summits with a screen RGB combination of R: 255, G: 24, B:45 (Landsat 2002) and R:159, G:23, B:54 (Landsat-1973).. Found at fringes of semi montane Looks low reddish forest on hillslopes and was intermixed with light determined from past maps green with a screen RGB (Hawkins and Brunt, 1967), and combination of R:140, by past field experience G:118, B:136 (Landsat (Ndzeidze, 2001 and 2004). 2002) and R:105, G:108, B:93 (Landsat1973).. With very little vegetation cover Looks more green and on the hillslopes and floodplain, with a screen RGB and was determined from past combination of R:77, field experience (Ndzeidze, 2001 G:107, B:136 (Landsat and 2004). 2002) and R:61, G:108, B:63 (Landsat1973).. Were determined from Ngwa Looked whitish and could (1985) and by past field be confused with experience (Ndzeidze, 2001 and settlement but distinctive 2004) that could determine the in RGB composition. The rice plots and their location. screen RGB combination of R:235, G:255, B:255
58
Settlements with enclosures and openfields
Major settlements
Isolated groups of houses determined from field experience and background knowledge of the study area especially the past field experience (Ndzeidze, 2001 and 2004). Location largely determined by past field experience (Ndzeidze, 2001 and 2004) and ArcGIS. ArcGIS enable easy location of major settlement when the base data for settlement was overlaid on Landsat images
(Landsat 2002) Looks whitish and a screen RGB combination of R:235, G:113, B:109 (Landsat 2002)
Settlements appear whitish in RGB combination with screen values as R: 219, G: 255, B:255 (Landsat 2002).
Cloud cover presented a challenge with the classification and was readily identified as a separate class during the classification process. Spatiotemporally, the classes identified have also varied from 1973 to 2007 because land use and land cover have dramatically evolved supposedly due to a rapid increase in population and agropastoral impacts on the landscape. The classified images were then moved from ENVI to Erdas Imagine before being imported into ArcGIS 9.2 because the Erdas Imagine format is more easily recognized and read by ArcGIS than other formats. ArcGIS was used because the program can mask images more easily than ENVI. ArcGIS was used to perform area calculations on the classified images, after clipping to a shapefile polygon matching the hydrographic pattern that defines the Upper Noun drainage basin. Also, ArcGIS was used to reproject images that lacked georeference data due to a different period of data collection from the same sensor source. Such is the case of the 1973 image that was reprojected manually using the georeferencing tool to match it with WGS 1984 UTM Zone 32N coordinate system. Another advantage of ArcGIS was creating maps and statistics of the imported data, such
59
as the Cameroon base data including hydrology, roads, settlement, DEM and SRTM. These data also were extracted using the masking polygon that was projected to the WGS84, UTM zone 32N coordinate system. The Adobe Illustrator program was used to draw maps that were adapted from other sources. The land use and land cover area by pixels were then transferred from the attribute table in ArcGIS to Microsoft Office Excel 2007 to calculate the area covered by each class. Each area covered by each class was multiplied by the spatial resolution of the pixel. The spatial resolutions for 1973 to 1988 pixels were 57 x 79 m, and from 2001 to 2007 were 28.5 x 28.5 m. This gave the area covered by each class in square kilometers and the relative percentage of cover.
5
Results The application of the supervised maximum likelihood algorithm in this study
60
reveals considerable differences over time of the proportions of land use and land cover classes within the Upper Noun drainage basin. Using ten Landsat scenes, the classification identification and labeling was principally based on the experiences of the author, the observed vegetation, water regime, settlement, agro-pastoral landscape from the satellite images, and comparable studies. Using such subjective bases, the land use and land cover classes were created. However, due to existing confounding factors during image processing such as cloud cover and reflection problems from the satellite images, and inconsistency in the data acquisition anniversary dates, only three good images that had none of these uncertainties were used for change detection analysis. These images are the 1978 rainy season, the 1988 dry season and the 2002 rainy season (see Table 4.1). This chapter is thus divided into two main parts to explain the criteria for classification and change detection based on the quality of the images. The first part presents the three selected good images with the least uncertainties for classification and change detection, addressing the first research question (see Chapter One). The second part presents the other seven images with uncertainties due to confounding factors for the purpose of discussion and analysis of the second research question. This chapter thus answers the research questions that ask about the utility of Landsat imagery for change detection and whether wetlands and related land use and land cover classes in the drainage basin can be classified for the Upper Noun Basin. The chapter also addresses the spatio-temporal relationship between wetlands and related land use and land cover to better explain detected changes in the wetland habitat and the drainage basin in general in the subsequent chapter. Generally, the results in part one of this chapter reveal a great deal of variation in
61
the classes during the dry season and rainy season. Classes that constituted the wetland within the floodplain included the reservoir, permanent and seasonally flooded swamps and marshes, and irrigated farmlands. Agropastoral classes were farmlands, and grazing areas with mixed farming zone areas. The classes of montane forest, semi-montane forest, major settlements, and settlements with enclosures and openfields made up the other dominant classes. In addition, the class of floodplain lakes was identified in the 1973 scene. 5.1
Changes observed as a result the classification of the land use and land cover for the Upper noun drainage basin Three images were selected for analysis of changes in the basin 1978, 1988, and
2002, because they contained no uncertainties like cloud cover, unclassified and reflection. Each image is described separately with a classification of the land use and land cover in the following sections.
5.1.1. 1978 Rainy season land cover and land use classes for the Upper Noun valley drainage basin During the 1978 agropastoral year, the Upper Noun valley drainage witnessed significant agrarian reforms such as swamp rice irrigation and the Bamendjin reservoir in the floodplain. The construction of the Bamendjin dam was completed in 1975 and covered 8.2 % of the basin. The reservoir covered part of the Noun marsh and the flood plain lakes located in the central southern portion of the basin. The remaining observed nonsubmerged wetland area near the reservoir covering 7.6 % of the area was classified as aquatic vegetation. Permanently flooded prairie covered 11% of the area. Seasonally
62
flooded prairie covered 12.2 % (Table, 5.1 and Figure 5.1). Swamp forest covered 7.9 %. Beyond the flood plain, the semi montane forest on the inland valleys and slopes above 1,500 meters covered 7.5 %. Montane forest above 2,000 meters covered barely 3.9 % (Table, 5.1 and Fig. 5.2). Table 5.1. 1978 total area cover and percentages of the land cover and land use classes in the Upper Noun valley drainage basin Total area area cover in km2
% of area cover
0.36
0.02
Reservoir
194.51
8.29
Aquatic vegetation
179.07
7.63
Permanent flooded prairie
262.59
11.19
Seasonally flooded prairie
286.43
12.20
Swamp forest
186.67
7.95
Semi montane forest
176.37
7.52
91.39
3.89
Upland grazing area
314.21
13.39
Mixed farming area
549.46
23.42
105.08 2346.17
4.48 100
1978 rainy season Land cover and land use classes Unclassified
Montane forest
Major settlement Total
63
Figure 5.1. 1978 percentages of the land cover and land use area cover in the Upper Noun valley drainage basin
64
Figure 5.2. 1978 land use and land cover map
65
The drainage basin makes up one of the major grazing areas in the western highlands and upland grazing covered 13.4 % of the basin. Farming covered about 23.4% of the basin (Table 5.1). The major settlements covered about 4.5% including enclosures and openfields. The major settlements in the basin were Jakiri and Ndop that had the status of sub divisional administrative headquarters (Figure 5.2). Figures 5.1 and 5.2 show how farming and grazing dominate the agrarian landscape. Upland grazing is the most common practice on the northwest slopes of Sabga and the Jakiri and Tan grazing zone on the norteast portion of the basin (Figure 5.2). Figures 5.1 and 5.2 also show how relatively extensive in area cover the wetland class was when compared to farming and grazing. These wetlands are mixed with grazing and farmlands in most of the flood plain region such as Bamunka and Bangolan (Figure 5.2). 5.1.2. 1988 Dry season land cover and land use classes for the Upper Noun valley drainage basin For the 1988 agropastoral and farming year, the Upper Noun drainage basin and especially the floodplain had undergone tremendous agrarian reforms. Rice cultivation and fishing in the reservoir emerged as major competing activities with farming and grazing. Within the floodplain, the reservoir occupied 6.42 % while irrigated farmlands made up 11.74 % of the basin (Table 5.2). Observed silt deposits showed a significant area cover of 1.3 % at the mouths of the major rivers entering into the reservoir (Figure 5.3). It is likely that the silt was due to intensive land use activities within the drainage basin, especially agriculture and grazing on the hillslopes. Permanently flooded prairies or marshes covered 0.05 % while seasonally flooded prairies covered 5.23 % (Table 5.2). Degrading swamp forest constituted 2.76 % of the drainage basin.
66
Table 5.2. 1988 total area cover and percentages of the land cover and land use classes in the Upper Noun valley drainage basin 1988 dry season land cover and land use classes Unclassified Reservoir Silt deposit Permanently flooded prairie Seasonally flooded prairie Swamp forest Semi montane forest Montane forest Upland grazing area Mixed farming areas Irrigated farmlands Major settlements Enclosures and openfields Total
2
Total area in Km 0.20 150.79 30.74 1.13 122.78 64.69 132.43 15.05 399.12 609.34 258.35 80.78 481.86 2347.28
% of area cover 0.009 6.42 1.30 0.05 5.23 2.76 5.64 0.64 17.00 25.22 11.74 3.44 20.52 100
Figure 5.3. 1988 percentages of the land cover and land use area cover in the Upper Noun valley drainage basin
67
Figure 5.4. 1988 land use and land cover map
68
Concerning human settlements within the basin at this time, smaller settlements with enclosures and openfields had spread out within the basin, and 20.52 % were observed and classified (Table 5.2). The two major settlements of Jakiri and Ndop town with neighboring growing villages represented a total of 3.44 % of the basin (Table 5.2). Also, the montane forest at the altitude of above 1,500 m covered 5.64 %. Montane forest on the higher elevation above 2,000 m covered 0.64 % (Table 5.2). Generally, the upland grazing area and mixed farming zones (farmlands and grazing areas) were the most dominant land use activities within the basin (Figure 5.3). Settlements with enclosures and openfields also covered a very high percentage. However, within the floodplain, land reclamation for irrigation had significantly reduced the swamps and the marshes (Figures 5.3 and 5.4). Irrigated farmlands had drained most of the marshes especially in Bamunka, Bangola, Bangolan, Mambin, Ndop and Bamessin (Figure 5.4).
5.1.3. 2002 rainy season land cover and land use classes for the Upper Noun valley drainage basin During the 2002 rainy season, within the floodplain, the reservoir covered 6.9 % (Table 5.3). Siltation of the reservoir covered 4 %. Permanent marshes made of flooded prairie vegetation covered a surface area of 1.9 % while seasonally flooded prairie covered about 4.3 %. On the other hand, the swamp forest covered 3.2 % (Table 5.3) while irrigated farmlands covered 6 %. Semi montane forest on the higher elevation (above 1,500 m) covered 7.4 %, while montane forest (above 2000 m) covered 0.8 % (Table 5.3). Upland grazing areas covered 12.2 % and the mixed farming areas significantly covered 37.2 % (Table 5.3 and
69
Figure 5.5). Table 5.3. 2002 rainy season total area cover and percentages of the land cover and land use classes in the Upper Noun valley drainage basin.
2002 rainy season land cover and land use classes Reservoir Silt deposit Permanent flooded prairie Seasonally flooded prairie Swamp forest Semi montane forest Montane forest Upland grazing area Mixed farming areas Irrigated farmlands Major settlement Enclosures and openfields
Total area % of area cover in 2 Km cover 6.89 161.70 4.08 95.63 1.94 45.46 4.33 101.54 3.21 75.23 7.45 174.58 0.85 20.06 12.26 287.59 37.25 873.49 6.04 141.53 6.86 160.00 8.84 207.13 2344.72
100
Figure 5.5. 2002 rainy season percentages of the land cover and land use area cover in the Upper Noun valley drainage basin
70
Figure 5.6. 2002 land use and land cover map
71
Major settlements increased within the drainage basin relative to earlier images, and most areas that were identified as principally enclosure and openfields had become major settlements. However, these growing settlements were around the ethnic groups within the drainage basin. Some of the identified cases in question are Babessi, Baba 1, Wainama, Sabga and Bamessin (Figure 5.6). The major settlements covered 6 % while settlements with enclosures and openfields occupied 8.8 % of the basin (Table 5.3). Generally, the upland grazing areas and mixed farming zones for agropastoral activities dominated the land use within the drainage basin (Figure 5.5). Within the floodplain, irrigated farmlands and the reservoir were the major land uses and land covers while the seasonally and permanently flooded swamps and marshes continued to cover small areas in the basin. Sediment deposits around the dam were abundant at the mouth of the major rivers in the reservoir (Figure 5.6) 5.2
Change detection analysis for specific land use and land cover classes Spatiotemporal analysis of change detection with respect to observed classified
land cover and land use from the three Landsat images used for change detection (1978, 1988, and 2002) reveals considerable changes within the entire Upper Noun drainage basin. To better understand the observed changes, the analysis and discussion are presented in two ways. First is the general summary of the percentages of the land use and land cover classes whereby a collection of the rainy season and dry season data for the different years are grouped together and then globally compared. This is to determine if changes have taken place over the three decades of the study from 1978 to 2002 using three selected images (Table 5.4 and Figure 5.7). Secondly, change detection is analyzed
72
by grouping the different land cover and land use classes from 1978 to 2002 in four main ecological and human landscapes: change detection within the floodplain wetland area, the agropastoral landscape, montane forest region and settlement areas. This is designed to test the research hypothesis on changes observed in the Upper Noun drainage basin using multi-temporal and spectral Landsat images, the extent to which available Landsat MSS, TM, ETM and ETM+ can detect the state of change in land use and land cover, and the change detection methods that can best identify land cover and land use dynamics using multi-temporal and spectral Landsat images from 1978 to 2002. Generally, table 5.4 and figure 5.7 show that large changes have been observed within the Upper Noun drainage basin. All 13 identified land use and land cover classes show changes in their area cover. These changes are further examined, analyzed, and discussed under the following four groups Table 5.4. Percentages of the different land cover and land use classes for the area cover and change within the different classes for the Upper Noun drainage basin from 1978 to 2002. Land cover and land use classes
Reservoir
Silt deposit
Permanently flooded prairie
Seasonally flooded prairie
Swamp forest
Semi montane forest
Montane forest
Upland grazing areas
Mixed Farming areas
Irrigated farmland
Major settlem’t
Enclosures and openfields
1978 rainy season
8.748
09
11.19
12.2
7.95
7.52
3.89
13.39
23.42
0
4.48
0
1988 dry season
6.42
1.3
0.05
5.23
2.76
5.64
0.64
17.00
2002 rainy season
25.22
11.74
3.44
20.52
6.89
4.07
1.94
4.33
2.78
7.45
0.85
12.26
37.25
6.04
6.84
8.84
8 This is the percentage of area covered by the floodplain lake before the construction of the Bamendjin reservoir. 9
0=Data excluded because of error from classification or not available.
73
Figure 5.7. Total percentages of the land use and land cover area changes observed and classified for the Upper Noun drainage basin from 1978 to 2002
5.2.1
Change detection within the floodplain wetland area. Change detection within the floodplain wetland area is classified into the
following land cover and land uses. 5.2.1.1 Changes in the reservoir The Bamendjin dam constructed in 1975 became a major land cover in the floodplain and is a main feature when observing the floodplain from satellite images. The dam was designed to hold back flood waters in the numerous floodplain lakes that once characterized the Ndop plain lakes to support the Edea hydroelectricity plan during the dry season. Since the creation of the dam, large spatio-temporal changes have occurred within this zone as observed and assessed using Landsat images from 1978 to 2002. Table 5.5 and figures 5.8 shows this trend of changes within the reservoir area.
74
Table 5.5. Change in the reservoir area from 1978 to 2002 % of reservoir area reservoir area Year and season cover in Km2 covered 1978 rainy season 194.51 8.29 1988 dry season 150.78 6.42 2002 rainy season 161.71 6.89
Figure 5.8. Change in area cover of the Bamendjin reservoir from 1978 to 2002 In 1988 following extensive drainage of these swamps and marshes, siltation was pronounced around the reservoir, significantly reducing the reservoir surface area (Figure 5.8). There is, however, no observed correlation between the reservoir waters and the siltation (Table 5.8 and , Figure 5.10). A comparative look at the three images in Figure 5.10 shows the remarkable change observed within the reservoir area. Notice the creation of the reservoir on the floodplain lakes area and the siltation along the dam shores especially where the rivers are entering the reservoir.
75
5.2.1.2 Siltation Siltation was pronounced around the reservoir waters in 1988 and covered 1.3% of the basin. Table 5.6 and Figure 5.9 shows an upsurge in siltation from 1978 to 2002. Siltation is accounted for by intensive upland farming and grazing on the slopes that surround the floodplain, conversion of montane forest to farmlands, and growth in settlements. The general upsurge in siltation is suggested from figure 5.1 that shows a steady increase in mixed farming and grazing zones that are concentrated on the surrounding hills within the basin. Also Figures 5. 17 and 5.18 show a general trend of a drop in semi montane and montane forest, and Figure 5.20 shows an increase in major settlements because of expansion of enclosures and openfields to bigger settlements. There is, however, a positive correlation existing between siltation and these land use practices. Silt from these major land use practices is eroded into the floodplain by the many rivers that drain into the floodplain. Figure 5.10 shows that there is a general increase in the area cover of the amount silt deposit in around the reservoir area. Table 5.6. Change in the area covered by sediments from 1988 to 2002 Silt deposit % of silt deposit Year and season area cover area cover 1988 dry season 30.74 1.31 2002 rainy season 95.63 4.08
76
Figure 5.9. Change in area cover by silt deposit around the reservoir from 1988 to 2002 in the floodplain.
Figure 5-10. Comparative change detection within the reservoir area from 1973 to 2007. Notice the conversion of the floodplain lakes (1973) to reservoir 1978, 1988 and 2002.
1973 floodplain lakes
Siltation at the main river mouths (1988)
1978 Image
Reservoir area 2001
77
5.2.1.3 Change detection in the permanently flooded prairies Permanently flooded prairies, like any marshes in a wetland area, play the role of trapping sediment and maintaining the water table through water recharge and nutrient retention. One of the major ecological characteristics of the floodplain is its prairie marshes that covered extensive portions of the floodplain in the past. Table 5.7 shows change observed on the permanently flooded prairies from 1978 to 2002. Permanently flooded prairies covered 11.19 % of the basin within the floodplain in 1978. Following the land reclamation project to irrigate these marshes for swamp paddy rice cultivation, a degradation trend was observed (Figure 5.11). By 1988 when the reclamation project was completed, the permanently flooded prairies barely covered 0.05 % of the drainage basin. Table 5.7 Change in permanently flooded prairies area cover from 1978 to 2002 total area covered in % of area covered Year and season km2 1978 rainy season 262.59 11.19 1988 dry season 1.12 0.05 2002 rainy season 45.46 1.94
Figure 5.11. Change in permanently flooded prairie change in area cover from 1978 to 2002
78
5.2.1.4 Changes in the seasonally flooded prairie. Another prominent characteristic of the Ndop floodplain was its extensive areas of seasonally flooded prairies. This land cover class made up 12.20 % of the drainage basin in 1978 (Table 5.8). Following the construction of the Bamendjin reservoir and land reclamation, the surface area of seasonally flooded prairie decrease. However, following land reclamation for swamp rice irrigation there was a decrease in the area cover to 5.23 % by 1988 and to 4.33 % in 2002 (Table 5.8 and Figure 12). Table 5.8. Change in seasonally flooded prairies area cover from 1978 to 2002. % of area area cover 2 cover Year and season in km 1978 rainy season 286.43 12.20 1988 dry season 122.78 5.23 2002 rainy season 101.54 4.33
Figure 5.12. Change in seasonally flooded prairie percentages of area cover from 1978 to 2002
79
5.2.1.5 Swamp forest Swamp forest within the drainage basin constituted a very important ecological character of the floodplain. Swamp forest in 1978 covered 7.95 % of the basin (Table 5.9). The reservoir submerged a greater proportion of the swamp forest that was intermixed montane and humid tropical species because of the humid nature of the plain (Ndueh 1990). According to Ndueh (1990), no logging was practiced here before the completion of the dam construction, so the forest ended up dying under the held back dam waters. Land reclamation for swamp rice cultivation in 1985 by the UNVDA partly accounts for this significant drop to 2.76 % by 1988. However, the area cover from 1988 to 2002 ( 2.76 % (1988), 2.78 % (2002)) shows little change (Figure 5.13). Table 5.9. Swamp forest and change in area cover from 1978 to 2002 area cover % of area Year and season in km2 cover 1978 rainy season 186.68 7.95 1988 dry season 64.69 2.76 2002 rainy season 65.30 2.78
Figure 5.13. Change in the swamp forest area cover from 1978 to 2002
80
5.2.1.6 Irrigated farmlands and change detection. Irrigation is one of the main land use management practices carried out in the Upper Noun during the dry and rainy seasons. Irrigation is widely practiced during the dry season and became pronounced from the early 1970s following land reforms that encouraged population migration into the floodplain. Rice and vegetables constitute the main irrigated cash crops in the floodplain. The Landsat images for the Upper Noun were able to detect irrigated areas in 1988 when extensive swamps and marshes had been converted following the 1985 agrarian reforms that reclaimed the floodplain for paddy rice irrigation. In 1988, 11.74 % of the basin was under irrigation from UNVDA. By 2002 the irrigated area cover dropped significantly to 6.04 % (Table 5.10 and Figure 5.14). Table 5.10. Change detection in the irrigated farmlands in the floodplain from 1988 to 2002 Area % of area Year and season cover cover 1988 dry season 258.35 11.74 2002 rainy season 141.53 6.04
Figure 5.14. Percentages of irrigated farmlands change in area cover from 1988 to 2002
81
5.2.2
Change detection within the agropastoral landscape of the Upper noun drainage basin The agropastoral landscape within the Upper Noun drainage basin constitutes one
of the major land cover and land use activities. This includes the upland grazing area that makes up rainy season areas that are exclusively livestock rearing. Such areas include the Sabga, Jakiri and Tan areas that make up the Tadu Dairy Cooperative Society of Cameroon and the SODEPA (Societé du Developpement des Produit Animal - Society for the Development of Livestock) ranch in Jakiri (Bayemi et al. 2005). The mixed farming and grazing zones constitute the major subsistence farming areas during the rainy season and grazing areas during the dry season. These areas are both in the floodplain (during the dry season) and uplands during the rainy and the dry season. 5.2.2.1 Upland grazing area The upland grazing area was greatly affected by agrarian reforms that focused for the most part on agricultural modernization under the then green revolution in the Cameroon third five year development plan (1971-76). Most of these grazing areas were turned to farmlands. These farmlands were mostly coffee farms and maize farms, the most common crops in the western highlands. By 1978 upland grazing covered 13.39 % of the drainage basin. There was an increase in the area covered to 17 % in 1988 and then dropped to 12.26 % in 2002 (Table 5.11 and Figure 5.15). Upland grazing area shows a relatively large drop from 1988 to 2002. This is supposedly due to population growth and settlement expansion, and to a greater extent improvement in grazing methods such as ranching.
82
Table 5.11. Change in upland grazing area from 1978 to 2002 Total area % of area Year and season cover cover 1978 rainy season 314.21 13.39 1988 dry season 399.12 17.00 2002 rainy season 287.59 12.26
Figure 5.15. Change in upland grazing area cover from 1978 to 2002 5.2.2.2 Mixed farming and grazing area. Mixed farming zones where grazing and agriculture are carried out constitute the major land use and land cover in the basin. Most of these areas are located around settlements, upland grazing areas and the floodplain. They make up the most sensitive areas for farmer and herder conflicts, especially areas close to upland grazing areas and during transhumance in the floodplain. Within the Upper Noun basin mixed farming zone, there is an increase in area cover because of settlement expansion and conversion of most of upland grazing areas and hillslopes to farmlands. In contrast, upland grazing zones, mixed farming areas steadily increased in area from 1978 to 2002 (Table 5.12 and
83
Figure 5.16). Table 5.12 shows by 1978, the mixed farming areas covered 23.42 % (Table 5.12). This increased to 25.22 % in 1988 and by 2002 it covered 37.25 % within the drainage basin (Table 5.12, and Figure 5.16). Table 5.12. Mixed farming and grazing area cover from 1978 to 2002 area % of area Year and season cover cover 1978 rainy season 549.46 23.42 1988 dry season 609.34 25.22 2002 rainy season 873.49 37.25
Figure 5.16. Percentages of area cover change in the mixed farming area within the Upper Noun drainage basin from 1978 to 2002. 5.2.3
Forest cover
5.2.3.1 Semi montane forest Semi montane forest principally occupied the inland valleys and hillslopes above 1,500 m and can be found intermixed with sudano shrubs and tropical humid rain forest in the Ndop floodplain. Because of its diverse uses and competition with farming and
84
grazing, most of it was near extinction within most of the inland valleys before the creation of the Kilum/Ijim Community forest project. Table 5.13 and Figure 5.17 show a fluctuation in the semi montane forest between 1978 and 1988 when most of the agrarian reforms were instituted during the Cameroon second and third five year development plans. Most of the semi montane forest area was converted to coffee plantations and maize farms. However, by 2002 most of the semi montane areas had recovered due to success in instituting the community forest project in 35 different communities whereby a number of them are located within the Upper Noun basin, with well defined boundaries between the farmlands and grazing areas, and community forest zones. Table 5.13. Semi montane forest area cover change from 1978 to 2002 Semi montane forest % of area Year and season area cover cover 1978 rainy season 176.37 7.52 1988 dry season 132.43 5.64 2002 rainy season 174.58 7.45
Figure 5.17. Semi montane forest area cover change from 1978 to 2002
85
5.2.3.2 Montane forest Above 2,000m to 3,011m the montane forest plays a similar ecological function in the Bamenda Highlands as in the semi montane. Adapted to higher altitude with heavy rainfall, the zone was formerly home to abundant tropical wildlife. Birdlife International (1987) noted that, unfortunately, very little of the Bamenda Highlands montane forest remains as the forests have been cleared over the years for farming and grazing. It is estimated that had clearing continued unchecked, the Kilum-Ijim Forest might have completely disappeared by 1997 given the observed degradation rate when Birdlife International started their project in 1987 (Birdlife International Cameroon, 2008). Table 5.14 and Figure 5.18 show that since 1978 there has been a general downward trend in the area covered by montane forest. Montane forest is relatively distant from other forms of land use practices within the basin compared with semi montane forest, and faces very little competition from grazing and farmlands. Generally, montane forest is showing a little recovery from significant degradation primarily because its location is distant from settlement, farmlands, grazing areas, and enclosure and openfields, and also because of international concern by biodiversity and conservation organizations (WWF-Cameroon, IUCNCameroon, Birdlife International, and Global Forest Watch).
Table 5.14. Montane forest area cover change from 1978 to 2002 Montane forest area % of area 2 Year and season covered in km cover 1978 rainy season
91.40
3.89
1988 dry season 2002 rainy season
15.05 20.06
0.64 0.85
86
Figure 5.18 Montane forest area cover change from 1978 to 2002 in the Upper Noun Valley drainage basin 5.2.4
Settlement in the drainage basin Change detection and settlement within the drainage basin was classified into
major settlements that constituted large settlements, enclosures and open fields that were made of small villages around family farm holdings, and isolated hamlets dispersed on the surrounding hillslopes. 5.2.4.1 Changes in major settlements, and enclosures and openfields within the drainage basin from 1978 to 2002 The 1978 satellite images show Jakiri as a linear settlement, largely surrounded by enclosures and openfields and within the basin, settlements covered 4.48 %. By 1988, major settlements had emerged and could be spatially distinguished from enclosures and openfields. Rapid growth was observed in the major settlements of Jakiri and Ndop. In the floodplain in 1988, Ndop and to a lesser extent, Balikumbat and Babessi, were the major fast growing villages. Meanwhile, the other ten component villages in floodplain
87
were largely still rural (Ngwa, 2003). Figure 5.19 shows that by 1978, Ndop town was very small from Landsat observation and by 1988 it was already a large settlement. These major settlements covered 3.44 % while the identified enclosures and openfields covered about 20.52 %. In fact, present Ndop town has a history of rapid urbanization following agrarian reforms that introduced irrigated swamp rice in 1985. Before the advent of UNVDA, Ndop had been described as a “dull village without lights, pipe borne water and anything to entertain the public” (Ngwa, 2003).
Figure 5.19. Change in the Ndop settlement area from 1978 to 1988 following swamp introduction in the floodplain.
Table 5.15. Major settlement areas and openfields and enclosures area cover from 1978 to 2002 within the Upper Noun drainage basin % of area Major cover by Enclosures/ % of area cover settlement major Openfield by Enclosures/ 2 2 settlement in km Openfield Year and season in km 1978 rainy season 105.08 4.48 3.44 20.52 1988 dry season 80.78 481.86 2002 rainy season 160.69 6.84 207.13 8.84 Generally, the observed and classified enclosures and openfields show that as they
88
grow in size, the major settlements are also expanding. Although the openfields and enclosures have reduced in area cover from 1988 to 2002, the major settlements have remained concentrated. For example, Figure 5.20 shows that most of the settlements in the basin by 1988 were made of enclosures and openfields with very few main settlements. By 2002, most of these enclosures had grown to main settlements of large villages. These smaller villages were observed as major settlements and thus there was a drop in openfields and enclosures. Figure 5.20 shows a general decrease in enclosures and openfields from 1978 to 2002 and an increase in major settlements.
Figure 5.20. Percentages of major settlements, enclosures and openfields area cover change from 1978 to 2002 within the Upper Noun drainage basin.
5.3
Other images: classification with challenges The remaining seven images presented problems during classification such as
cloud cover and scan lines. These images were thus determined not suitable for change detection analysis because of these confounding factors. However, aside from some
89
issues, they were able to be classified for land cover and land use for the Upper Noun drainage basin. These images are 1973, 1984, 2001, 2002 dry season, 2003, 2006 and 2007. The following classification challenges were identified in the study. 5.3.1
1973 land cover and land use classes for the Upper Noun valley drainage basin. The major uncertainty with this image was the cloud cover that covered 0.81 % of
area. The classification results including cloud cover are in Table 5.16. The cloud covered part of the floodplain lakes, floodplain prairie and swamp forest. Table 5.16 Total area covered and percentages of land use and land cover for the Upper Noun valley drainage basin Land use and land cover total area in 1973 Dry season land cover and land use classes km2 Unclassified 0.033 Cloud cover 19.07 Ndop floodplain lake 228.54 Permanently flooded prairie 454.70 Seasonally flooded Prairie 230.22 Swamp forest 194.30 Upland grazing areas 302.12 Mixed farming areas 658.99 Semi Montane forest 180.35 Montane forest 70.98 Major settlements 7.88 Total 2347.20 Total Cloud cover and Unclassified area 19.09 Excluding Cloud cover and Unclassified area 2328.11
% of area cover % of area including cloud cover Excluding cover and cloud cover and unclassified unclassified 0.0014 0.81 9.74 9.82 19.37 19.53 9.80 9.89 8.28 8.35 12.87 12.98 28.08 28.30 7.68 7.75 3.03 3.05 0.34 0.34 100 100
90
Figure 5.21. 1973 land cover and land use area cover in the Upper Noun valley drainage basin
91
5.3.2
1984 land cover and land use classes for the Upper Noun valley drainage basin The uncertainty that excluded this image from change detection is major
settlement class and time interval inconsistency. The major settlements were classified by the supervised maximum likelihood algorithm the same as upland grazing area because of a reflection problem. These areas look whitish and had a similar spectral signature that was difficult to distinguish by the supervised maximum likelihood algorithm (Figure 5.22). The classification results thus exclude major settlement in Table 5.17. Also another factor that excluded this image from classification was the inconsistency in the time interval from the first considered image (1978) which was less than ten years compared to 1988. Table 5.17. 1984 rainy season total area cover and percentages of the land cover and land use classes in the Upper Noun valley drainage basin 1984 rainy season land cover and land use classes Reservoir Permanently flooded prairie Seasonally flooded prairie Swamp forest Swamp forest Semi montane forest Montane forest Upland grazing area Mixed farming areas Major settlements Total area Excluding major settlements with enclosures and openfields Total excluding all settlements
% of area Land use and cover % of area cover land cover total including Excluding cloud area in km2 settlements cover 218.42 9.30 10.14 226.53 9.65 10.52 209.63 8.93 9.74 108.43 4.62 5.03 85.73 3.65 3.98 214.76 9.14 9.97 66.06 2.81 3.07 433.21 18.45 20.12 590.05 25.13 27.40 195.06 8.31 2347.90 100 100 195.0579 2152.844
92
Figure 5.22. 1984 land cover and land use area cover in the Upper Noun valley drainage basin
93
5.3.3
2001 dry season land cover and land use classes for the Upper Noun valley drainage basin The uncertainty that excluded this image from being considered for change
detection is the settlement class. Because the spectral signature for major settlements was close to semi montane forest and upland grazing, the supervised maximum likelihood algorithm instead assigned more pixels to settlement from what should have been classified as semi montane forest and upland grazing (Fig. 5.23). Table 5.18. 2001 total area cover and percentages of the land cover and land use classes in the Upper Noun valley drainage basin
2001 rainy season land cover and land use classes Unclassified
Total area cover in Km2
% 0f area cover
% of area cover
0.22
0.009
204.49
8.71
9.25
Silt deposits
26.03
1.11
1.17
Permanently flooded prairie
23.93
1.02
1.08
118.91
5.07
5.38
Degraded swamp forest
65.29
2.78
2.06
Semi montane forest
41.36
1.76
1.07
Montane forest
18.41
0.78
0.83
Upland grazing area
424.76
18.09
19.22
Mixed farming areas
803.34
34.23
36.35
Irrigated farmlands
145.06
6.18
6.06
Major settlements
136.97
5.83
Enclosures and open-fields
438.23
14.41
17.53
Total
2347.02
100
100
Excluding settlements Total area excluding settlements
137.19 2209.83
Reservoir
Seasonally flooded prairie
94
Figure 5.23. 2001 rainy season land cover and land use classes in the Upper Noun valley drainage basin.
95
5.3.4
2002 Dry season land cover and land use classes for the Upper Noun valley drainage basin Cloud cover is the main uncertainty that excluded this image from change
detection analysis. The cloud cover had a close spectral signature to major settlement and this can be seen figure 5.24 where the cloud cover pixels are misclassified as major settlements west of Ndop town. Table 5.19. 2002 dry season total area cover and percentages of the land cover and land use classes in the Upper Noun valley drainage basin.
2002 dry season land cover and land use classes Unclassified Cloud cover Reservoir Silt deposit Permanently flooded prairie Seasonally flooded prairie Degraded swamp forest Semi montane forest Montane forest Upland grazing areas Farmlands and grazing areas Irrigated farmlands Major settlements Settlement with enclosures and open-fields Total Total Cloud cover and Unclassified area Excluding Cloud cover and Unclassified area
% of area cover including cloud Total area cover and unclassified cover in Km2 0.19 0.008 11.75 0.50 187.42 45.92 148.45 134.59 40.76 139.09
7.98 1.95 6.32 5.73 1.74 5.92
29.66 312.90 629.02 266.77 159.75 242.36 2348.66 11.94 2336.72
1.26 13.32 26.78 11.36 6.80 10.32 100
% of area cover Excluding cloud cover and unclassified
8.02 1.96 6.35 5.76 1.76 5.95 1.47 13.59 26.39 11.54 6.84 10.37 100
96
Figure 5.24. 2002 dry season land cover and land use classes in the Upper Noun valley drainage basin.
97
5.3.5
2003 dry season total area cover and percentages of the land cover and land use classes in the Upper Noun valley drainage basin. During the 2003 dry season, about 11 % of the Landsat scene was covered by
clouds of the total classified area (Table 5.20, and Figure 5. 25). The image is thus excluded from change detection analysis. This is because the cloud cover spectral signature is close to that of the densest settlements. The supervised maximum likelihood algorithm thus classified part of the clouds pixels in this area as settlement. Major settlements are therefore not considered for the 2003 dry season land use and land cover classification. Figure 5.25 shows extensive cloud cover around the Bamendjin dam and the Ndop town area, and also the false classification of part of the clouds as major settlement. Also the image is excluded from classification because of time interval inconsistency. Table 5.20. 2003 dry season total area cover and percentages of the land cover and land use classes in the Upper Noun valley drainage basin.
2003 dry season land cover and land use classes Unclassified Cloud cover Reservoir Permanent marshes Seasonally flooded swamp forest Degraded swamp forest Semi montane forest Montane forest Upland grazing areas Mixed farming areas Irrigated farmlands Major settlement Settlement with enclosures and open-field Total area cover Excluding cloud cover and major settlements and unclassified
% of Total area area cover in Km2 cover 0.26 0.01 261.27 11.13 145.67 6.20 35.82 1.53 40.85 1.74 101.78 4.34 75.06 3.20 63.02 2.68 330.42 14.08 627.31 26.72 195.37 7.61 211.79 9.02 228.38 9.73 2347.02 100 473.34
% of area cover excluding cloud and settlement
7.77 1.98 2.58 5.54 4.21 3.96 17.84 33.48 10.44 12.2 100
98
Total area cover excluding cloud, major settlement and unclassified
1873.69
Figure 5.25. 2003 dry season land cover and land use classes in the Upper Noun valley drainage basin
99
5.3.6
2006 rainy season land cover and land use classes for the Upper Noun valley drainage basin This image is excluded from classification first because of time interval
inconsistency and second because of the Scan Line Corrector (SLC) problem. The irrigated farmlands are excluded from the classification because they are wrongly classified by the supervised maximum likelihood algorithm to include the uncorrected scan lines in the Landsat image. The scan lines were interpreted as irrigated farmlands (Figure 5.26). Figure 5.26 shows how the scan lines are classified as irrigated farmlands. Table 5.21. 2006 rainy season total area cover and percentages of the land cover and land use classes in the Upper Noun valley drainage basin. 2006 rainy season land cover and land use classes Unclassified
Total area of area cover in Km2
% of area cover
% of area cover Excluding irrigated area
12.94
0.55
199.18
7.21
9.59
Silt deposits
70.43
3.00
3.39
Permanent marshes
60.53
2.58
2.92
104.12
4.44
5.02
Swamp forest
80.65
3.44
3.89
Semi montane forest
44.13
1.88
2.13
Montane forest
103.89
4.43
5.01
Upland grazing areas
281.84
12.00
13.57
Farming and grazing areas
705.09
30.03
33.98
Irrigated farmland
259.28
11.04
Major settlements
136.75
7.10
6.59
288.68 2347.52 259.28
12.30 100
13.91
Reservoir
Seasonally flooded marshes
Enclosures and openfields total area cover Excluding irrigated farmlands and unclassified Total considered area cover excluding irrigated farmlands and unclassified
2075.30
100
100
Figure 5.26. 2006 rainy season land cover and land use classes in the Upper Noun valley drainage basin.
101
5.3.7
2007 dry season land cover and land use classes for the Upper Noun valley drainage basin.
Problems with the uncorrected scan lines caused this image to be excluded from classification. The montane forest is excluded from the results because its classification included the uncorrected scan lines. Figure 5.27 shows the classification of montane forest. Table 5.22. 2007 dry season total area cover and percentages of the land cover and land use classes in the Upper Noun valley drainage basin. % of area cover excluding montane forest and unclassified
2007 dry season land cover and land use classes
Total area cover
% of area cover
Unclassified
15.30
0.65
Reservoir
186.37
6.23
8.66
Silt deposit with aquatic weeds
67.37
2.87
3.13
Permanent marshes Seasonally flooded marshes Swamp forest
106.12 92.77 80.19
4.52 3.95 3.58
4.93 4.31 3.72
Semi-montane forest
26.72
1.13
1.24
Montane forest Upland grazing areas
180.74 392.10
7.70 16.70
18.22
Farmland and grazing areas
637.38
27.15
29.63
Major settlements
104.80
4.46
4.85
Irrigated farmlands
144.03
7.41
6.58
Enclosures and openfields
319.19
13.59
14.73
Total area cover
2347.15
100
Excluding montane forest and unclassified Total area cover excluding montane forest and unclassified
196 2151
100
102
Figure 5.27. 2007 dry season land cover and land use classes in the Upper Noun valley drainage basin
103
6
Discussion and Interpretation Landsat images from 1978–2002 reveal considerable spatiotemporal changes
within the entire Upper Noun drainage basin. A number of issues within the drainage basin contributed to this change and there were also issues that resulted from these changes from 1978 to 2002. This chapter with discuss factors that contributed to change and issues resulting from the factors. These include land reclamation and irrigation, the construction of the Bamendjin reservoir, shifting land use management within the upland grazing area, community forest management projects of the montane forest, and resource exploitation versus ethnic affiliation and settlement pattern. 6.1
Reservoir creation and change related issues. The Bamendjin reservoir (constructed in 1975) is one of the major land covers
that has brought about change in the landscape of the floodplain with far reaching ecological and socio economic implications in the drainage basin and beyond, such as fishing and irrigation. By 1978, three years after the creation of the reservoir, it covered less surface area than the former floodplain lakes, because most of the floodplain waters were being drained to delimit the reservoir boundaries in order to resettle farmers in the floodplain area (Ndueh, 1990). Although the 1973 image was not used for change detection the floodplain lakes were clearly visible in that image and the difference in their area and that of the reservoir in the 1978 image are noticeable (Figures 5.21 and 5.23). The reservoir siltation as seen in Figures 5.10 poses a major threat to the reservoir’s capacity to reinforce the Edea hydroelectricity plant and the need to carryout sustainable land use practices and management of the catchment area within the basin.
104
Siltation is likely caused by overgrazing (Figure 6.1) among other factors.
Figure 6.1. Degrading grazing land at the slopes of the Mbam massif that over look Ber Source: Ndzeidze, 2001. A=irrigation canals, B=rice fields, C=overgrazed hill slopes due to cattle rearing. 6.2
Land reclamation and change related issues with flooded prairies and swamp forest. Land reclamation significantly reduced the permanent and seasonally flooded
prairie from 1978 to 2002, however, the permanently flooded prairie showed little recovery in 2002. This recovery faces high competition from other land use activities like dry season vegetable irrigation. However, there are plans to rehabilitate the abandoned reclaimed areas and rejuvenate the abandoned areas under the Heavily Indebted Poor Countries initiative (HIPC) program by the World Bank. This is in order to reduce the
105
huge importation of rice from South East Asia (The Cameroon Post Online, September 2007). Swamp forest area from 1988 to 2002 showed some stability, having 2.76 % and 2.78 % cover, respectively, because the Bamenda Highland forest conservation program includes the swamp forest of the Ndop plain as one of the major threatened ecological zones. On the other hand, the swamp forest had a huge loss and degradation and later gained stability. This is because most of these areas that were reclaimed by 1988 were later difficult to manage because they require annual dredging which was too expensive for the UNVDA. Thus they were abandoned. These abandoned areas later had vegetation recovery and this explains why by 2002 there was an observed increase of permanently flooded vegetation in the wetland (Table 5.10 and Figure 5.17). 6.3
Land reclamation and change related issues with swamp rice irrigation. Rice is the only crop in the Upper Noun basin that tolerates seasonally flooded
conditions and directly depends on wet conditions. Other rainy season crops cultivation are therefore limited to the flooded area fringes. Rice is irrigated under directives from the UNVDA and became widespread since the 1977/78 production years of the UNVDA (Table 6.1 and Figure 6.2). The Landsat images for the Upper Noun were able to detect irrigated areas in 1988 when extensive swamps and marshes had been converted following the 1985 agrarian reforms that reclaimed the floodplain for paddy rice irrigation. Although by 1988 the UNVDA had developed about 5,000 ha of wetlands for rice cultivation, only about 1,600 ha were mechanized while the rest were still cultivated using animal traction and hand tilling (Table 6.1). On the whole, the Ndop floodplain
106
covered an estimated 15,000 ha of wetland suitable for irrigation, and 5,000 ha were developed for irrigation and only 3,000 ha could be managed (UNVDA, 2003). Table 6.1 shows the cultivated surface area covered for irrigated swamp rice areas from 1977/1978 to 2002/2003 UNVDA production years. Table 6.1. Rice production and surface area cultivated from 1977/78 to 2002/2003 UNVDA production year UNVDA Surface No of Production Cultivated Rice Year (ha) Farmers 1977/78 824 2,500 1978/89 869 2,575 1979/80 774 2,404 1980/81 894 2,638 1981/82 1,273 3,177 1982/83 1,231 3,225 1983/84 1,518 5,542 1984/85 1,753 6,400 1985/86 2,178 5,862 1986/87 2,058 5,687 1987/88 1,612 4,682 1988/89 1,087 3,475 1989/90 1,243 3,350 1990/91 1,215 3,754 1991/92 1,299 4,377 1992/93 1,247 4,386 1993/94 1,245 4,197 1994/95 1,426 4,554 1995/96 1,704 5,715 1996/97 1,744 5,617 1997/98 1,760 5,594 1998/99 2,009 6,741 1999/2000 2,225 7,026 2000/2001 1,740 2,195 2001/2002 3,045 6,930 2002/2003 2,076 7,698
Source: UNVDA 2003 Table 6.1 and figure 6.2 show an increase in irrigated swamp rice fields and in the number of farmers from 1985 to 1988, and a drop in the late 1980s and the 1990s.
107
Irrigated areas showed a downward trend from 1988 to 2002 because the economic crisis that struck Cameroon in the late 1980s and the 1990s led to many farmers abandoning rice cultivation. However, in 2002 there was an upward trend in the area cover because of government subsidy to farmers for farm input like fertilizer, improved seeds and tilling. Because of these government subsidies, there was a gradual upward trend from 1999 to 2003.
Figure 6.2. Swamp rice production under directives from the UNVDA and the number of farmers from 1977/78 to 2002/23 production year.
The vegetables in table 3.5 are typically adapted to the flood plain especially when irrigation is intensive during the dry season. Dry season vegetable irrigation has gained more ground, and more farmers have become involved due to a steady market for these products.
108
6.4
Agropastoral landscape and change related issues within the drainage basin. Concerning the agropastoral landscape, by 1978 just 18 years after Cameroon’s
independence (January 1, 1960), the population density was still very low and the only major settlements were Jakiri and Ndop. The upland grazing area covered 13 % of the whole basin by 1978. Following the agrarian reforms that had improvement in livestock as one of the major objectives in the Cameroon third five year development plan (197176), these grazing areas increased in area. However there was a drop in area cover by 2002 because of population growth and settlement expansion, and to a greater extent, improvement in grazing methods such as ranching. 6.5
Semi montane and montane forest change and related issues within the drainage basin Concerning the semi montane forest, the main issue surrounding the forest was
the creation of the Kilum/Ijim Mountain Forest Project (KMFP) in 1988 and which ended in 1996 with the aim of conserving the largest and most important remnant of montane forest in the Bamenda Highlands of Cameroon's north-west province. The conservation of the forests is crucial to watershed protection for over 100,000 people who farm the slopes around the mountain below the forest, and obtain from the forest many products including fuel wood, building and thatching materials, medicines, honey and other forest products (Birdlife International Cameroon, 2008). The montane forest zone was formerly home to abundant tropical wildlife. Attempts under the British administration to conserve this forest began in 1931, and continued in conservation programs of 1938, 1961 and 1963 but was strongly objected to by the three ethnic groups that surround the forest (Oku, Nso and Kom). Finally, in 1975,
109
the successful demarcation of the forest boundary was accepted. By 1986, the forest had been reduced to 50 percent of its 1963 size (Asanga, 2002). As the largest area of Afromontane forest left in West Africa, the forest has been an area of concern to many conservationists. 6.6
Settlement and change related issues within the drainage basin. There have been substantial increases in settlement area in the basin as described
in Section 5.2.4. Ndop town and its component villages such as Bamunka, Bamali, Babungo, Babessi, Balikumbat and Baba have radically changed in many respects following the introduction of swamp rice cultivation. The urbanization of Ndop should not be attributed to the creation of UNVDA alone, because administrative developments have played their role, such as the raising of Ndop to a Sub-Division and more recently to a full Division in 1992, (Ngwa, 2003). On the other hand Jakiri (Dzekwa Zone) is a fast growing administrative headquarter (Sub division) with neighboring fast growing settlements like Mantum, Meyaya, Shiy, Noy (above Ber and Wasi), Ntohti, Wainamah, Sarkong escarpment (above Babessi). The Sabga area makes up another main settlement that emerged in 1980 as a cattle market. Various departments of the central government are represented in Jakiri, Ndop, Babessi and Balikumbat region in the form of Divisional and Sub-Division Delegations.
110
7
Study Evaluation There are some reasons why this study may have failed to detect significant
change in the Upper Noun drainage basin from 1973 to 2007 using multispectral and temporal Landsat satellite images. The study was designed to generally observe change within the drainage basin, and particularly the wetland, through a comparative analysis of detected variation in the landscape. The methods used in the study could be improved in several ways. First of all, ground collection of the land cover and land use data would have made the analyses more reliable. Secondly, the inconsistency in the time interval between images led to biased and uneven presentation of the results for some periods, which reduced the power to distinguish systematically the observed change at equal intervals. The tendency to select the least cloud covered image, the failure of the Landsat TM for the 1990s (Landsat 6, launched in October 5, 1993 (did not achieve orbit) ), the Scan Line corrector failure in landsat ETM+7, and the cost of data acquisition accounted for the inconsistency in time interval. In this regard, only 1978 rainy season, 1988 dry season, and 2002 rainy season images were reliably cloud free and had good visible resolutions that gave a good classification of the ten considered images. The land use and land cover classes influenced by cloud cover, SCL, and bad reflections were excluded from the results and data analysis. The most affected class was major settlement. That class was confused with cloud cover in many images because the adopted classification method (Maximum Likelihood algorithm) misinterpreted all white reflection as
111
settlements. It also misinterpreted clouds as enclosures and openfields type of settlement. Thus the two main settlement classes were exaggerated in cloud covered images. Thirdly, although classifications of all the images showed evidence of distinguishing the different land use and land cover classes, their identification relied on the author’s knowledge of the study area and from past field work, but without any recent ground truth data. Fourth, the spatial resolution of the data used varied from 1973 to 2007 (1973 to 1988: 57 x 79 m, 2001 to 2007: 28.5 x 28.5 m) complicating comparisons across time. In addition, the resolution of the Landsat MSS, TM, and ETM+ images could not be used to differentiate with precision particularly important threatened wetland habitats and watersheds at higher spatial resolution (for example, 10 m). Fifth, the study results do not show a clear linear trend in most of the related land use and land cover classes such as siltation and change in reservoir area cover. In some cases the results indicated a wide variation within a short period of time for the area covered for some classes suggesting that they could have likely been inaccurate. Sixth, there was the uncertainty of loss of some data and values when transferring the classified information from ENVI to ArcGIS 9.2 for spatial analysis. Seventh, spatially and temporally available data on rainfall could only be obtained from 1973 to 1992. This reduced the ability to analyze the correlation between the fluctuations in the water regime in the wetland area especially the reservoir water area from 1992 to present. 7.1
Future Perspectives and Recommendations The importance of this study is that it reveals the extent to which excessive human
intervening factors through diverse land use practices can significantly influence a
112
drainage basin response. The physical landscape is heavily exploited by the growing rural population whose livelihood depends on subsistence agropastoral practices on small family farms around openfields and enclosures within the drainage basin hillslopes. Within the Upper Noun drainage basin, the acquired Landsat images from 1973 to 2007 were used to quantify the past and the present landscape response to human action. This is therefore a study using satellite images to quantify the drainage basin response to human action based on comparative, past and present trends. The approach in this thesis can assist in estimating future environmental change and the design of conservation plans for the most threatened zones. Data in this study suggest that the Upper Noun drainage basin has witnessed loss in wetland, forest, and grazing area and may continue to do so if conservation measures are not put in place. Also, persistent utilization of the mixed farming and grazing zones, and deforestation especially on the hillslopes, suggest that sedimentation may continue silting the Bamendjin reservoir. Another use of the approach of this study is to monitor the reforestation and soil and water conservation (reforestation) programs for the Cameroon Western Highland plateau and similar areas in the rest of Sub Saharan Africa highlands. Further work needs to include data on the cultural values of the natural resources to the surrounding ethnic populations. The Upper Noun drainage basin is an example of a Sub Saharan Africa region whereby the available resources have played a leading role in influencing the settlement pattern and more especially multi-ethnic communities concentrated around the resources. Ethnic diversity, resource exploitation, and conservation strategies relationship should be studied in this area before adopting any policy. However, public awareness of the importance of protecting the watershed and the
113
wetlands can be enhanced by educating the population on the changes observed from satellite images. Change detection using Landsat images reveals a multitude of uncertainties as already observed above in the study evaluation. Other methods of change detection using high resolution sensors are recommended to be carried out in Upper Noun. Satellite sensors such as the AVHRR (Advanced Very High Resolution Radiometer) and MODIS (Moderate Resolution Imaging Spectroradiometer) could be used because these sensors have a higher temporal resolution but lower spatial resolution than the Landsat data used in this thesis. Such studies could focus on comparing change detection techniques for efficient land cover and land use data collection for conservation planning. Comparing land use and land cover change data from different methods and sensors can result in a higher degree of confidence in area cover change assessment both quantitatively and qualitatively for policy planners. Change detection techniques are summarized at length by Singh (1989) and Lu et al (2004) among many remote sensing researchers. 7.2
General conclusion Significant change has been detected in the Upper Noun drainage basin using
multispectral and temporal Landsat satellite images from 1978 to 2002. The overall objective of this study was to utilize remote sensing and GIS technology to determine the extent of change on the wetland area and the Upper Noun drainage basin from 1973 to 2007. Specific objectives were 1) to map land cover and related land use practices within the wetland and surrounding areas of the drainage basin using Landsat images from 1973 to 2007 using supervised maximum likelihood algorithm; 2) to map land use and land
114
cover classes by seasons in order to determine human-induced pressure on the wetland area and the drainage basin using available Landsat MSS, TM and ETM+ imagery; 3) to utilize GIS in confirming and finalizing the land use and land cover classes and delimitation of the Upper Noun drainage basin through incorporating auxiliary data from Cameroon such as settlement and hydrology. The study revealed a great deal of variation in the classes among the different Landsat scenes both during the dry season and rainy season. The classification criteria for land cover and land use classes for Upper Noun drainage basin using remote sensing and GIS revealed four different groups of classes that characterize this region. There were twelve different land cover and land use classes identified by the satellite imagery and they were grouped into: 1) the humid floodplain classes that make up the wetland area, 2) the agropastoral landscape, 3) the montane forest and 4) settlement. Data from 1978 to 2002 showed that the agropastoral landscape covered the largest area within the drainage basin. Some of the classes were not present in all the years and seasons because of agrarian reforms that introduced some land use practices such as the reservoir and land reclamation. For example the 1973 image had no reservoir but instead floodplain lakes, and small settlements with few identified enclosures. The data analysis revealed considerable change within the Upper Noun drainage basin from 1978 to 2002 (Figure 5.7 and Table 5.4). Within the wetland area in the floodplain, the reservoir showed evidence of a huge fluctuation in area since the construction of the Bamendjin dam in 1975 (Figures 5.8 and 5.10). Within the reservoir area, acute siltation has been observed since 1988 and is increasing in area (Figures 5.9 and 5.10). A significant drop in the area of permanent and seasonally flooded prairies was
115
observed (Figures 5.11 and 5.12). Irrigated farmlands also showed downward trends from 1988 to 2002 (Figure 14). Concerning the agropastoral landscape, the upland grazing (Figure 5.15) areas showed a general drop in area, while on the other hand, the mixed farming (Figure 5.16) area increased from 1978 to 2002. This is an indication of how prominent agriculture and animal rearing has become in this region of Cameroon. The Afromontane forest also decreased in area. However, it appeared to have recovered slightly in 2002 following the successful implementation of the Kilum/Ijim community forest management project. Settlement within the drainage basin expanded in area because of a rapid transformation of most enclosures and openfields to larger villages and major settlements (Figure 5.20). As these enclosures and openfields have been growing into large settlements, the existing major settlements also have been spreading out and this growth was observed as being mostly restricted to areas around the different ethnic groupings especially in the Ndop floodplain. .
116
8
References
Alex, H., T. Catherine, L. L., and W. Nicole. 2003. High resolution mapping of tropical mangrove ecosystems using hyperspectral and radar remote sensing. International Journal of Remote Sensing, 24:13, 2739-2759. Asanga, C. 2002. Case study of exemplary forest management in Central Africa: community forest management at the kilum-Ijim mountain forest region, Cameroon. Forest Management Working Papers, Working Paper FM/11. Forest Resources Development Service, Forest Resources Division. FAO, Rome. http://www.fao.org/forestry/
Austen, A. R., 1996. Mythic transformation and historical continuity: The Duala of Cameroon and German colonialism, 1884-1914. In, Ian Fowler and David Zeitlyn 1996. African Crossroads: Intersections between history and anthropology in Cameroon. Berghahn Books, Providence, Oxford. Pp 63-80. Baghdadi, N., Bernier, M., Gauthier, R. and Neeson, I. 2001. Evaluation of C-band SAR data for wetlands mapping. International Journal of Remote Sensing, 22:1, 71-88 Baker, C., Lawrence, R. L., Montagne,C. and Patten, D. 2007. Change detection of wetland ecosystems using Landsat imagery and change vector analysis. Wetlands, 27: 3, 610-619. Bauer, M. E., Yuan, K.E. and Sawaya. 2003. Multi-temporal Landsat image classification and change analysis of land cover in the twin cities (Minnesota) metropolitan area. MutiTemp-2003, Second International Workshop on the Analysis of Multi-temporal Remote Sensing Images, July 16-18, 2003. Ispra, Italy. Bayemi, P. H., Bryant, M. J., Pingpoh, D., Imele, H., Mbanya, H., Tanya, V., Cavestany, D., Awoh, J., Ngoucheme, .A., Sali, D., F Ekoue, F., Njakoi, H., and Webb, E. C. 2005. Participatory Rural Appraisal of Dairy Farms in the North West Province of Cameroon. Livestock Research for Rural Development, 17 (6). http://www.cipav.org.co/lrrd/lrrd17/6/baye17059.htm Birdlife International Cameroon, 2008. Kilum Ijim forest project, Cameroon. http://www.birdlife.org/action/ground/bamenda/bamenda3.html , http://www.birdlife.org/action/ground/bamenda/index.html Boutrais, J, and O.R.S.T.O.M. (Agency: France). 1974. Étude d'une zone de transhumance, la plaine de Ndop, Cameroun - Study of a dry season grazing area, the Ndop plain, Cameroon. Yaoundé: Centre ORSTOM de Yaoundé.
117
Bruzzone, L., and Serpico, S. B. 1997. Detection of changes in remotely sensed images by the selective use of multi-spectral information. International Journal of Remote Sensing, 18, 3883-3888. Cameroon: History – A millennium Past - 2004 Presidential http://www.presidentielle2004.gov.cm/showdoc.php?rubr=6000&srubr=6104&la ng=en&tpl=2 Cameroon post. September 2007. 7,000 rice farmers trained on improved production. http://www.postnewsline.com/2007/09/7000-rice-farme.html Cameroon Timeline, (2008). A time line overview of big and small events in the history of Cameroon. http://crawfurd.dk/africa/cameroon_timeline.htm Chavez, P.S. Jr. 1988. An improved dark-object subtraction technique for atmospheric scattering correction of multispectral data. Remote Sensing of the Environment, 24, 459-479. Chen, L. C. 1998. Detection of shoreline changes for tideland areas using multitemporal satellite images. International Journal of Remote Sensing, 19:17, 33833397. Chen, Y., Jing, L., Bo, Y., Shi, P. and Zhang, S. 2007. Detection of coal fire location and change based on multi-temporal thermal remotely sensed data and field measurements. International Journal of Remote Sensing, 28:15, 3173-3179. Chilver, E. M, and Kaberry, P. M. 1965. Sources of Nineteenth-Century slave trade: The Cameroons Highlands. Journal of African History, 6:1, 117-120. Chilver, E. M, and Kaberry, P. M. 1968. Traditional Bamenda: The Pre-colonial History and Ethnography of the Bamenda Grassfields. Buea, Ministry of Primary Education and Social Welfare and West Cameroon Antiquities Commission. 25p. Christensen, E. J., Jensen, J. R., Ramsey, E. W. and Mackey JR., H. E. 1988. Aircraft MSS data registration and vegetation classification for wetland change detection. International Journal of Remote Sensing, 9:1, 23-38. Civco, D. L., J. D. Hurd, E. H. Wilson, M. Song, and Z. Zhang. 2002. A Comparison of Land Use and Land Cover Change Detection Methods. 2002 ASPRS-ACSM Annual Conference and FIG XXII Congress April 22-26. Coppin R. and Bauer E. 1994. Processing of Multitemporal Landsat TM Imagery to Optimize Extraction of Forest Cover Change Features. IEEE Transactions on
118
Geosciences and Remote Sensing, 32: 4, 918-921. Coppin, P., Jonckheere, I., Nackaerts, K., Muys, B. and Lambin, E. 2004. Digital change detection methods in ecosystem monitoring: a review. International Journal of Remote Sensing, 25, 1565-1596. Course, J. P. 1965. Project de Developpement rural de la plain de Ndop dans le Nord du Cameroun occidentale. Project devis, carte, 3 Fasc. Dewidar, K. M. 2004. Detection of land use/land cover changes for the northern part of the Nile delta (Burullus region), Egypt. International Journal of Remote Sensing, 25:20, 4079-4089. Dixon, B. and Candade, N. 2008. Multispectral land use classification using neural networks and support vector machines: one or the other, or both? International Journal of Remote Sensing, 29:4, 1185-1206. Diuk-Wasser, M. A., Bagayoko, M., Sogoba, N., Dolo, G., Touré, M. B., Traoré, S. F. and Taylor, C. E. 2004. Mapping rice field anopheline breeding habitats in Mali, West Africa, using Landsat ETM+ sensor data. International Journal of Remote Sensing, 25:2, 359-376. Dongmo, J. L. 1983. “Le role de l’homme à traverse ses activités agricoles et pastorale dans l’evelutions des milieu Naturelles sur les hautes terres de l’ouest Cameroon” In Cameroon Geographical Review, Yaounde. 4:1. 108-116. Dongmo, J. L. 1989. Colonisation Agricole de pentes du Mont Oku (Cameroun). Zambia Geographic Ahaoc, Lusaka, Pp 183-209. Elmar Csaplovics, Environmental Monitoring of Tropical Wetlands in Semi-Arid Sub-Saharan Africa – What About Remote Sensing? Encyclopedia of the Nations. 2008. Cameroon Energy and Power. http://www.nationsencyclopedia.com/Africa/Cameroon-ENERGY-ANDPOWER.html ESRI. 2007. ArcGIS 9.2 Environmental Systems Research Institute, Inc. GIS Software Fanso, V. G., and Chem-Langhee, B. 1996. Nso’ military organization and warfare in the nineteenth and twentieth centuries. In, Ian Fowler and David Zeitlyn 1996. African Crossroads: Intersections between history and anthropology in Cameroon. Berghahn Books, Providence, Oxford. Pp 101-114 Fogwe, Z. N. 1990. “Ndop-Sabga Great Erosion Arc; physical Milieu Land use and Erosion Risks”. Maitrise thesis, Department of Geography, University of
119
Yaounde, 125p. Folack, J. and Galega, P. 1998. Cameroon Coastal profile. Final Reports, Project ee/RAF/92/G34/RCV.B; Yaounde. Fonjong, L. N. and Mbah, F. A. 2007. The Fortunes and Misfortunes of Women Rice Producers in Ndop, Cameroon and the Implications for Gender Roles. Journal of International Women’s Studies, 8:4, 133-147. Frazier, P., Page, K., Louis, J., Briggs, S., and Robertson, A.I. 2003. Relating wetland inundation to river flow using Landsat TM data. International Journal of Remote Sensing, 24, 3755-3770. Gautier, D. 1994. Fondements naturels et sociaux d’un bocage tropical : l’exemple Bamiléké. Revue de Geographie du Cameroun. University of Yaounde I, 8:2, 160-183. Gerrish, G. A. 2005. Ethnic and Geographic Distribution of Natural Resource Management Strategies in the Tchabal Mbabo Region, Cameroon. A thesis submitted to the Graduate Faculty of North Carolina State University in partial fulfillment of the requirements for the Degree of Master of Science. 163pp. Ghanavati, E., Firouzabadi, P. Z., Jangi, A. A. and Khosravi, S. 2008. Monitoring geomorphologic changes using Landsat TM and ETM+ data in the Hendijan River delta, southwest Iran. International Journal of Remote Sensing, 29:4, 945-959. Hawkins, P. and Brunt, M. 1967. The soils and Ecology of West Cameroon. Report to the Government of Cameroon; Expanded programme of Technical Assistance, vol. 1 and II, No 2038, FAO, Rome. 516pp. http://eusoils.jrc.it/esdb_archive/EuDASM/Africa/lists/all_k10.htm
Hayes, D. J and Sader, S. A. 2001. Comparison of change-detection techniques for monitoring tropical forest clearing and vegetation regrowth in a time series. Photogrammetric engineering and remote sensing, 67:9, 1067-1075. Henebry, G. M. 1993. Detecting change in grasslands using measures of spatial dependence with Landsat TM data. Remote Sensing of Environment, 46, 223234. Heo, J., and Fitzhugh, T. W. 2000. A standardized radiometric normalization method for change detection using remotely sensed imagery. Photogrammetric Engineering and Remote Sensing, 66, 173-182. Houhoulls, P.F. and Michener, W. K. 2000. Detecting wetland change: a rule-based approach using NWI and SPOT-XS data. Photogrammetric Engineering and
120
Remote Sensing, 66, 205-211. Howarth, P. J. and Wickware, G. M. 1981. Procedures for change detection using Landsat digital data. International Journal of Remote Sensing, 2:3, 277-291. Im, J., Jensen, J. R. and Tullis, J. A. 2007. Object-based change detection using correlation image analysis and image segmentation. International Journal of Remote Sensing, 29:2, 399-423. IUCN, 1997. Rehabilitation of the Waza-Logone floodplain – Republic of CameroonProposals for Priority studies. IUCN Regional Office Yaounde, Cameroon. Iverson, R., and Risser G. 1987. Analysing long-term changes in vegetation with GIS and remotely sensed data. Space Research, 7:11, 183-194. Jensen, J. R., Ramsay, E. W., Mackey, H. E., Christensen, E. J., and Sharitz, R. P. 1987. Inland wetland change detection using aircraft MSS data. Photogrammetric Engineering and Remote Sensing, 53, 521-529. Jensen, J. R., Rutchey, K., Koch, M. S., and Narumalani, S. 1995. Inland wetland change detection in the everglades water conservation area: using a time series of normalized remotely sensed data. Photogrammetric Engineering and Remote Sensing, 61, 199-209. Jensen, J. R et al. 1993. Measurement of seasonal and yearly cattail and waterlily changes using multidate SPOT panchromatic data. Photogrammetric engineering and remote sensing, 59:4, 519-525. Jensen, J. R. 2005. Introductory digital image processing: a remote sensing perspective. Pearson Prentice Hall, Upper Saddle River, third edition. Jinghui, L., Y. Kun, F. Xiangtao, S. Yun, and S. Yang. 1989. Monitoring and Analysis of Changes of Wetlands and Tidal flat Environment in the Yangtze River Estuary. International Journal of Remote Sensing, 10, 989-1003. Kashaigili, J. J. B. P. Mbilinyi, M. Mccartney, F. L. Mwanuzi. 2006. Dynamics of Usangu plains wetlands: Use of remote sensing and GIS as management decision tools. Physics and Chemistry of the Earth, 31, 967-975. Kengne, F. and Georges, C. 2000. Societes et Environment au Cameroun. Revue de Geographie du Cameroun. University of Yaounde I. 14: 2, 133-153. Kiage, L. M., Liu, K. -B., Walker, N. D., Lam, N. and Huh, O. K. 2007. Recent landcover/use change associated with land degradation in the Lake Baringo catchment, Kenya, East Africa: evidence from Landsat TM and ETM+.
121
International Journal of Remote Sensing, 28:19, 4285-4309. Kwarteng, A. Y. and Chavez Jr, P. S.1998. Change detection study of Kuwait City and environs using multi-temporal Landsat Thematic Mapper data. International Journal of Remote Sensing, 19:9, 1651-1662. Lambi, C. M. 1999. The Bamendjin Dam of the Upper Noun Valley of Cameroon: No Human Paradise. Readings in Environmental Education Project. University of Strathcleydes, Glasgow-Scotland. Lambi, C. M. 2001. Environmental Constraints and Indigenous Agricultural Intensification in Ndop plain (Upper Noun Valley of Cameroon). In, Lambi, M, C and Eze B.E, Reading in Geography, Pp, 179 – 190. Larison, B., Smith, T.B., Fotso, R., McNiven, D., Holbrook, K. and A. Lamperti. 1995. Surveys of selected montane and lowland areas of Cameroon Preliminary report to WWF Cameroon. Yaoundé, Cameroon: WWF. Lesinge, E, and Gartland, S. 1997. Background information for proposal to classify Waza as a RAMSAR site. WWF Cameroon Program Office, Yaounde. Letouzey, R. 1985. Notice de la carte phytogeographique du Cameroun – Regional afro-montagnarde et sub montagnarde. Institute de la carte Internationale de la Vegetation, Toulouse, Franc Liu, Y., NishidaI, S. and Yano, T. 2004. Analysis of four change detection algorithms in bitemporal space with a case study. International Journal of Remote Sensing, 25, 2121-2139. Lu, D., Mausel, P., Brondízio, E. and Moran, E. 2004. Change detection techniques. International Journal of Remote Sensing, 25:12, 2365-2401. Lunetta, R.S., Johnson, D.M., Lyon, J.G. and Crotwell, J. 2004. Impacts of imagery temporal frequency on land-cover change detection monitoring. Remote Sensing of Environment, 89, 444-454. Ma, M., Wang, X., Veroustraete, F. and Dong, L. 2007. Change in area of Ebinur Lake during the 1998-2005 period. International Journal of Remote Sensing, 28:24, 5523-5533. Maldonado, F. D., Santos, J. R. and Graça, P. M. L. 2007. Change detection technique based on the radiometric rotation controlled by no-change axis, applied on a semi-arid landscape', International Journal of Remote Sensing, 28:8, 1789-1804 Marcelo, C., L. Cohen and Rubén J. L. 2003. Temporal changes of mangrove
122
vegetation boundaries in Amazônia: Application of GIS and remote sensing techniques. International Journal of Remote Sensing, 11:4, 223-231. Mas, J. F. 1999. Monitoring land-cover changes: a comparison of change detection techniques. International Journal of Remote Sensing, 20:1, 139-152. Mbenkum, T. 1997. Background and technical information for proposal to classify Waza National Park Cameroon as a Ramsar site and presentation of other Wetlands for addition into the list at a later stage. Ministry of Environment and Forestry, Yaounde Cameroon. Mbenkum, T. 1999. Wetland types in Cameroon: Ecological Biological and Socio Economic Function. In: Regional Workshop on the Accession and Implementation of the Ramsar Convention on Wetlands of international Importance. August 21-24, Yaounde - Cameroon MINAGRI, 1972. “Project de Mise en Valeur de la Haute Vallee du Noun”. CompteRendu de Tournee. Yaounde. 40p. MINAGRI, 1977. “Etude de Facilité pour passage à 3000 ha de riziere dans la hautevallee du Noun”. TOME I, Yaounde. 33p. MINAGRI, 1984. UNVDA-Information for the 1984 Bemenda Agro-pastoral show. MINAGRI, 1987. “ Amenagment de 3000 ha de riziere dans la Haute vallee du Noun” – Avant projet detaille – Yaounde. 45p. MINAGRI, Ngoketunjia. 2000. Divisional Delegation. Annual Report. MINEF, Ngoketunjia. 2002. Annual Report, Divisional Delegation of Environment and Forestry, 2001-2002. 22p. MINEPIA, Ngoketunjia. 2002. Divisional Delegation, Annual report for Livestock production and transhumance. 27p. MINEPIA, Ngoketunjia. 2003. Divisional Delegation, Semester report for period January – June 2003 on Fishery production. 12p. Minter,W. 1998. Structural Adjustment Programs (SAPs) and Their Impact in the 1980s. In Africa’s problems, Africa’s initiatives: African Alternative Framework to Structural Adjustment Programs for Socio-Economic Recovery and Transformation. Chapter three. Africa Policy Information Center. http://www.africaaction.org/african-initiatives/aaf3.htm Mitsch, W. J. and Gosselink, J. G. 2000. Wetlands. Wiley, New York, third edition,
123
920pp. Moisan, Y., M. M. Bernier and Dubois, M. 1999. Detection des changements dans une serie d'images ERS-1 multidates a l'aide de l'analyse en composantes principales. International Journal of Remote Sensing, 20:6, 1149-1167. Mouafo, D., Fotsing, É., Sighomnou, D., and Sigha, L. 2002. Dam, Environment and Regional Development: Case Study of the Logone Floodplain in Northern Cameroon. International Journal of Water Resources Development, 18:1, 209219. Muñoz-Villers, L. E. and López-Blanco, J. 2007. Land use/cover changes using Landsat TM/ETM images in a tropical and biodiverse mountainous area of central-eastern Mexico. International Journal of Remote Sensing, 29:1, 71-93. Munro, D.C., and Touron, H. 1997. The estimation of marshland degradation in southern Iraq using multitemporal Landsat images. International Journal of Remote Sensing, 18, 1597-1606. Munyati, C . 2000. Wetland change detection on the Kafue Flats, Zambia, by classification of a multitemporal remote sensing image dataset. International Journal of Remote Sensing, vol. 21, no. 9, 1787–1806. Mzeka, N.P. 1980. The core culture of Nso. Jerome Radin Co., Agawam, Ma. 01001, U.S.A. Ndueh, L. 1990. The Resettlement process in Upper Noun Valley (UNV). Maitrise thesis, Department of Geography, University of Yaounde. 98p. Ndzeidze, S. K. 2001. Change in ecological character of wetlands. The case of the Ber plain in Bui Division. Maitrise thesis, Department of Geography, University of Yaounde 1. 149p. Ndzeidze, S. K. 2004. Socio-economic and ecological implications of related land use practices on wetlands in the Ndop flood pain: Upper Noun Valley Drainage Basin Cameroon. DEA project, Department of Geography, University of Yaounde I, 101p. Nelson, A., Soronno, P and Qi, J. 2002. Land-Cover Change in Upper Barataria BasinEstuary, Louisiana, 1972–1992: Increases in Wetland Area. Environmental Management, 29: 5, 716-727. Neuenschwander, A.L. and Crews-Meyer, K.A. 2006. Multi-temporal Mapping of Disturbances in the Okavango Delta, Botswana using Landsat TM and ETM+ data. In Proceedings of the 2006 IEEE International Geoscience and Remote Sensing Symposium, 4, 2080-2083.
124
Ngang, A. 1998. The Environmental Resources and Associated Developmental Problems of wetlands: A case study of Bamunka. – Anniversary Lecture, Wetlands day Bamenda, Cameroon. 35p. Ngwa, C. A. 2003. Development Authorities as Agents of Socio-Economic Change: An Historical Assessment of the Upper Nun Valley Development Authority in Ndop Region of Cameroon, 1970-1995. Nordic Journal of African Studies, 12:2, 220–237. Ngwa, E. N. 1979. Swamp Rice Production in the North west Province of Cameroon, A case study of Agricultural Innovation Diffusion Among Traditional Agrarian Communities. Master’s Thesis, Department of Geography, University of Yaounde. Ngwa, E. N. 1985. Innovation Agencies and smallholder Agriculture in the upper Noun Basin and its Environs: A River Basin Approach. Doctorate dissertation, University of Yaounde. 574p. Ngwa, E. N. 2000. Local community efforts towards sustainable managements of base line Natural Resources in Northwest and west Cameroon. In, Kengne Fodouop et Georges Courade, Societes et Environment au Cameroun, revue de Geographie du Cameroun. University of Yaounde I, 14:2, 133-153. Nkwemoh, C. A. 1998. The Impact of Agro-pastoral Activities on the physical Environment of the Mezam Ngoketunjia Area. Doctorate de 3ème cycle Department of Geography, University of Yaounde I. 374p Oijen, C. and Kemdo, E. 1986. Les Yaeres releves; une phytoecologique de la plain d’inondation du Logone, Nord-Cameroun en 1985. Serie Environement et developpement au Nord Cameroun. Center for Environmental Studies, Leiden University, the Netherlands. Owor, M., A. Muwanga and W. Pohl. 2007. Wetland change detection and inundation north of Lake George, western Uganda using Landsat data. African Journal of Science and Technology (AJST), Science and Engineering Series, 8:1, 94-106. Parmuchi, M., Karszenbaum, H. and Kandus, P. 2002. Mapping wetlands using multitemporal RADARSAT-1 data and a decision-based Classifier. Journal of Remote Sensing, 28: 2, 175-186. Peterson, U. and Aunap, R. 1998. Changes in agricultural land use in Estonia in the 1990s detected with multitemporal Landsat MSS imagery. Landscape and urban planning, 41:3-4, 193-201.
125
Petit, C. C., and Lambin, E. F. 2001. Integration of multi-source remote sensing data for land cover change detection. International Journal of Geographical Information Science, 15, 785-803. Pietroniro, A. and Töyr, J. 2002. A Multi-Sensor Remote Sensing Approach for Monitoring Large Wetland Complexes in Northern Canada. IEEE Transactions on Geosciences and Remote Sensing, pp 1070-1072. Pietroniro, A., T. Prowse and D. L. Peters. 1999. Hydrologic assessment of an inland freshwater delta using multi-temporal satellite remote sensing. Hydrological Processes 13, 2483-2498. Ramsar Convention Secretariat. 2007. Managing groundwater: Guidelines for the management of groundwater to maintain wetland ecological character. Ramsar handbooks for the wise use of wetlands, 3rd edition, vol. 9. Ramsar Convention Secretariat, Gland, Switzerland. http://www.ramsar.org/lib/lib_handbooks2006_e09.pdf Ramsar Convention Secretariat. 2007. Participatory skills: Establishing and strengthening local communities’ and indigenous people’s participation in the management of wetlands. Ramsar handbooks for the wise use of wetlands, 3rd edition, vol. 5. Ramsar Convention Secretariat, Gland, Switzerland. http://www.ramsar.org/lib/lib_handbooks2006_e05.pdf Ramsar Convention Bureau, 2008. The Ramsar List of Wetlands of International Importance. Key Documents of the Ramsar Convention. Ramsar Convention Secretariat, Gland, Switzerland. http://www.ramsar.org/key_sitelist.htm Röder, A., J. Hill, B. Duguy, J. A. Alloza, R. Vallejo. 2008. Using long time series of Landsat data to monitor fire events and post-fire dynamics and identify driving factors. A case study in the Ayora region (eastern Spain). Remote Sensing of Environment 112, 259-273. Roger, J., Franklin, J., and Roberts, D. A. 2002. A comparison of methods for monitoring multitemporal vegetation change using Thematic Mapper imagery. Remote Sensing of Environment, 80, 143-156. Shaikh, M., Green, D., and Cross, H. 2001. A remote sensing approach to determine environmental flows in wetlands of the Lower Darling River, New South Wales, Australia. International Journal of Remote Sensing, 9, 1737-1751. Singh, A. 1986. Change detection in the tropical forest environment of northeastern India using Landsat. In Remote Sensing and Tropical Land Management, edited by M. J.Eden and J. T. Parry (New York: J. Wiley), pp 237-254.
126
Singh, A. 1989. Digital change detection techniques using remotely sensed data. International Journal of Remote Sensing, 10, 989-1003. Singh, V. P. and Singh, A. N. 1996. A remote sensing and GIS-based methodology for the delineation and characterization of rain-fed rice environments. International Journal of Remote Sensing, 17:7, 1377-1390. Sushuu, C, Bongadzem. 2007. Transhumance and its implication on the wetlands of Ndop central sub division. Maitrise thesis, Department of Geography, University of Yaounde 1. 109p. Tadu dairy production report, 2008. The implementation process. http://www.coopdevelopmentcenter.coop/CDP%20case%20studies/LOLCase Study.pdf Tchawa, P. 1991. Dynamique des paysages sur la retombée méridionale des hauts plateaux de l’ouest Cameroun. Revue de Geographie du Cameroun. University of Yaounde I, 2:7, 220-243. Tchindjang M. 1996. Le Bamiléké central et ses bordures. Morphologie régionale et dynamique des versants, études géomorphologiques. Revue de Geographie du Cameroun. University of Yaounde I, 10:3, 120-143. Tokola, T., Lofman, S. and Erkkila, A. 1999. Relative calibration of multitemporal Landsat data for forest cover change detection. Remote Sensing of Environment, 68, 1-11. Townsend, P. A. 2001. Mapping Seasonal Flooding in Forested Wetlands Using Multi-Temporal Radarsat SAR. Photogrammetric Engineering and Remote Sensing, 67:7, 857-864. Wang, Y., Bonynge, G., Nugranad, J., Traber, M., Ngusaru, A., Tobey, J., Hale, L., Bowen, R. and Makota, V. 2003. Land Cover Change and Impacts on Tanzania Coast: A Study of Geographic Information and Sustainable Development. ASPRS 2003 Annual Conference Proceedings May 2003. Anchorage, Alaska. Wang, Y., Bonynge, G., Nugranad, J., Traber, M., Ngusaru, A., Tobey, J., Hale, L., Bowen, R. and Makota, V. 2003. Remote Sensing of Mangrove Change along the Tanzania Coast. Marine Geodesy, 26:1, 35-48. Warnier, J.P. and Fowler, I. 1979. A nineteenth century Ruhr in central Africa. Africa, 49:4, 329-351. Wirngo, G. B. 1989. Rice production in Wasi-Ber under the Directive of the UNVDA.
127
DEPI, History/Geography Department, Bambili, University of Yaounde I.81p WWF. 1999. The RAMSAR Convention – A Call for Regional Accession and Implementation. WWF, Yaounde, Cameroon. 8p. XIA, L. R. Ruan, and Xingnan Zhang. 2007. Change detection of wetland in Hongze Lake using a time series remotely sensed imagery. ISPRS Workshop on Updating Geo-spatial Databases with Imagery & the 5th ISPRS Workshop on DMGISs held in Urumqi, China 28-29 August 2007. Xiuwan, C. 2002. Using remote sensing and GIS to analyze land cover change and its impacts on regional sustainable development. International Journal of Remote Sensing, 23:1, 107-124. Yang, X. and Lo, C.P. 2002. Using a time series of satellite imagery to detect land use and land cover changes in the Atlanta, Georgia metropolitan area. International Journal of Sensing, 18, 3883-3888. Yang, X., Damen, M. C. J. and Van Zuidam, R. A. 1999. Use of Thematic Mapper imagery with a geographic information system for geomorphologic mapping in a large deltaic lowland environment. International Journal of Remote Sensing, 20:4, 659-681. Yaw, A. T., and Edmund, C. M. 2007. Using Remote Sensing and GIS in the Analysis of Ecosystem Decline along the River Niger Basin: The Case of Mali and Niger. International Journal of Environmental Research and Public Health, 4:2, 173-184. Yong, D., Philippe, M. T. and Cihlar, J. 2002. Radiometric normalization of multitemporal high-resolution satellite images with quality control for land cover change detection. Remote Sensing of Environment, 82, 123-134. Yuan, F. 2008. Land-cover change and environmental impact analysis in the Greater Mankato area of Minnesota using remote sensing and GIS modeling. International Journal of Remote Sensing, 29:4, 1169-1184. Zhao, G. X., Lin, G. and Warner, T. 2004. Using Thematic Mapper data for change detection and sustainable use of cultivated land: a case study in the Yellow River delta, China. International Journal of Remote Sensing, 25:13, 2509-2522. Zhou, Q., Li, B. and Kurban, A. 2008. Trajectory analysis of land cover change in arid environment of China. International Journal of Remote Sensing, 29:4, 10931107. Zoran, M. E. 2006. The use of multi-temporal and multispectral satellite data for
128
change detection analysis of the Romanian Black Sea coastal zone. Journal of optoelectronics and advanced materials, 8:1, 252-256.