Behavioral Interventions Behav. Intervent. 26: 103–124 (2011) Published online 28 March 2011 in Wiley Online Library (wileyonlinelibrary.com) DOI: 10.1002/bin.328
DETECTING CHANGES IN SIMULATED EVENTS USING PARTIAL‐INTERVAL RECORDING AND MOMENTARY TIME SAMPLING III: EVALUATING SENSITIVITY AS A FUNCTION OF SESSION LENGTH Sherise L. Devine1, John T. Rapp1*, Jennifer R. Testa1, Marissa L. Henrickson1 and Gabriel Schnerch2 1
St. Cloud State University, St. Cloud, MN 56301‐4498, USA 2 University of Manitoba, Winnipeg, Manitoba, Canada
In a series of two studies, we graphed simulated data representing continuous duration recording and continuous frequency recording into ABAB reversal designs depicting small, moderate, and large behavior changes during 10‐min, 30‐min, and 60‐min sessions. Data sets were re‐scored using partial‐ interval recording and momentary time sampling with interval sizes set at 10 s, 20 s, 30 s, 1 min, and 2 min. In study 1, we visually inspected converted data for experimental control and compared the conclusion with those from the respective continuous duration recording or continuous frequency recording data to test for false negatives. In study 2, we evaluated the extent to which interval methods that were sensitive to changes in study 1 produced false positives. In part, the results show that momentary time sampling with interval sizes up to 30 s detected a wide range of changes in duration events and frequency events during lengthier observation periods. The practical implications of the findings are briefly discussed. Copyright © 2011 John Wiley & Sons, Ltd.
Since its inception, the field of applied behavior analysis has been interested in the accurate measurement of behavior (Baer, Wolf, & Risley, 1968). Although research on various behavioral recording methods is now in its fourth decade, a number of important issues have yet to be addressed. From a practical standpoint, discontinuous recording methods may offer some advantages over continuous recording methods, such as lower response effort and greater ease for scoring multiple target events; however, the former may not detect the same behavior changes as the latter. Historically, the use of discontinuous forms of data collection in the behavior‐ analytic literature has been quite high (Kelly, 1977; Rapp et al., 2007). Although numerous studies have compared discontinuous recording methods to continuous *Correspondence to: John T. Rapp, St. Cloud State University, Education Building, A 261, 720 4th Avenue South, St. Cloud, MN 56301‐4498, USA. E‐mail:
[email protected] Copyright © 2011 John Wiley & Sons, Ltd.
104
S. L. Devine et al.
measures of behavior (Alvero, Struss, & Rappaport, 2007; Ciotti‐Gardenier, MacDonald, & Green, 2004; Green & Alverson, 1978; Green, McCoy, Burns, & Smith, 1982; Gunter, Venn, Patrick, Miller, & Kelly, 2003; Hanley, Cammilleri, Tiger, & Ingvarsson, 2007; Harrop & Daniels, 1986; Harrop, Daniels, & Foulkes, 1990; Kearns, Edwards, & Tingstrom, 1990; Murphy & Goodall, 1980; Powell, Martindale, & Kulp, 1975; Powell, Martindale, Kulp, Martindale, & Bauman, 1977; Powell & Rockinson, 1978; Repp, Roberts, Slack, Repp, & Berkler, 1976; Saudargas & Zanoli, 1990; Test & Heward, 1984), a limitation common to each study is that the sensitivity of discontinuous methods for detecting behavior changes was not evaluated using single‐subject experimental designs (Rapp, Colby‐Dirksen, Michalski, Carroll, & Lindenberg, 2008). In a recent examination of articles published in the Journal of Applied Behavior Analysis between the years of 1995 and 2005, Mudford, Taylor, and Martin (2009) found that 45% used discontinuous methods such as partial‐interval recording (PIR) and momentary time sampling (MTS). Although the percentage of programs that rely on measurement with interval recording methods in applied settings has not been reported in the literature, it is likely that it is comparable with or higher than what was reported by Mudford and colleagues for published studies in the Journal of Applied Behavior Analysis. Thus, it is important to determine whether such methods detect the same behavior changes as continuous measures. To this end, some recent studies have evaluated the extent to which certain interval recording methods produce false negatives (failing to detect experimental control when present) or false positives (detecting experimental control when not present) when measuring changes in duration events or frequency events (Carroll, Rapp, Colby‐Dirksen, & Lindenberg, 2009; Meany‐Daboul, Roscoe, Bourret, & Ahearn, 2007; Rapp et al., 2007, 2008). This relatively new line of research is important if behavior analysts continue to use interval methods to evaluate the effects of independent variables (interventions) on dependent variables (behavioral excesses or deficits). For example, Meany‐Daboul et al. (2007) converted five data sets for which experimental control of an intervention was demonstrated with continuous duration recording (CDR) or continuous frequency recording (CFR) into 10‐s PIR and 10‐s MTS (with a 2‐s observation window). Meany‐Daboul et al. found that both PIR and MTS produced data paths that led to accurate decisions regarding demonstrations of experimental control; however, expert judges indicated that data produced with MTS were more similar to CDR data, and data produced with PIR were more similar to CFR data. The authors suggested that PIR and MTS may fail to detect small behavior changes, which may lead to the premature discontinuation of potentially effective treatments. In the first of a series of three experiments, Rapp et al. (2008) evaluated the sensitivity of PIR and MTS for detecting small (changes of 33% or less from an A phase to a B phase), moderate (changes of 34% to 66% from an A phase to a B phase), Copyright © 2011 John Wiley & Sons, Ltd.
Behav. Intervent. 26: 103–124 (2011) DOI: 10.1002/bin
Detecting changes in simulated events
105
and large (changes of 67% or greater from an A phase to a B phase) relative changes in duration events between phases using ABAB reversal designs. Simulated data with absolute durations ranging from 25% to 75% within 10‐min sessions were generated; each percentage was generated with a low, medium, and high inter‐response time (IRT) to event‐run ratio. Data sets were re‐scored using 10‐s, 20‐s, 30‐s, 1‐min, and 2‐min interval sizes for both PIR and MTS and then plotted, visually inspected, and compared with the respective CDR data set. Rapp et al. (2008) found that approximately 70% of the small relative changes in duration events were detected using MTS with 10‐s intervals, whereas no interval sizes of PIR detected such change. Rapp et al. also found that 80% or more of the moderate to large relative changes in duration events were detected using MTS with interval sizes up to 30 s. Nevertheless, the authors found that only MTS with 10‐s intervals detected 80% or more of all changes in duration events. In the second study, Rapp et al. (2008) examined the sensitivity of various interval sizes MTS and PIR for detecting small, moderate, and large changes in frequency events. The authors generated behavior samples to simulate event rates between 0.75 and 8.0 rpm. Using the same procedures described for study 1, Rapp et al. found that 10‐s PIR detected approximately 80% of the small changes in rate events that were evident with CFR measures; only about 30% of those same behavior changes were detected by 20‐s PIR. As a whole, the results indicated that PIR with 10‐s intervals detected 80% or more of all changes in frequency events whereas no interval size of MTS met the 80% criterion. In the final study, Rapp et al. (2008) evaluated the extent to which interval methods produced false positives by comparing the low, moderate, and high IRT‐to‐event‐run ratios for each targeted percentage. For example, using an ABAB reversal design, the authors plotted the data for the low IRT‐to‐event‐run for 25% based on CDR in the A phases and data for the high IRT‐to‐event‐run for 25% based on CDR in the B phases. When the CDR data were plotted, experimental control was not demonstrated; however, if experimental control emerged after the data were converted to an interval method, it was considered a false positive. Rapp et al. found that for duration events, 10‐s PIR produced the highest percentage of false positives. By contrast, MTS, regardless of interval size, did not produce false positives for duration events or frequency events. The results for false negatives and false positives suggested that (i) 10‐s MTS was the most sensitive measure of changes in duration events; and (ii) 10‐s PIR was the most sensitive measure of changes in frequency events. One variable that has received very limited attention in the literature is that of session length. Studies by Meany‐Daboul et al. (2007) and Rapp et al. (2008) used only 10‐min sessions. To date, no study has evaluated the extent to which session length affects the sensitivity of interval methods for detecting experimental control of an independent variable on behavioral events. It is possible that using lengthier Copyright © 2011 John Wiley & Sons, Ltd.
Behav. Intervent. 26: 103–124 (2011) DOI: 10.1002/bin
106
S. L. Devine et al.
observation sessions could increase the sensitivity of one or more interval sizes of PIR or MTS for detecting changes in duration events, frequency events, or both. If larger interval sizes of PIR or MTS detect changes in behavioral events when used during lengthier observation periods, practitioners may be able to employ such methods in applied settings (e.g., public schools, business offices). Thus, research on the sensitivity of larger interval sizes of PIR and MTS during lengthier observations is warranted.
STUDY 1: EVALUATING FALSE NEGATIVES WITH DURATION EVENTS AND FREQUENCY EVENTS The first purpose of this study was to replicate the first study of the Rapp et al. (2008) investigation, which evaluated the sensitivity of various interval sizes of PIR and MTS for detecting changes in duration events and frequency events using 10‐min sessions. Rapp et al. found that only 10‐s MTS and PIR were sufficiently sensitive to a wide range of changes in duration events and frequency events, respectively; however, because near‐continuous observation is required with 10‐s intervals, neither method offers a practical advantage for observers in applied settings. The second purpose of this study was to determine whether the sensitivity of the same interval sizes of PIR and MTS increased when session length was increased to 30 and 60 min. If larger interval sizes of PIR or MTS can be used to detect behavior changes during lengthier observation periods, observers may be able to perform other duties while collecting data. For example, if an observer scored a target event during the 10th second of 1‐min interval using PIR, the observer would be free to engage in other activity until that interval elapsed.
Method Procedure Simulated data were produced in the same manner as described by Rapp et al. (2008) except that dice rolls were not converted into factors of 1, 2, or 3. We predicted that withholding the conversion would produce greater variability in the IRT‐to‐event‐run ratios produced within the simulated data sets. Continuous duration recording. We generated data by rolling one or more six‐ sided dice to produce six different simulated absolute durations of behavior as follows: 25%, 33%, 40%, 50%, 66%, and 75%. We generated three data sets representing low, medium, and high IRT‐to‐event‐run ratios for each of the six absolute durations (see Rapp et al., 2008). For example, a data set representing an absolute duration of 25% could consist of any one of the following three IRT‐to‐event‐run ratios: 3:1 (low ratio); Copyright © 2011 John Wiley & Sons, Ltd.
Behav. Intervent. 26: 103–124 (2011) DOI: 10.1002/bin
Detecting changes in simulated events
107
6:2 (medium ratio); and 9:3 (high ratio). The first number in each ratio represents the number of dice used to produce the IRT in seconds, and the second number in each ratio represents the number of dice used to produce the event run in seconds. Sessions with a low ratio are characterized by fewer but lengthier event runs that are separated by relatively short IRTs. By contrast, sessions with a high ratio are characterized by more but briefer event runs that are separated by relatively long IRTs. All three ratios produce an absolute duration of 25% by taking the second number divided by the first number plus the second number multiplied by 100%. For instance, for the low ratio, 1 divided by 4 multiplied by 100% equals 25%. Similarly, for the high ratio, 3 divided by 12 multiplied by 100% equals 25%. To add variability to the generated data, the length of individual IRT and event runs were determined by rolling a six‐sided die. Each number on the die represented a number of seconds (i.e., rolling a ‘two’ represented 2 s, whereas rolling a ‘six’ represented 6 s). Each IRT‐to‐event‐run ratio described previously represented the number of times a die was to be rolled to simulate individual lengths of IRTs versus individual lengths of event runs within each data set. For example, individual IRTs within a session simulated to have a 25% absolute duration using a low ratio (3:1) was determined by rolling three dice (outcomes were added together to represent each length of IRT in seconds). Likewise, individual event runs were determined by rolling one die (the value representing each length of event run in seconds). The IRTs and event runs were generated in an alternating fashion until the session was completed. For this example, IRT lengths could range anywhere from 3 s (the experimenter rolled three dice and each landed on ‘one’) to 18 s (the experimenter rolled three dice and each landed on ‘six’). Event‐run lengths could range anywhere from 1 s (the experimenter rolled one die and it landed on ‘one’) to 6 s (the experimenter rolled one die and it landed on ‘six’). Because the IRT‐to‐event‐run ratios were based on the means of both dimensions, event runs were equally distributed across simulated sessions. Data for 10‐min, 30‐min, and 60‐min sessions were produced in the manner described previously for low, medium, and high IRT‐to‐event‐run ratios for each targeted duration of behavior. As described by Rapp et al. (2008), a roll of ‘one’ indicated starting the session with an IRT, and a roll of ‘two’ indicated starting the session with an event run. Thereafter, dice rolling commenced according to whichever IRT‐to‐event‐run ratio was being used, and the data were scored using real time recording sheets (Rapp et al., 2008). This process produced simulated data sets that represented CDR data. Once the data for each session were generated, 10 copies were made for converting the data into 10‐s, 20‐s, 30‐s, 1‐min, and 2‐min PIR and MTS measures (Rapp et al., 2008). One data set, which comprised six sessions, was generated for each of the targeted durations. Two hundred and seventy CDR data sets were generated and plotted Copyright © 2011 John Wiley & Sons, Ltd.
Behav. Intervent. 26: 103–124 (2011) DOI: 10.1002/bin
108
S. L. Devine et al.
in reversal designs. A total of 2700 comparisons were generated for 10‐s, 20‐s, 30‐s, 1‐min, and 2‐min PIR and MTS. Continuous frequency recording. We generated data for events that occur at approximately 0.75, 2.0, 3.0, 4.0, 5.0, 6.0, 8.0, 13.0, and 20.0 responses per minute (rpm) during 10‐min, 30‐min, and 60‐min sessions using procedures similar to those described by Rapp et al. (2008). The IRTs for each rate were calculated by subtracting the targeted rate from 60 s and then dividing by the rate to obtain the mean IRT for the targeted rate. This formula was based on the assumption that each event occurred for 1 s. Next, one to five six‐sided dice were rolled for each rate to generate probabilistic, yet variable, IRTs. That is, the 1‐s events (i.e., frequency events) had an equal probability of occurring at various points throughout each session. The number of dice used was determined by dividing the IRT by the average roll (3.5 based on a six‐sided die). As the rates were based on probabilistic means, the calculated IRT and probabilistic IRT were not always equivalent. For example, an actual rate of 8 rpm has a mean IRT of 6.5 s; however, our method produced a probabilistic IRT of 7.0 s. The approximate values were sufficiently similar for the purpose of this study. In some cases, the values we produced by rolling dice were subjected to minor conversions. For example, a rate of 20 rpm has a mean IRT of 2 s; thus, a conversion was necessary to yield an average roll or IRT of 2 s. The need for conversion could have been eliminated by using a three‐sided die; however, these dice were more difficult to obtain and significantly more expensive. The formulas used to generate the rates are available from the second author. Sessions were generated by rolling the specified number of dice for each rate and then recording the events on data sheets equipped to accommodate 600 s (10 min), 1800 s (30 min), and 3600 s (60 min) sessions. Six sessions were generated for each targeted rate. Eighty‐one comparisons of CFR data sets were generated and plotted in reversal designs. Subsequently, we converted the data to 10‐s, 20‐s, 30‐s, 1‐min, and 2‐min PIR and MTS for a total of 810 comparisons.
Definitions The definitions used in this study were the same as those used by Rapp et al. (2008). An event was scored using PIR if it occurred anytime during the interval, whereas an event was scored using MTS if it occurred during the last second of the interval. ‘Experimental control’ was defined as no more than one overlapping data point between A and B phases within a reversal design. Thus, an observer could ignore one of the 12 data points in each graph when making a determination of whether experimental control was or was not demonstrated. ‘Sensitivity’ referred to the extent to which an interval method detected a change in a dependent variable (i.e., experimental control) that was depicted with the CDR or CFR measure. As Copyright © 2011 John Wiley & Sons, Ltd.
Behav. Intervent. 26: 103–124 (2011) DOI: 10.1002/bin
Detecting changes in simulated events
109
such, a false negative was produced when data based on a continuous measure depicted experimental control and the corresponding data for an interval method did not. Using a reversal design, we calculated the amount of behavior change by comparing the means of the two A phases with the means of the two B phases. Specifically, behavior change was determined by taking the smaller mean divided by the larger mean, subtracting that value from 1.0, and then multiplying it by 100%. Small behavior changes were defined as changes of 33% or less, moderate behavior changes were defined as changes of 34–66%, and large behavior changes were defined as changes of 67% or more. We referred to a given interval method of data collection as being sufficiently sensitive when it detected 80% or more of the changes that were detected by CDR or CFR. Put differently, an interval method was considered sensitive for detecting changes in duration events or frequency events when it produced false negatives for less than 20% of the sample.
Data Analysis We converted each simulated CDR session to a percentage of time measure by dividing the total number of seconds for which events were scored by the total session time in seconds and then multiplying by 100%. We converted each simulated CFR session into a rate measure by dividing the total number of scored events in a session by the total number of minutes in the session (i.e., 10, 30, or 60 min). Interval data for each session were converted to a percentage of intervals measure by dividing the number of scored intervals by the total number of intervals in the session and multiplying by 100%. The data produced for interval recording methods for each session were compared with the data produced by the original CDR or CFR measurement for that same session. The CDR, CFR, and the corresponding interval data were plotted and graphed into ABAB reversal designs with three data points (i.e., sessions) per phase. Based on the CDR or CFR data, each comparison was categorized as depicting small changes, moderate changes, or large changes in duration events or frequency events, respectively, between A and B phases. The CDR or CFR data were arranged within the line graphs, so there were no trends in any phase. Thereafter, PIR and MTS records were arranged to correspond with the respective CDR or CFR measure. Experimental control was determined by visually inspecting the CDR, CFR, PIR, and MTS data paths.
Interobserver Agreement A second independent observer calculated the absolute durations for 33% of the original CDR data sets. We calculated interobserver agreement (IOA) scores for CDR data on a minute‐by‐minute basis by comparing the results of the primary Copyright © 2011 John Wiley & Sons, Ltd.
Behav. Intervent. 26: 103–124 (2011) DOI: 10.1002/bin
110
S. L. Devine et al.
observer’s calculation with the results of the secondary observer’s calculation for the same data set (Rapp et al., 2008). For each minute, the lower value was divided by the higher value and multiplied by 100%. Agreement percentages for each minute in a given session were summed and divided by the total number of minutes in a session to arrive at a final percentage of agreement. The mean IOA score for calculations of absolute durations was 99.8 % (range, 99.2% to 100%). A second independent observer also converted 33% of the original CDR data sets into 10‐s, 20‐s, 30‐s, 1‐min, and 2‐min PIR and MTS. We calculated IOA scores (on an interval‐by‐interval basis) separately for each converted session by taking the number of agreements divided by the number of agreements plus disagreements multiplied by 100%. The mean IOA score for conversions of CDR to interval methods was 99.8% (range, 99.5% to 100%). Finally, a second observer visually inspected 100% of the line graphs for demonstrations of experimental control. We calculated IOA scores for the detection of experimental control on a comparison‐by‐comparison basis by taking the total number of agreements (both observers agreed that the graph demonstrated experimental control, or both observers agreed that the graph did not show experimental control) divided by the total number of agreements plus disagreements (one observer indicated that the graph showed experimental control but the other observer did not) and multiplying by 100%. The mean IOA score for detection of experimental control was 96.2% (range, 90.4% to 98.9%). A second observer independently scored the absolute frequency for 33% of the original CFR data. We calculated IOA scores for CFR data on a minute‐by‐minute basis by dividing the smaller count by the larger count and multiplying by 100%. Minute‐by‐minute agreement percentages were averaged across sessions to arrive at the final percentage of agreement. The mean IOA score for the calculation of rates was 99.9% (range, 99.5% to 100%). A second observer independently converted 33% of CFR data into 10‐s, 20‐s, 30‐s, 1‐min, and 2‐min PIR and MTS. We calculated IOA scores by comparing the two conversions on a minute‐by‐minute basis and then taking the number of agreements divided by the number of agreements plus disagreements and multiplying by 100%. Minute‐by‐minute agreement percentages were averaged across sessions to arrive at the final percentage of agreement. The mean IOA score for conversions to interval methods was 99.9% (range, 99.1% to 100%). We calculated IOA scores for conclusions regarding experimental control in the same manner as described for CDR. The mean IOA score for the determination of experimental control was 99.3% (range, 98.5% to 100%) across rate comparisons.
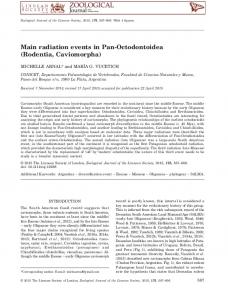
Results and Discussion Figures 1 and 2 contain representative line graphs depicting changes in sensitivity of MTS with lengthier sessions. Specifically, Figure 1 compares the targeted absolute Copyright © 2011 John Wiley & Sons, Ltd.
Behav. Intervent. 26: 103–124 (2011) DOI: 10.1002/bin
Detecting changes in simulated events
111
Figure 1. Targeted absolute durations of 33% medium to 50% high based on scoring with CDR and 30‐s MTS across A and B phases using 10‐min (first and second panels) and 30‐min (third and fourth panels) sessions for a small behavior change. Med, medium; CDR, continuous duration recording; MTS, momentary time sampling.
durations of 33% with the medium IRT‐to‐event‐run ratio to 50% with the high IRT‐to‐event‐run ratio based on scoring with CDR and 30‐s MTS across A and B phases using 10‐min (first and second panels) and 30‐min (third and fourth panels) sessions for small behavior changes. The results show that 30‐s MTS failed to detect the small behavior change that was demonstrated in the CDR data paths when using 10‐min sessions; however, the behavior change was detected with 30‐s MTS when 30‐min sessions were used. Copyright © 2011 John Wiley & Sons, Ltd.
Behav. Intervent. 26: 103–124 (2011) DOI: 10.1002/bin
112
S. L. Devine et al.
Figure 2. Targeted absolute durations of 33% med to 50% high based on scoring with CDR and 1‐min MTS across A and B phases using 10‐min (first and second panels) and 60‐min (third and fourth panels) sessions for a small behavior change. Med, medium; CDR, continuous duration recording; MTS, momentary time sampling.
Figure 2 contains the same comparison provided in Figure 1 based on scoring with CDR and 1‐min MTS across A and B phases using 10‐min (first and second panels) and 60‐min (third and fourth panels) sessions. As with 30‐s MTS, the data show that 1‐min MTS did not detect the small behavior change during a 10‐min a or 30‐min session (data for 30‐min sessions not depicted in the figure). Once the session Copyright © 2011 John Wiley & Sons, Ltd.
Behav. Intervent. 26: 103–124 (2011) DOI: 10.1002/bin
113
Detecting changes in simulated events
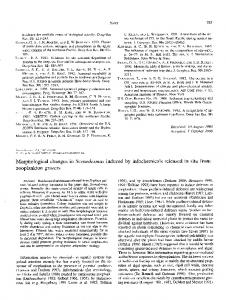
duration was extended to 60 min and session 4 was dropped from visual inspection, the data produced with 1‐min MTS detected the small change in the duration event. Figure 3 shows the summary of results for small (first row), moderate (second row), large (third row), and all (fourth row) changes in duration events between A and B phases using 10‐s, 20‐s, 30‐s, 1‐min, and 2‐min PIR (left panels) and MTS (right panels) for 10‐min, 30‐min, and 60‐min sessions. Results indicate that when PIR 10-s
20-s
30-s
MTS 1-min
2-min
10-s
20-s
30-s
1-min
2-min
100 80 60
10 Minute Sessions 30 Minute Sessions 60 Minute Sessions
40 20
Small Changes
Percentage of Sample Depicting Functional Control
0 100 80 60 40 20
Moderate Changes
0 100 80 60 40 20
Large Changes
0 100 80 60 40 20
All Changes
0
Figure 3. Summary results of the data collected on duration events representing small, moderate, large, and all behavior changes between A and B phases across various PIR and MTS interval sizes using 10‐min, 30‐min, and 60‐min sessions. PIR, partial‐interval recording; MTS, momentary time sampling. Copyright © 2011 John Wiley & Sons, Ltd.
Behav. Intervent. 26: 103–124 (2011) DOI: 10.1002/bin
114
S. L. Devine et al.
measuring small behavior changes, lengthier sessions yielded modest increases in sensitivity for PIR with 10‐s intervals and little or no changes in sensitivity for PIR with larger interval sizes. By contrast, increased session length increased the detection of changes in duration events for each interval size of MTS. Specifically, increasing the length of sessions to 60 min allowed 10‐s MTS to detect 100% of the small changes. Unexpectedly, 30‐s MTS appeared more sensitive than 20‐s MTS when using 10‐min and 30‐min sessions for measuring small behavior changes. In addition, MTS with interval sizes of 30 s or less detected 100% of the moderate changes during 60‐min sessions. When measuring large behavior changes, increasing session length did not produce a marked increase in the sensitivity of most interval recording methods. Across all behavior changes, extending session length to 60 min marginally increased the sensitivity of 10‐s and 20‐s PIR. With session lengths set at 30 or 60 min, MTS with interval sizes up to 1 min detected 80% or more of all changes in duration events, whereas no interval size of PIR met this criterion. Table 1 lists the number of observations required when using various interval sizes for 10‐min, 30‐min, and 60‐min observation periods. This table allows a cross reference between the sensitivity of each interval method with the number of observations required. For example, collecting data using 10‐s MTS for 10 min requires the same number of observations as collecting data using 30‐s MTS for 30 min. Based on the results in Figure 3, collecting data for 10 min with 10‐s MTS or for 30 min using 30‐s MTS provides comparable sensitivity for detecting changes in duration events. Figure 4 provides a summary of results for small changes (first row), moderate changes (second row), large changes (third row), and all changes combined (fourth row) in frequency events between A and B phases across 10‐s, 20‐s, 30‐s, 1‐min, and 2‐min PIR (left panels) and MTS (right panels) for 10‐min, 30‐min, and 60‐min sessions. Results indicate that when measuring small changes in rate, 10‐s PIR correctly detected experimental control for 100% of the samples across session lengths. The sensitivity of 20‐s and 30‐s PIR was greater during 30‐min and 60‐min sessions than during 10‐min sessions; however, less than 35% of the small changes in rate were detected. Likewise, larger interval sizes of PIR were not sensitive to small changes in rate. Data collected with MTS were generally insensitive to the detection of small changes in rate across session and interval lengths. Table 1. Number of observations required for various interval sizes across three session lengths. Observation length (min) 10 30 60
Interval size 10 s
20 s
30 s
1 min
2 min
60 180 360
30 90 180
20 60 120
10 30 60
5 15 30
Copyright © 2011 John Wiley & Sons, Ltd.
Behav. Intervent. 26: 103–124 (2011) DOI: 10.1002/bin
115
Detecting changes in simulated events PIR 10-s
20-s
30-s
MTS 1-min
2-min
10-s
20-s
30-s
1-min
2-min
100 80 60
10 Minute Sessions 30 Minute Sessions 60 Minute Sessions
40 20
Small Changes
Percentage of Sample Depicting Functional Control
0 100 80 60 40 20
Moderate Changes
0 100 80 60 40 20
Large Changes
0 100 80 60 40 20
All Changes
0
Figure 4. Summary results of the data collected on frequency events representing small, moderate, large, and all behavior changes between A and B phases across various PIR and MTS interval sizes using 10‐min, 30‐min, and 60‐min sessions. PIR, partial‐interval recording; MTS, momentary time sampling.
When measuring moderate changes in rate events, 10‐s PIR detected 77% of changes across each session length. Upon closer examination of the data, it appears that measurement ceilings were reached for 10‐s PIR for three comparisons during this study (8.0 and 13.0 rpm; 8.0 and 20.0 rpm; 13.0 and 20.0 rpm); these were the only comparisons for which 10‐s PIR did not detect moderate changes. Although 20‐s and 30‐s PIR detected more moderate changes in frequency events with 30‐min Copyright © 2011 John Wiley & Sons, Ltd.
Behav. Intervent. 26: 103–124 (2011) DOI: 10.1002/bin
116
S. L. Devine et al.
and 60‐min sessions than with 10‐min sessions, each detected less than 45% of the changes. By contrast, MTS with 10‐s intervals during 30‐min and 60‐min sessions, MTS with 20‐s intervals for 60‐min sessions, and MTS with 30‐s intervals for 30‐min sessions produced sensitive measurement of moderate changes in frequency events. When measuring large changes in frequency events, 10‐s PIR detected 100% of the changes across the three session lengths. Again, 20‐s and 30‐s PIR detected more behavior changes during 30‐min and 60‐min sessions than during 10‐min sessions; however, neither detected 80% or more of the large changes. Data collected with 10‐s, 20‐s, and 30‐s MTS detected 100% of the large changes during 30‐min and 60‐min sessions; each method detected fewer changes but was still sensitive during 10‐min sessions (range, 82 to 88%). The results for 1‐min and 2‐min interval sizes show that MTS was more sensitive to large changes in rate events than PIR. Most notably, increased sensitivity was produced during longer sessions for MTS with large interval sizes but not with PIR. Overall, only PIR with 10‐s intervals regardless of session length was sensitive to all changes in frequency events. By contrast, MTS with 10‐s intervals during 30‐min and 60‐min sessions, MTS with 20‐s intervals during 60‐min session, and MTS with 30‐s intervals during 30‐min session were each sensitive to all changes in frequency events. Specifically, MTS with interval sizes up to 30 s may be used to detect moderate and large changes in frequency events during lengthy observation sessions. The results for 10‐min session are consistent with those from the Rapp et al. (2008) investigation insofar as (i) MTS with 10‐s intervals was the most sensitive measure of changes in duration events; and (ii) MTS with interval sizes up to 30 s was more sensitive to changes in duration events than PIR with 10‐s intervals. In addition, the results of this study for frequency events are consistent with previous studies (e.g., Meany‐Daboul et al., 2007; Rapp et al., 2008) by showing that PIR with 10‐s intervals was the most sensitive measure of changes in rate events during 10‐min observation periods. More importantly, the results of this study potentially extend the literature by showing that MTS with interval sizes up to 30 s during 30‐min and 60‐min sessions detected many of the same changes in frequency events as PIR with 10‐s intervals. As a whole, the results suggest that MTS with interval sizes up to 30 s detects changes in both duration events and frequency events.
STUDY 2: EVALUATING FALSE POSITIVES WITH DURATION EVENTS AND FREQUENCY EVENTS When evaluating the sensitivity of discontinuous recording methods, Rapp et al. (2008) argued that it is essential to assess the production of false positives in Copyright © 2011 John Wiley & Sons, Ltd.
Behav. Intervent. 26: 103–124 (2011) DOI: 10.1002/bin
Detecting changes in simulated events
117
addition to false negatives as such outcomes are equally problematic when evaluating independent variables. To illustrate the problem, it may be that a particular interval recording method produces relatively few false negatives; however, the same method may produce a relatively high proportion of false positives (e.g., Carroll et al., 2009). In such case, a practitioner who employs such a method may continue to implement an intervention when it does not actually produce the intended behavior change. Rapp et al. (2008) found that 10‐s PIR produced a relatively high percentage of false positives when measuring duration events, whereas MTS, regardless of interval size, did not produce false positives when measuring duration events or frequency events. Carroll et al. (2009) recently evaluated whether the sensitivity of MTS for detecting small changes in duration events could be increased by using variations of MTS (e.g., increasing the observation window for MTS). Indeed, Carroll et al. found that one or more variations of MTS yielded increased sensitivity for detecting small changes in duration events (i.e., false negatives decreased); however, the increased sensitivity for detecting real changes in duration events was offset by an increased production of false positives. Based on these findings, Carroll et al. did not recommend the use of the tested variations for evaluating small changes in duration events. The results of this study exemplify the need to evaluate interval methods for the production of false positives. The purpose of this study was to employ the procedures described by Rapp et al. (2008) and Carroll et al. (2009) for evaluating the extent to which specific interval sizes of PIR and MTS produce false positives when the session length is increased. Because of the labor‐intensive nature of conducting this analysis, we opted to only evaluate false positives for interval sizes of PIR and MTS that detected 80% or more of changes in duration events or frequency events in study 1. Carroll et al. (2009) noted that there are currently no guidelines for determining an acceptable level of false positives with interval methods of data collection. Given the absence of formal guidelines in the literature, we arbitrarily designated methods that produced 20% or fewer false negatives and 33% or fewer false positives as being ‘sensitive’ to behavior change. There are three reasons for designating 33% or fewer false positives as acceptable for interval methods; the first two are methodological and the third is practical. First, because we use the same data sets for various comparisons, a data set of a few highly ‘deviant’ data sets could potentially give rise to multiple false positives. Second, unlike typical statistical measures, whereby decreasing the probability of false negatives (type I errors) directly increases the probability of false positives (type II errors), our measures of false negatives and false positives are independent. Thus, decreasing the probability of false negatives does not inherently involve an increased probability of false positives, and vice versa. Finally, we strongly suspect that practitioners who collect data in applied Copyright © 2011 John Wiley & Sons, Ltd.
Behav. Intervent. 26: 103–124 (2011) DOI: 10.1002/bin
118
S. L. Devine et al.
settings with interval methods will collect more than three data points per phase; more data points within an appropriate single‐subject design should decrease the probability of generating false positives with nonsimulated data. Thus, selecting 33% or fewer false positives as an acceptable criterion for interval methods that also detected 80% or more of all behavior changes seems reasonable.
Method Procedures Simulated CDR and CFR data produced in study 1 were plotted into ABAB reversal designs to evaluate the extent to which specific interval sizes of PIR and MTS produce false positives. Each targeted duration event was compared with the same targeted duration event with a different IRT‐to‐event‐run ratio (i.e., low, medium, or high; Rapp et al., 2008). All combinations of ratios were compared for each targeted duration event. For frequency events, sessions produced with low‐ variability IRTs were compared with sessions produced with high‐variability IRTs. As in study 1, the data for CDR, CFR, and selected intervals size of PIR and MTS were depicted in ABAB reversal designs and then visually inspected for the presence or absence of experimental control (as defined in study 1). Based on 80% criterion, we evaluated 10‐s MTS with all session lengths for testing of false positives with duration events, as well as 20‐s, 30‐s, and 1‐min MTS for 30‐min and 60‐min session lengths. Although 10‐s PIR did not detect 80% or more of all changes in duration events for 10‐min, 30‐min, or 60‐min sessions in study 1, we decided to include it in the analysis because (a) it detected 80% or more of the moderate and large changes in duration events, and (b) it is a commonly used method of data collection in the behavior‐analytic literature. For frequency events, the 80% criterion identified 10‐s PIR with all session lengths, 10‐s MTS for 30‐min and 60‐min sessions, 20‐s MTS for 60‐min sessions, and 30‐s MTS for 30‐min sessions for testing of false positives. Fifteen comparisons of CDR data sets and 27 comparisons of CFR data sets were plotted in reversal designs. The data were converted to 10‐s, 20‐s, and 30‐s MTS and 10‐s PIR for a total of 60 comparisons for duration measures and 63 comparisons for frequency measures.
Interobserver Agreement A second observer visually inspected 91% of the line graphs for experimental control in the same manner as described in study 1. We calculated IOA scores by taking the total number of agreements divided by the total number of agreements plus disagreements multiplied by 100%. The overall agreement score for the detection of experimental control was 97.4% (range, 95.5% to 100%). Copyright © 2011 John Wiley & Sons, Ltd.
Behav. Intervent. 26: 103–124 (2011) DOI: 10.1002/bin
119
Detecting changes in simulated events
Results and Discussion Table 2 shows the results of the analysis of false positives for duration events. The results indicate that 10‐s PIR produced false positives for 80% of the comparisons when 10‐min sessions were used and 100% of the comparisons when 30‐min and 60‐min sessions were used. By contrast, no interval size of MTS produced false positives when 10‐min, 30‐min, or 60‐min session lengths were used to measure changes in duration events. Table 3 shows the results of the analysis of false positives for frequency events. The results indicate that 10‐s PIR produced false positives for 33% of the comparisons when using 10‐min, 30‐min, or 60‐min sessions (i.e., session length did not alter the probability of producing false positives with 10‐s PIR). With MTS, no false positives were found when using 10‐s MTS for 30‐min or 60‐min sessions; however, false positives were produced for 33% of the data analyzed using both 20‐s MTS for 60‐min sessions and 30‐s MTS for 30‐min sessions. The results of this study are consistent with the results from the Rapp et al. (2008) study, which showed that the measurement of duration events with 10‐s PIR during Table 2. Percentage of sample depicting false positives for duration events. Recording method
PIR 10 s MTS 10 s 20 s 30 s
Session duration (%) 10 min
30 min
60 min
80
100
100
0 — —
0 0 0
0 0 0
PIR, partial‐interval recording; MTS, momentary time sampling.
Table 3. Percentage of sample depicting false positives for frequency events. Recording method
PIR 10 s MTS 10 s 20 s 30 s
Session duration (%) 10 min
30 min
60 min
33
33
33
— — —
0 — 33
0 33 —
PIR, partial‐interval recording; MTS, momentary time sampling. Copyright © 2011 John Wiley & Sons, Ltd.
Behav. Intervent. 26: 103–124 (2011) DOI: 10.1002/bin
120
S. L. Devine et al.
10‐min sessions produced a relatively high percentage of false positives, and measurement of the same events with any interval size of MTS did not produce false positives. For frequency events, no interval method produced false positives for more than 33% of the sample. Taken together, the results of studies 1 and 2 extend the literature by showing that MTS with interval sizes up to 30 s may detect a wide range of changes in duration events and frequency events during lengthier observation periods.
GENERAL DISCUSSION Study 1 evaluated the influence of session length on the sensitivity of interval recording methods for measuring changes in duration events and frequency events. Study 2 evaluated the extent to which the sensitive methods, as determined by study1, produced false positives. In general, the results of study 1 showed that the sensitivity of PIR and MTS increased with lengthier observations and, more specifically, that MTS with interval sizes up to 30 s detected 80% or more of changes in duration events during 30‐min and 60‐min observation sessions. Conversely, the results also showed that PIR with interval sizes larger than 10 s failed to detect large proportions of the changes in duration events in the sample. In addition, the results indicated that PIR with 10‐s intervals was the most sensitive to changes in all frequency events for each session length; however, the results also indicated that MTS with interval sizes up to 30 s detected many of the same changes during 30‐min and 60‐min sessions. Interestingly, extending session length did not increase the sensitivity of 10‐s PIR. Although extending session length to 30 min increased the sensitivity of 20‐s and 30‐s PIR, a high percentage of the changes in frequency events that were evident with CFR were still not detected. These results closely replicated the results of Rapp et al. (2008) insofar as 10‐s PIR was found to be the most sensitive measure for all small, moderate, and large behavior changes when 10‐min sessions were used. As a whole, the results of study 1 and 2 suggest that relative changes in duration events should be measured using MTS with (i) interval sizes up to 30 s during 30‐min sessions (or longer) or (ii) 10‐s intervals during 10‐min sessions. In addition, the results from the two studies suggest that relative changes in frequency events should be measured using either (i) PIR with 10‐s intervals for at least 10‐min sessions or (ii) MTS intervals up to 30‐s for at least 30‐min sessions. The results of this investigation support prior guidelines on the use of interval methods and also provide some direction for the development of additional guidelines. Not unexpectedly, the results support prior recommendations to use 10‐s MTS for 10‐min sessions and 10‐s PIR for 10‐min sessions to detect changes in duration events and frequency events, respectively. Perhaps more importantly, the results from the present investigation suggest that MTS with intervals up to 30 s may Copyright © 2011 John Wiley & Sons, Ltd.
Behav. Intervent. 26: 103–124 (2011) DOI: 10.1002/bin
Detecting changes in simulated events
121
be used to detect relative changes in duration events and frequency events during lengthy observation periods. This finding extends the literature on the utility of interval recording and has important implications for practitioners who often collect data on multiple target events in applied settings. The results of this study also suggest that practitioners with limited resources may measure behavior changes with smaller interval sizes of PIR or MTS during shorter observation sessions or with a larger interval size of MTS during lengthier sessions with comparable sensitivity. For instance, 10‐s MTS during 10‐min sessions and 30‐s MTS during 30‐min sessions yielded comparable detection of changes in duration events. Similarly, both 10‐s PIR during 10‐min sessions and 30‐s MTS during 30‐min sessions were sensitive to changes in frequency events. In both cases, the number of observations required in the 10‐min session is the same as the number of observations required in the 30‐min session (see Table 1). Assuming that the behavioral phenomenon is relatively stable across the observation period, practitioners may be able to choose the measurement method based on his or her available resources. Nevertheless, it is not clear to what extent the simulated data produced in this study represent nonsimulated behavior. Therefore, future research on this issue is warranted. Despite the potential utility of the findings from this study, several potential limitations should be noted. First, only three session lengths were evaluated. Observation periods of 10‐min, 30‐min, and 60‐min sessions were chosen because each was likely to be currently used in many applied settings or might be readily adopted. An examination of a larger variety of session lengths may produce a better understanding of the effect of session length. Second, after generating the sessions used to evaluate false negatives in study 1, it appeared that longer CDR sessions (60 min) had less session‐to‐session variability than shorter CDR sessions (10 min) that were generated with the same IRT‐to‐event‐run ratio. That is, 60‐min sessions produced data points that were more consistently ‘in line’ with the targeted absolute durations than the 10‐min sessions. For example, when targeting an absolute duration of 25%, the 60‐min sessions were more likely to be at or very near to 25% than the 10‐min sessions. As a result, the increase in sensitivity observed with increased session length with MTS may be an artifact of decreased variability in the CDR data paths from which the interval data were derived. That is, a given interval method may appear more sensitive during lengthier sessions because the CDR data contain less variability. Nevertheless, this same pattern was not evident in the CFR data sets. Thus, the results do suggest that MTS with larger interval sizes gained sensitivity for detecting changes in frequency events during lengthier observation periods. Third, it was difficult to generate different within‐session configurations (i.e., high and low variability) for high‐rate sessions (e.g., 20 rpm). To illustrate our problem, two CFR comparisons, which were ultimately excluded, depicted false positives (according to the definition used in study 2) when plotted in ABAB reversal designs Copyright © 2011 John Wiley & Sons, Ltd.
Behav. Intervent. 26: 103–124 (2011) DOI: 10.1002/bin
122
S. L. Devine et al.
before we converted the sessions into the various interval recording methods. Despite this obvious problem, none of the converted comparisons yielded false positives. To date, only one or two methods have been employed to evaluate false positives for interval recording methods (Meany‐Daboul et al., 2007; Rapp et al., 2007, 2008); one or both of these methods may be overly sensitive to producing false positives. Likewise, it is not clear what an acceptable percentage of false positives should be. Although our criterion of 33% or fewer false positives was empirically informed, it was still quite arbitrary. Fourth, the sample used in study 1 contained an unequal number of small, moderate, and large changes in simulated events. Specifically, the highest percentage of comparisons involved moderate changes, and the lowest percentage involved small changes. In part, the lower percentage of small and large changes may be a function of our omission of CDR data sets with 0% and 100% and CFR data sets with 0 rpm. We opted not to include extremely low or high data sets because Rapp et al. (2007) found that PIR with 10‐s intervals and MTS with 10‐s and 20‐s interval sizes typically detected the same behavior changes that were depicted with CDR data sets that contained phases with numerous data points at or near zero. Put differently, the effects of independent variables that caused behavior to occur all of the time or none of the time were readily detected with interval methods. Thus, it is possible that actual sensitivity of each interval method is slightly higher than what is reported here. The results of this investigation provide some direction for future research. First, future research should determine whether trends emerge in data sets produced with interval methods when the corresponding continuously recorded data are stable. For example, the second B phase for 1‐min MTS during 10‐min sessions in Figure 2 (second panel) shows a decreasing trend, whereas the CDR data path (first panel) shows that the target event is stable. If this outcome is common, it may be the case that collecting data with interval methods requires more effort because additional sessions are needed to demonstrate stability within a given phase. Second, as suggested by Carroll et al. (2009), researchers should convert nonsimulated data sets into various interval sizes of MTS and PIR to test for false positive and false negatives. Accumulating a sufficient sample of nonsimulated data sets with various sizes of behavior change may be a time‐consuming endeavor, but it is important for determining the extent to which simulated data accurately predict the sensitivity of interval methods. Third, future research should determine whether data collected with continuous and discontinuous recording methods yield comparable indexes of IOA. For example, it is possible that the mean IOA score for a duration event is 80%; however, the mean IOA score for the same events is above 90% when the data are converted to an interval method. Such an outcome would provide support for the development of different criteria for acceptable IOA scores for continuous and discontinuous recording methods. Copyright © 2011 John Wiley & Sons, Ltd.
Behav. Intervent. 26: 103–124 (2011) DOI: 10.1002/bin
Detecting changes in simulated events
123
ACKNOWLEDGEMENTS This study was conducted in partial fulfillment of a Masters degree in Behavior Analysis at St. Cloud State University by the first and third authors. We thank Christopher Giesbrecht and Chris Otto for their invaluable assistance with generating data.
REFERENCES Alvero, A. M., Struss, K., & Rappaport, E. (2007). Measuring safety performance: A comparison of whole, partial, and momentary time‐sampling recording methods. Journal of Organizational Behavior Management, 27, 1–28. Baer, D. M., Wolf, M. M., & Risley, T. R. (1968). Some current dimensions of applied behavior analysis. Journal of Applied Behavior Analysis, 1, 91–97. Carroll, R. A., Rapp, J. T., Colby‐Dirksen, A. M., & Lindenberg, A. M. (2009). Detecting changes in simulated events II: Using variations of momentary time‐sampling to measure changes in duration events. Behavioral Interventions, 24, 137–155. Ciotti‐Gardenier, N., MacDonald, R., & Green, G. (2004). Comparison of direct observational methods for measuring stereotypic behavior in children with autism spectrum disorders. Research in Developmental Disabilities, 25, 99 –118. Green, S. B., & Alverson, L. G. (1978). A comparison of indirect measures for long‐duration behaviors. Journal of Applied Behavior Analysis, 11, 530. Green, S. B. McCoy, J. F. Burns, K. P., & Smith, A. C. (1982). Accuracy of observational data with whole interval, partial interval, and momentary time‐sampling recording techniques. Journal of Applied Behavioral Assessment, 4, 103 –118. Gunter, P. L., Venn, M. L., Patrick, J., Miller, K. A., & Kelly, L. (2003). Efficacy of using momentary time samples to determine on‐task behavior of students with emotional/behavioral disorders. Education and Treatment of Children, 26, 400 – 412. Hanley, G. P., Cammilleri, A. P., Tiger, J. H., & Ingvarsson, E. T. (2007). A method for describing preschoolers’ activity preferences. Journal of Applied Behavior Analysis, 40, 603 – 618. Harrop, A., & Daniels, M. (1986). Methods of time sampling: A reappraisal of momentary time sampling and partial interval recording. Journal of Applied Behavior Analysis, 19, 73 –77. Harrop, A., Daniels, M., & Foulkes, C. (1990). The use of momentary time sampling and partial interval recording in behavioural research. Behavioural Psychotherapy, 18, 121–127. Kearns, K., Edwards, R., & Tingstrom, D. H. (1990). Accuracy of momentary time‐sampling intervals: Implications for classroom data collection. Journal of Psychoeducational Assessment, 8, 74 – 85. Kelly, M. B. (1977). A review of the observational data‐collection and reliability procedures reported in the journal of applied behavior analysis. Journal of Applied Behavior Analysis, 10, 97–101. Meany‐Daboul, M. G., Roscoe, E. M., Bourret, J. C., & Ahearn, W. H. (2007). A comparison of momentary time sampling and partial‐interval recording for evaluating functional relations. Journal of Applied Behavior Analysis, 40, 501– 514. Mudford, O. C., Taylor, S. A., & Martin, N. T. (2009). Continuous recording and interobserver agreement algorithms reported in the Journal of Applied Behavior Analysis (1995 – 2005). Journal of Applied Behavior Analysis, 42, 165 –169. Murphy, G., & Goodall, E. (1980). Measurement error in direct observation: A comparison of common recording methods. Behaviour Research and Therapy, 18, 147–150. Copyright © 2011 John Wiley & Sons, Ltd.
Behav. Intervent. 26: 103–124 (2011) DOI: 10.1002/bin
124
S. L. Devine et al.
Powell, J., Martindale, B., & Kulp, S. (1975). An evaluation of time‐sampling measures of behavior. Journal of Applied Behavior Analysis, 8, 463 – 469. Powell, J., Martindale, B., Kulp, S., Martindale, A., & Bauman, R. (1977). Taking a closer look: Time sampling and measurement error. Journal of Applied Behavior Analysis, 10, 325 – 332. Powell, J., & Rockinson, R. (1978). On the inability of interval time sampling to reflect frequency of occurrence data. Journal of Applied Behavior Analysis, 11, 531–532. Rapp, J. T., Colby‐Dirksen, A. M., Michalski, D. N., Carroll, R. A., & Lindenberg, A. (2008). Detecting changes in simulated events using partial interval recording and momentary time sampling. Behavioral Interventions, 23, 237–269. Rapp, J. T., Colby, A. M., Vollmer, T. R., Roane, H. S., Lomaas, J., & Britton, L. M. (2007). Interval recording for duration events: An extensive re‐evaluation. Behavioral Interventions, 22, 319 – 345. Repp, A. C., Roberts, D. M., Slack, D. J., Repp, C. F., & Berkler, M. S. (1976). A comparison of frequency, interval, and time‐sampling methods of data collection. Journal of Applied Behavior Analysis, 9, 501–508. Saudargas, R. A., & Zanoli, K. (1990). Momentary time sampling as an estimate of percentage of time: A field validation. Journal of Applied Behavior Analysis, 23, 533 – 537. Test, D. W., & Heward, W. L. (1984). Accuracy of momentary time sampling: A comparison of fixed‐ and variable‐interval observation schedules. In H. L. Heward, T. E. Heron, D. S. Hill, & J. Trap‐Porter (Eds.), Focus on behavior analysis in education (pp. 177–194). Columbus, OH: Charles E. Merrill.
Copyright © 2011 John Wiley & Sons, Ltd.
Behav. Intervent. 26: 103–124 (2011) DOI: 10.1002/bin