Detecting events and sentiment on Twitter for improving Urban Mobility A. Candelieri1,2, F. Archetti1,2 1
Department of Computer Science, Systems and Communication – University of Milano-Bicocca, Italy 2 Consorzio Milano Ricerche, Italy
[email protected],
[email protected],
[email protected]
Abstract The streams of tweets from and to the Twitter account of urban transport operators have been considered. A computational module has been designed and developed in order to collect tweets and, on the fly, analyze them to detect some relevant event (e.g. accidents, sudden traffic jams, service interruption, etc.) and/or evaluate possible sentiments and opinions about the quality of service. Events are recognized through a simple word matching while sentiment analysis is performed via supervised learning (Support Vector Machine). The text mining solutions have been developed to work with Italian language; however they could be easily extended to other languages in the case tweets in other languages would be available. This approach has been tested for the urban transportation in Milan (Azienda Trasporti Milano, ATM) in the framework of the TAMTAM project which has developed a technological platform for improving urban mobility by exploiting the large amount of information shared by the users of transportation services through Twitter. Events detected are used by other software modules of the TAM-TAM platform in order to support a more effective travel planning, while sentiment inferred may be used by the transport provider in order to tune the mobility supply to the commuter needs. Keywords: smart urban mobility, sentiment analysis, crowdsourcing
1
Introduction
The relevance of “narrative aware design framework” in the design and implementation of smart urban environments has been already highlighted in [1][2]. The combined diffusion of smart mobile devices and social networks have been rapidly increasing the amount of contents generated by users, making crowdsourcing a huge source of potentially useful – usually unstructured – information to transform in actionable knowledge for services/products innovation as well improving urban quality of life. According to this vision, the Italian project TAM-TAM, co-funded by the Italian Ministry of Education, University and Research together with Regione Lombardia, has designed and developed a technological platform able to combine information from official data sources and the huge amount of unstructured information generated through
crowdsourcing, even on the move, and related to transportation services in the city of Milan. Citizens, commuters and tourists already adopt socially awareness and collective intelligence to make more personalized and informed mobility decisions, mainly by reading and sharing short messages on Twitter. The aim of TAM-TAM is to close in the loop these streams of data and analyse them in order to provide users with addedvalue services. The benefits provided by the automatic analysis of tweets have been already investigated and proved in other domains, such as the automatic detection of anomalies related to power outage events during hurricane Irene on August 27, 2011 [3]. More recently the attention is focusing on terrorism, radicalization and hate-speech [4, 5]. With respect to these applications, where a first analysis is performed to discriminate between relevant and irrelevant tweets, limiting the collection of tweets to those posted from and to the Twitter account of the transportation company permits to consider all of them as relevant. The authors of this paper have been designing the tweets collection and analysis component of TAM-TAM, which is overall aimed at providing innovative services through: integration of data and information coming from different sources, both official and crowd-sourced (e.g., time-tables, on-line positioning data, traffic estimation, etc.); supporting intermodal and personalized transport options; computational modules for expressive-media contents analysis, based on sentiment and opinion mining techniques [6], for event detection and evaluation of the perceived quality of transport service; a travel planning software to provide users with information on costs, time, environmental impact and perceived quality of service with respect to the opinions of the other commuters; decision support functionalities to identify and address criticalities in the proposed urban transportation supply, enabling more effective and efficient plans according to variations in mobility users preferences. The contribution of this paper consists in the development and validation of a computational module devoted to collect tweets, both from and to the Twitter account of the public transportation company in Milan, Azienda Trasporti Milano (ATM), and then analyse their content according to the following two goals: the automatic identification of events (e.g., accidents, sudden traffic jams, etc.), as posted by the users, the automatic detection of opinions about transport service (e.g., delays, inefficiencies, perceived security, dirt, etc.). Some preliminary results obtained during the first activities of the project have been initially reported in [7], where an initial design of the computational module is presented, further specialized in this paper.
2
TAM-TAM: general architecture
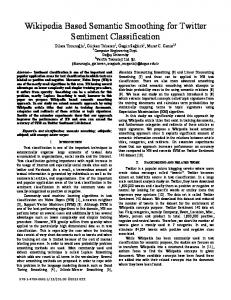
Figure 1 summarizes the overall architecture of the TAM-TAM platform, with a major focus on the component devoted to the analysis of tweets. The other relevant components and services of the platform are: i) the central database used to provide the different visualization layers related to official – structured – information, such as lines,
time-tables, on-line positioning data, traffic estimation, etc.; ii) web and mobile apps for login/profiling and visualization.
Fig. 1. Overall architecture of TAM-TAM with a focus on the tweets analyser component
Going more in detail, the main modules and functioning of the tweets analyser component are the following: Crawler Crawler is the module devoted to continuously collect tweets from (bold line) and to (dotted line) the Twitter account of the urban transportation company in Milan (@atm_informa). Moreover, Crawler is also devoted to store the acquired tweets, according to the data model provided by Twitter API, into a MySQL database (Tweets database) which is then used to perform further (off-line) analysis aimed at validating new machine learning algorithms and mine new models. Event Detector Event Detector implements a simple word-matching algorithm in order to identify, within tweets, keywords associated to relevant events. The set of keywords is based on the set of “standard” words generally used by ATM to inform customers about relevant events (e.g. strokes, accidents, interruptions, deviations, etc.) but it is completely customizable. The same set of keywords is also used to detect potential events communicated by the commuters. Finally, Event Detector search for other words, and their synonyms, referred to: type of transportation (i.e. bus, tram or underground), specific line and, where available, direction. All this information is well defined in the lists which could be retrieved from the web site of ATM. While the events detected in tweets from @atm_informa are certain, the events detected in commuters-generated tweets have to be validated; this action is performed by considering the rate of tweets related to the same events in the last 15 minutes. Higher the rate higher the trustworthiness about the event; when the rate of an event becomes
0 the event is no more valid. This is very important because commuters are generally used to report and share information about events but not about the return to the normality, while transportation supplier communicates disruptive events as well as their rehabilitation. Events are internally stored into the Events database – according to a structured format (i.e. type of event, type of transportation option, specific line, direction, timestamp, number of tweets in the last 15 minutes) – in order to perform all the rate-based considerations; subsequently, the Event Detector updates events within the TAM-TAM’s Central Database, eventually modifying the number of related tweets in the last 15 minutes of a specific event or removing those which are no more “active” (rate=0). Continuously, the data in the Central Database are retrieved by other computational modules, in particular the trip planning applications in order to optimize trip according to the current situation on the urban transportation network (i.e. delays, events on a specific line, etc.) Sentiment Analyser (pre-processing and neutral-positive-negative classification) As the tweets published by the transportation company are only related to official communications and responses to requests by the commuters, they are not analysed for sentiment analysis. This is the reason why only dotted line goes through the corresponding computational modules (Figure 1). The detection and further evaluation of possible sentiment in the tweets shared by commuters are performed through different sequential steps. First of all, some pre-processing is performed to transform the tweet in a vector of valued-features which can be analysed through Machine Learning algorithms. This pre-processing consists in removing stop-words (i.e. articles, prepositions and punctuations). Although the authors are conscious that emoticons may be used to enforce effectiveness of sentiment mining [8], in this first prototype of the tweets analyser they are not considered. Furthermore, the impact of applying – or not – stemming has also been considered, by using Snowball Stemmer (http://trimc-nlp.blogspot.it/2013/08/snowball-stemmer-for-java.html). The following pre-processing step consists in transforming the filtered tweets in a vector of valued-features. This procedure is better defined in section 3. It basically consists in a variation of a variation of the well-known TF-IDF (Term-Frequency – Inverse Document Frequency) weighting scheme, where features are computed differentially for each classification task (i.e. neutral vs not-neutral and positive vs negative). Similar tweets acquisition and analysis systems have been recently proposed, more specifically for English language, and for general purposes [9-13] as well for urban mobility [14]. After the current tweet has been pre-processed, only features related to TF-IDF for Neutral vs Not-neutral classification are given as input for a trained Support Vector Machine (SVM) classifier (details about the SVM learning are provided in section 3). The proposed classification output is then stored into the Sentiment database; in the case the output is “not-neutral” the values of the TF-IDF features for Positive vs Negative, of the current tweet, are given as input to a further SVM classifier, specifically trained. As in the previous step, the classification output is stored into the Sentiment database in order to enable, through the Query Executor module, the retrieval of useful information to support the transportation company in making decisions aimed at increasing commuters’ satisfaction.
3
Materials and Methods
Design and development of the tweets analyser of the TAM-TAM platform initially required to collect a set of tweets to be used for the training and validation of sentiment mining classifiers. Collection was started on 12th June 2013 and is still in progress, for tweets posted both from and to the account of the public transport company in Milan (currently the collected tweets are around 45,000). A set of 1,332 collected tweets has been labelled by 3 different human supervisors according to the possible following three alternatives: neutral (570), positive (127) or negative (635). No specific training has been provided to the “labellers”; the set of tweets has been randomly given to each supervisor, separately, asking for a judgement about the sentiment. Mean Kappa statistics was 0.96, showing a high agreement among the labellers; final label of every tweet is the more frequent one (“neutral” is given in the case of 3 discordant labels). To transform a tweet in a vector of features, the authors had taken into account specific considerations about the properties of tweets with respect to other types of text contents. As tweets are short messages, usually unstructured and informally written, techniques like parsing, pattern matching, complex grammars are usually ineffective. In [15] the solution proposed to analyse the content is a representation where features are terms and each feature is valued by the frequency of each term, which could be a word or n-gram. More simply, in [16, 17] the features are terms and they are valued as Boolean (1 if the term is present in the text, 0 otherwise). Other approaches propose a representation based on some computation; in [18] words are weighted by their correspondent Inverse Document Frequency (IDF) score, that is the logarithm of the number of documents in the collection divided by the number of documents containing a specific word [19]. Alternatively, the score known as Term Frequency–Inverse Document Frequency (TF-IDF) may be adopted, that is the IDF score multiplied by the frequency of a specific word divided by the number of words in the document [19]. In a recent study, proposing Bayesian Ensemble Learning for sentiment analysis, these approaches for feature construction are compared [20]. In [21] an extension of the TF-IDF approach is proposed, consisting in weighting words by the difference of their TF-IDF scores (delta TF-IDF) with respect to the class associated to the text (i.e. positive or negative sentiment). The Support Vector Machine (SVM) classification learning technique [22, 23] has been used to identify a reliable model able to detect the polarity of a document with respect to the computed delta-TFIDF. In particular, the proposed delta TF-IDF is defined as follows: |𝑃| |𝑁| |𝑃| 𝑁𝑡 𝑉𝑡,𝑑 = 𝐶𝑡,𝑑 ∗ 𝑙𝑜𝑔2 ( ) − 𝐶𝑡,𝑑 ∗ 𝑙𝑜𝑔2 ( ) = 𝐶𝑡,𝑑 ∗ 𝑙𝑜𝑔2 ( ) 𝑃𝑡 𝑁𝑡 𝑃𝑡 |𝑁|
where Vt,d is the value of the term (feature) t in document d, Ct,d is the frequency of term t in document d, Pt is the number of positively labelled documents containing term t, |P| is the number of the positively labelled documents, Nt is the number of negatively labelled documents containing term t, |N| is the number of negatively labelled documents. This approach proved to be more accurate with respect to the other ones and is the core of the application presented in this paper. In particular, two different delta TF-
IDF representations are computed, one for Neutral vs Not-neutral and one for Positive vs Negative classification, respectively. The dataset of the 1,332 labelled tweets has been first divided into two different datasets, one related to tweets having neutral and not-neutral labels and one related to tweets having positive and negative labels. Then, tweets in each one of these datasets have been pre-processed, accordingly to the procedure described in previous section 2, and delta TF-IDF has been computed for each term. Using and not using stemming has been considered, thus two different datasets have been generated from each of the previous ones, characterized by a different set of features. Furthermore, in order to reduce dimensionality, features have been ranked according to the corresponding delta TF-IDF and only the first n relevant features (terms) have been selected for each class (where n has been experimentally set to 10 in the case stemming is not adopted and 15 in the case of using stemming). Taking into account this step, the number of initially labelled tweets is reduced because some tweets could contain no one of the selected features. Table 1 summarizes the figures of each one of the datasets built starting from the initial set of the 1,332 labelled tweets. In order to use all the available data, the two classification learning tasks have been performed separately, while the two steps classification is only performed on new coming tweets when the module is deployed within the platform. Therefore, the number of “positive vs negative” tweets does not add-up to “not-neutral” due to the different filtering performed, for instance: when the original 1,332 tweets are filtered according to the 10 most relevant features for “neural vs not-neutral” (no-Stemming case), 554 tweets (1,332-778) are removed because they do not contain any of the selected words. Similarly, 559 tweets are selected, among the 1,332 having a not-neutral, when the filtering (no-Stemming) is applied. Table 1. Number of pre-processed tweets
Neutral vs Not-neutral
Positive vs Negative
4
No Stemming
Stemming
778 tweets 327 neutral tweets 451 not-neutral tweets 559 tweets 115 positive tweets 444 negative tweets
864 tweets 371 neutral tweets 493 not-neutral tweets 588 tweets 120 positive tweets 468 negative tweets
Results
As first result, the list of terms ranked according to delta TF-IDF values is reported in Table 2, with respect to the classification tasks, with and without stemming.
Table 2. List of terms ranked according to delta TF-IDF values Neutral vs Not-neutral without stemming Neutral regolare (0.0586) linea (0.0533) sciopero (0.0367) tram (0.0337) concerto (0.0321) domani (0.0313) direzione (0.0296) linee (0.0282) circolazione (0.0273) sapere (0.0243)
Not-neutral aria (-0.1246) condizionata (-0.1120) minuti (-0.0807) estivo (-0.0476) attesa (-0.0453) orario (-0.0413) sempre (-0.0363) senza (-0.0349) metro (-0.0337) treni (-0.0327)
Positive vs Negative without stemming Positive grazie (0.7732) risposta (0.0504) lavoro (0.0394) buon (0.0331) arrivato (0.0283) info (0.0268) 1000 (0.0220) molto (0.0189) complimenti (0.0173) avrei (0.0142) point (0.0126) qualcuno (0.0110) dovrebbe (0.0094) piedi (0.0079) attenti (0.0063) Negative aria (-0.1559) condizionata (-0.1386) minuti (-0.1386) sono (-0.1118) metro (-0.1071) linea (-0.0882) attesa (-0.0724) estivo (-0.0646) orario (-0.0614) anche (-0.0504) treni (-0.0551) senza (-0.0504) come (-0.0457) treno (-0.0441) ogni (-0.0362)
Neutral vs Not-neutral with stemming Neutral line (0.0815) regol (0.0586) circol (0.0489) sap (0.0375) regolar (0.0374) direzion (0.0367) tram (0.0355) sar (0.0352) funzion (0.0344) concert (0.0321)
Not-neutral ari (-0.1246) condizion (-0.1194) min (-0.081) estiv (-0.0594) tren (-0.0579) attes (-0.0515) lavor (-0.0463) aspett (-0.0388) metr (-0.0368) sempr (-0.0363)
Positive vs Negative with stemming Positive graz (0.7716) buon (0.0787) rispost (0.0472) ottim (0.0425) info (0.0268) molt (0.0252) 1000 (0.0220) compl (0.0173) avre (0.0142) ripart (0.0126) qualcun (0.0110) arriv (0.0094) serv (0.0079) attent (0.0063) almen (0.0047) Negative ari (-0.1559) condiz (-0.1496) min (-0.1338) metr (-0.1149) son (-0.1118) tren (-0.0992) line (-0.0945) orar (-0.0819) estiv (-0.0693) aspett (-0.0677) perc (-0.0646) anche (-0.0598) ferm (-0.0551) senz (-0.0504) mezz (-0.0472)
With respect to the classification learning task, a combination between the SVM implementation provided by WEKA suite (Waikato Environment for Knowledge Analysis, http://www.cs.waikato.ac.nz/ml/index.html) and Genetic Algorithms – aimed to optimize SVM configuration (regularization C and γ of Radial Basis Function Kernel) – has been used [24-26]. As the classes are unbalanced, the Balanced Classification Accuracy and F-score have been used to select the best performing SVM classifier according to a 10 foldcross validation procedure. Furthermore, SVM has been also compared to other classification learning algorithms offered by the WEKA suite, in particular the ZeroR classifier, which classify any instance as belonging to the most frequent class in the dataset (baseline), Artificial Neural Network (RBF-Network and Multi-Layer Perceptron, MLP) and Naïve Bayes. Table 3 summarizes the obtained results.
Table 3. Balanced Accuracy and F-scorethrough 10 fold-cross validation ZeroR
SVM
RBF-Network
MLP
Naïve Bayes
Neutral vs Not-neutral (without stemming)
50.00% / 0.425
79.07% / 0.795
78.33% / 0.789
73.84% / 0.748
78.08% / 0.782
Positive vs Negative (without stemming)
50.00% / 0.703
94.29% / 0.956
86.81% / 0.900
93.51% / 0.949
93.27% / 0.939
Neutral vs Not-neutral (with stemming)
50.00% / 0.415
78.53% / 0.783
76.42% / 0.775
75.71% / 0.765
77.56% / 0.778
Positive vs Negative (with stemming)
50.00% / 0.705
94.32% / 0.950
90.95% / 0.922
92.02% / 0.938
92.33% / 0.938
Balanced Accuracy and F-score are almost similar across the different classification learning algorithms and higher than baseline. According to the definition of BAC (i.e. average between sensitivity and specificity), its value is always 50% for the ZeroR and only F-score varies. SVM proved to be the most performing classification learning strategy, however, some differences resulted among the available datasets: in particular performances are higher in the case of Positive vs Negative classification than Neutral vs Not-neutral classification, while stemming does not make any difference in Neutral vs Not-neutral as well as Positive vs Negative classification. As final decision, stemming has been adopted for “Neutral vs Not-neutral” classification but not for “Positive vs Negative” classification. Therefore, in the pre-processing step every tweet generates two different vectors: the first (stemmed) is the input of “Neutral vs Not-neutral” classification, while the second (not-stemmed) is the input of “Positive vs Negative” classification, if and only if it is classified as “Not-neutral” at the first step. In the following Table 4 the SVM configurations associated to the performances in previous Table 2 are reported, along with the number percentage of overall instances used as Support Vectors (%SVs). This is another important index for evaluating the capability for any SVM classifier to correctly classify new instances not used for learning. It is easy to note that, according to both Balanced Accuracy and %SVs, the Neutral vs Not-neutral classification is more difficult than Positive vs Negative classification. Table 4. Configuration of the SVM classifiers and number of Support Vectors (SVs) used Neutral vs Not-neutral (without stemming) Positive vs Negative (without stemming) Neutral vs Not-neutral (with stemming) Positive vs Negative (with stemming)
C
γ
%SVs
10
110.95
73%
10
105.26
39%
10
8.46
63%
10
11.08
28%
5
Conclusions
The developed tweets analyser module, based on text mining and SVM classification and deployed into the prototype of the TAM-TAM platform, enabled innovative addedvalue services for commuters, aimed at improving urban mobility in the city of Milan. While event detection is used to optimize trip planning, sentiment analysis is currently more devoted to support transportation supplier in addressing commuters’ needs and improve their satisfaction. On the other hand, the idea is to use the output of sentiment analysis according to a collective intelligence paradigm by providing also commuters with information about the perceived quality of transportation service, and specific mobility options, as spontaneously reported by the other commuters. This will allow users of the transportation service, citizens as well as tourists, to plan their trips by also considering some social indicators of satisfaction. Currently the most relevant limitations of the work are two: the solution strictly depends on language as it has been currently validated only on Italian and the limited dataset of labelled tweets. While the first limitation is not yet so relevant, since almost all the tweets from and to @atm_informa are written in Italian, the second could be the reason of lower accuracy in the Neutral vs Not-neutral classification. Gamification based apps, aimed at enabling labelling by TAM-TAM users, have already been identified as effective solutions for increasing both the number of labelled tweets over time and labels objectivity according to the judgements provided by multiple users.
6
References
1. Srivastava, L., Vakali, A.: Towards a narrative aware design framework for smart urban environment. F. Álvarez et al. (Eds.): FIA 2012, LNCS 7281, 166–177 (2012). 2. Candelieri, A., Archetti, F., Giordani, I., Arosio, G., Sormani, R.: Smart cities management by integrating sensors, models and user generated contents. WIT Transactions on Ecology and the Environment, 179(1), 719-730 (2014). 3. Thom, D., Bosch, H., Koch, S., Worner, M., Ertl, T.: Spatiotemporal Anomaly Detection through Visual Analysis of Geolocated. IEEE Pacific Visualization Symposium (2012). 4. Burnap, P., Rana, O.F., Avis, N., Williams, M., Housley, W., Edwards, A., Morgan, J., Sloan, L.: Detecting tension in online communities with computational Twitter analysis. Technological Forecasting and Social Change (2013). 5. Burnap, P., Williams, M. L., Sloan, L., Rana, O. F., Housley, W., Edwards, A. M., Knight, V. A., Morgan, J., Procter, R., Voss, A.: Tweeting the terror: modelling the social media reaction to the Woolwich terrorist attack. Social Network Analysis and Mining (2014) 6. Pang, B., Lee, L.: Opinion Mining and Sentiment Analysis. Foundations and Trends in Information Retrieval, 2(1, 2),1–135 (2008). 7. Candelieri, A., Archetti, F.: Analyzing tweets to enable sustainable, multi-modal and personalized urban mobility: Approaches and results from the Italian project TAM-TAM. WIT Transactions on the Built Environment, 138, 373-379 (2014). 8. Pozzi, F.A., Maccagnola, D., Fersini, E., Messina, E.: Enhance user-level Sentiment Analysis on microblogs with approval relations. Proceeding of the 13th International Conference on Advances in Artificial Intelligence (2013).
9. Burnap, P., Rana, O., Williams, M.L., Housley, W., Edwards, A., Morgan, J., Sloan, L., Conejero, J.: COSMOS: Towards an integrated and scalable service for analysing social media on demand. Intern. Journal of Parallel, Emergent and Distributed Systems (2014) 10. Amati, G., Bianchi, M., Marcone, G.: Sentiment Estimation on Twitter (http://ceurws.org/Vol-1127/paper7.pdf) 11. Musto, C., Semeraro, G., Lops, P., de Gemmis, M., Narducci, F., Bordoni, L., Annunziato, M., Meloni, C., Orsucci, F. F., Paoloni, G.: Developing a Semantic Content Analyzer for L'Aquila Social Urban Network (http://ceur-ws.org/Vol-1127/paper6.pdf) 12. Amati, G., Angelini, S., Bianchi, M., Costantini, L., Marcone, G.: A scalable approach to near real-time sentiment analysis on social networks. In DART 2014, Information Filtering and Retrieval. Proceedings of the 8th International Workshop on Information Filtering and Retrieval, co-located with XIII AI*IA Symposium on Artificial Intelligence (AI*IA 2014), Pisa, Italy, December 10, 2014. CEUR Workshop Proceedings, 1314, 12-23 (2014). 13. Musto, C., Semeraro, G., Polignano, M.: A Comparison of Lexicon-based Approaches for Sentiment Analysis of Microblog Posts. In DART 2014, Information Filtering and Retrieval. Proceedings of the 8th International Workshop on Information Filtering and Retrieval, colocated with XIII AI*IA Symposium on Artificial Intelligence (AI*IA 2014), Pisa, Italy, December 10, 2014. CEUR Workshop Proceedings, 1314, 59-68, (2014). 14. Chen, F., Krishnan, R.: Transportation Sentiment Analysis for Safety Enhancement, Final Project Report. Technologies for Safe and Efficient Transportation, Carnegie Mellon University (2013). 15. Joachims, T.: Text Categorization with Support Vector Machines: Learning with Many Relevant Features, Springer (1997). 16. Pang, B., Lee, L., Vaithyanathan, S.: Thumbs up? Sentiment classification using machine learning techniques. In Proceedings of EMNLP (2002). 17. Whitelaw, C., Garg, N., Argamon, S.: Using appraisal groups for sentiment analysis. In Proceedings of the 14th ACM International Conference on Information and Knowledge Management, 625-631 (2005). 18. Kim, S., Pantel, P., Chklovski, T., Pennacchiotti, M.: Automatically assessing review helpfulness. In Proceedings of EMNLP, 423-430 (2006). 19. Baeza-Yates, R.A..: Modern Information Retrieval. Addison-Wesley Longman Publishing Co. (1999). 20. Fersini, E., Messina, E., Pozzi, F.A.: Sentiment analysis: Bayesian Ensemble Learning. Decision Support Systems, 68, 26-38 (2014). 21. Martineau, J., Finin, T.: Delta TFIDF: An Improved Feature Space for Sentiment Analysis. In Proceedings of the Third International ICWSM Conference, 258-261 (2009). 22. Scholkopf, B., Smola, A. J.: Learning with kernels. Support Vector Machines, regularization, optimization and beyond. Massachussetts Institute of Technology, USA (2002). 23. Vapnik, V.: Statistical Learning Theory. New York, Wiley (1998). 24. Candelieri, A.: A hyper-solution framework for classification problems via metaheuristic approaches. 4OR, 9 (4), 425-428 (2011). 25. Candelieri A, Conforti D.: A Hyper-Solution Framework for SVM Classification: Application for Predicting Destabilizations in Chronic Heart Failure Patients. The Open Medical Informatics Journal, 4, 136-140 (2010). 26. Candelieri, A., Sormani, R., Arosio, G., Giordani, I., Archetti. F.: A Hyper-solution Framework for SVM Classification: Improving Damage Detection on Helicopter Fuselage Panels. ASRI 2013, Conf. on Intelligent Systems and Control. AASRI Procedia 4, 31–36 (2013)