Header for SPIE use
Detecting Hidden Targets: A Procedure for Studying Performance in a Mine-Detection-like Task Daniel T. Cerutti**, Ioan M. Chelaru, and John E. R. Staddon DukeUniversity, Psychology: Experimental, Durham, NC, 27708 ABSTRACT We report preliminary results from an experiment designed to study the perceptual and learning processes involved in the detection of land mines. Subjects attempted to identify the location of spatially distributed targets identified by a sweeping a cursor across a computer screen. Each point on the screen was associated with a certain tone intensity; targets were louder than “distractor” objects. We looked at the effects on target detection and false-alarm rates of the intensity difference between target and distractor signals, the number of distractors and training order. The time to detect 50% of targets (threshold detection time) was measured by a rapid adaptive technique (PEST) which generated reliable thresholds within few trials. The results are consistent with a simple model for the detection of cryptic prey by foraging predators: search was slower with more distractors, and the effect of distractors was greater when intensity ratio (IR) was lower. Although subjects got no accuracy feedback, performance improved somewhat with experience and was better in the low-IR condition when it followed the high-IR condition. The procedure seems to be a useful one for studying more complex mine-related detection tasks with a range of signal types and numbers of concurrent detection signals.
Keywords: land mine detection, simulation, threshold, adaptive staircase, training, foraging, cryptic
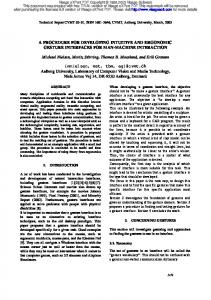
1. INTRODUCTION Land mines are effective barriers to the extent that they can be concealed. Development of sensitive metal-detection equipment reduces concealment, but has led to the evolution of low-metal or no-metal mines, which pose new technical problems. Mine detection will always be subject to technical limitations. Mines must usually be detected by human operators using hand-held devices. Improving the performance of the human operator in the man-machine system is therefore just as important as perfecting the technology of detection. Testing system performance in a naturalistic setting – real mine lanes, real mines – is expensive and difficult. The human operator soon learns the characteristics of the setup, at which point data become less useful. Changing the setup is expensive and time consuming. Two ways to deal with this problem are (a) to develop a “virtual minefield,” a computerbased system that closely matches the natural one in terms of the tactile, visual and auditory information presented to the operator. Such a system would allow the effect of technical and training modifications on operator efficiency to be tested directly. And (b) to learn more about the basic psychological processes that underlie operator performance in mine-detection tasks. Option (b) is less direct and less certain to succeed than option (a), but may suggest specific technical changes and may have long-run benefits in adding to basic science. We now report preliminary results from a project aimed at understanding the psychological processes involved in mine-detection-type tasks. An Analogy from Behavioral Ecology Most laboratory studies of detection involve trial-by-trial procedures and allow the test subject little freedom of action. Their focus is on the sensory limitations of the subject not on the way the subject interacts with his environment. But mine detection is more like the problem faced by a predator attempting to find a concealed or cryptic (camouflaged) prey than a sensory-discrimination task. There is a substantial amount of research on the detection of cryptic prey4,5,7,8,13. Relevant work has looked at how rate of target (prey) detection depends on the crypticity of the target. For example, Gendron2 studied in a semi-natural environment how quail forage for food objects that matched (high crypticity) or did not match (low crypticity) their background. He found (a) that the animals rarely made a mistake (false alarm rate was close to zero); (b) they search faster for the less cryptic food. Based on these results, Gendron and Staddon3 proposed a descriptive model for how detection of cryptic prey depends on crypticity and search rate. Figure 1 shows the suggested relation. Probability of detection remains high with conspicuous (low crypticity) targets at all but the highest *
Correspondence: Email:
[email protected]; Telephone 919 660 5707; Fax 919 660 5726
search rates. With less conspicuous (cryptic) targets, probability of detection decreases rapidly as search rate increases. These relationships can be summarized in the following equation: PKd + (S/M)K = 1 or, Pd = [1 - (S/M)K]1/K,
K > 0.
(1)
Figure 1 illustrates a further assumption of the model, that all curves intersect the abscissa at the maximum search rate (M). This represents an upper limit on the rate of search imposed by the observer’s perceptual or physiological abilities or by the detection equipment. In more complex detection tasks, with two target types that differ in crypticity, the optimal search rate will also reflect their relative densities3. Gendron and Staddon4 did an experiment to test this model with human subjects. Subjects searched for computergenerated visual targets. The targets were characters embedded in a background of nontarget symbols (“distractors” or “clutter”). Crypticity was manipulated by varying the number of distractor characters and search rate was manipulated by varying the display duration. The main results were (a) that probability of detection, Pd, decreased as search rate increased; (b) the decrease in detection probability was more rapid for more cryptic targets,; and (c) that Pd tended to converge at one point on the abscissa, the maximum search rate1. All these results are in agreement with model predictions, which encouraged us to use the model as a starting point for the present study.
PROBABILITY OF DETECTION
where S is search rate, M is the maximum search rate, K is a measure of crypticity, or how well the target is masked by extraneous noise, and Pd is probability of detection. The model predicts that the probability of detecting a target, Pd is a joint function of both target crypticity and search rate, S. Moreover, the optimal search rate (at which rate of target detection is maximized) decreases as targets become more cryptic. 1.0
CONSPICUOUS TARGETS
0.5
CRYPTIC TARGETS
0.0 0.0
0.5
1.0
SEARCH RATE/M
Figure 1 The probability of detecting a target as a function of search rate. Curves represent targets differing in their degree of crypticity. The dashed horizontal line at Pd = 0.5 indicates threshold detection. Search rate is plotted as a proportion of maximum rate.
Our desktop-based simulation required subjects to scan a patch of simulated terrain with a computer mouse. The terrain contained both “mines” (targets) and distractor objects, with targets producing louder auditory signals. We manipulated crypticity in two ways, by changing the relative loudness of distractor signals and by increasing the density of distractors. Each subject was tested with three densities of distractors at two signal values (a total of six conditions). This permitted us to study the effect of experience in two ways, by presenting difficult detection trials before easier trials or vise versa, and by repeating the first condition after the first six conditions. A major consideration in research and training with humans is to collect reliable data with a minimal investment of time and physical resources. The forced-choice procedures used in previous experiments on prey detection require many trials at each level of an independent variable. We therefore used an adaptive staircase procedure, specifically developed for rapidly determining stimulus thresholds (Pd = .5) in vision and audition, to study target detection (see review by Treutwein12). This procedure increases or decreases the relevant stimulus parameter trial-by-trial, depending on whether a subject made an incorrect or correct detection on the preceding trial. The increments and decrements become progressively smaller as the threshold is located, rapidly converging on a threshold. In our simulation, we used a staircase to adjust the time available to search terrain until Pd = 0.5. We could then generate psychometric functions relating the effects of signal strength, for example, to the search time a subject required to find 50% of the targets.
2. METHODS Subjects were six undergraduate college students, five female and one male. They were paid a flat hourly wage for serving. Subjects were seated at a computer and given the following instructions to read while the experimenter read them aloud:
target distracter
h
This study is designed to learn about how people find mines. We are using a computer simulation of a minefield and a metal detector to simulate real problems in mine finding. In a real minefield, a person searching for buried mines uses a mine detector to locate mines and mark their positions. The marks are used by another person who disarms them. A metal-detector indicates a buried mine by making a tone when it is over a mine. Unfortunately, metal detectors also indicate other objects like small metal fragments, and the operator must decide whether a tone indicates a mine or a harmless object. Your task involves using the computer mouse to (1) scan small patches of a simulated minefield and (2) to mark the locations of mines. The computer’s speakers will make a tone when the mouse pointer is over an object. You must decide if the object is a mine and mark it by clicking the left mouse button. You must only mark mines.
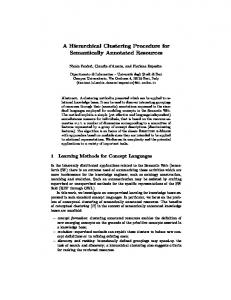
σ
target
Subjects were then shown a 125 mm square Figure 2. The upper panel shows a twopatch of simulated terrain (220 pixels wide by 200 dimensional representation of target and high), a light brown marbleized pattern, on the distractor signal strength. The contour plot is an computer monitor. The terrain contained two 2 mm isometric representation of the spatial dots, one green and one black. They were told that distribution of signal strength (z-axis) for a the black dot represented a mine (target) and the target (lower right) and two distractors. green dot represented a non-mine object (distractor). Then they were asked to sweep over the dots with the mouse pointer and listen to the tone produced by the speaker. The signal frequency was constant at 500 Hz, The volume of the signal generated by target and distractor varied according to a Gaussian spatial distribution. Figure 2 is a visual representation of a target signal (lower right) and two distractor objects, where signal volume is a function of the height of the distribution. The function used to determine signal strength for a target was the following: hm = exp[-[(x-mx)2 + (y-my)2]/2σ2m,
(2)
where hm is the magnitude of the target signal, mx and my are the target’s position on the terrain, x and y are the mouse-pointer position on the terrain, and
σm was 6 pixels.
The signal strength for the distractor objects, ho, was determined in the same
way except that ho was a proportion of hm and σo=σm/2. The value of ho was 0.5hm in the low target/distractor signal conditions and ho was 0.25hm in the high target/distractor signal conditions. During this initial training, the black dot (mine) generated an 83 db tone at 100 mm from the speaker at the peak; the green dot (non-mine) generated a 65 db tone at 100 mm from the speaker at the peak. They were then presented with a patch of terrain without dots and they were told that the mine and the object were now hidden and their task was to use the mouse
to locate the target. When they located the target, they were instructed to point to it with the mouse and to click the left mouse button to mark target position. Once they put down a mark, the position of the target was revealed. Their mark appeared blue if it was within the target “halo” of approximately 10 pixels (6 mm) from the target; their mark appeared red if it was outside the halo. They were given these training-with-feedback trials until they completed ten correct detections in a row.
HIGH
AVERAG E FALSE ALARMS
THRESHO LD SEARCH TIME (SEC)
Subjects began experimental conditions immediately after meeting the training criterion. Trials in experimental conditions were similar to training trials except that there was no feedback about correct detections and there was a “progress bar” to the right of the terrain. The progress bar indicated the time remaining in a trial. Trial duration varied between 5 and 30 seconds and was adjusted between trials with a maximum likelihood procedure known as the “best PEST” (Parameter Estimation by Sequential Testing6). The PEST procedure arranged very long and very short trials at the outset of a condition (i.e., HIGH -LO W G ROU P LO W -HIGH G ROU P CO ND ITION 30-s and 5-s), and then used correct 30 Col 34 vs Col 3 detections and detection failures over Col 39 vs Col 4 20 Col 1 vs X HL 0 successive trials to estimate the threshold Col 1 vs HL R E display duration (correct detections and 10 detection failures were determined as 0 described for training). For example, 5 assuming a subject detected the target at 30-s 4 but not at 5-s, the following trials might be 3 20-s and 10-s. If the subject succeeded with 2 first but not the second, the PEST would 1 narrow the range of values further, and so 0 forth. Conditions were terminated after 40 0 10 20 30 0 10 20 30 trials, considered adequate for reliable DISTRACTOR NUM BER threshold estimation with the best PEST procedure12. Each subject was exposed to seven conditions, each separated by a five minute rest period or longer at the subject’s request. One group of three subjects (HIGH-LOW Figure 3. Upper plots show mean threshold search times for the Group) first experienced three successive HIGH-LOW and LOW-HIGH groups. Lower plots show average conditions in which the target signal was 83 false alarms. The HIGH conditions, indicated by filled points, db and the distractor signal was 65 db (as in contained distractors producing 65 db signals; the LOW conditions, training). The first of these conditions indicated by open points, contained distractors producing 81 db contained 2 distractors, the second contained signals. Triangles are replications, shifted slightly on the x-axis to 8 distractors, and the third contained 32 reduce crowding. Vertical lines are standard deviations. Points are distractors. These were followed by three fit with power functions. identical conditions but in which the distractor signal was 81 db. The second group of three subjects (LOW-HIGH Group), completed the sequence of three conditions with the 81 db distractor signal followed by the three conditions with the 65 db distractor. In the seventh and final condition, each subject repeated his or her first condition.
3. RESULTS Individual subject’s performances are summarized in the Appendix. Group performances are displayed in Figure 3. The upper plots show threshold search times as a function of the intensity ratio and distractor number. As expected, threshold time was consistently greater for the LOW (more cryptic, lower intensity ratio) condition. Moreover, the effect of the intensity ratio was more or less constant and independent of the number of distractors: the HIGH and LOW curves are all parallel. Although the number of data points is too small to be sure, the function relating threshold search time to distractor number appears to be negatively accelerated.
The lower plots in Figure 3 show the mean false alarms per trial (FAR) as a function of the intensity ratio and distractor number. In these plots, FAR included all marks outside of a target halo. The FAR for the HIGH conditions remained low at all distractor values, while the FAR for the LOW condition increased with distractors in a nearly linear function.
FIRST
SECOND
HIGH
LOW
30
THRESHOLD SEARCH TIME (SEC)
The data in Figure 3 are replotted in Figure 4 to illustrate the effect of testing order, LOW-HIGH vs. HIGH-LOW, on search time. Not shown in Figure 4 are data from the last, replication condition. There was an apparent order effect: performance on the LOW condition was slightly better if it followed the HIGH
20
10
0
10
20
30
0
10
20
30
DISTRACTOR NUMBER D U R A T IO N (S E C )
M EAN TH R ESH O LD SEAR C H
0
25
1 S T C O N D IT IO N R E P L IC A T IO N
20 15
Figure 4. Performances of the HIGH (65 db distractors) and LOW (81 db distractors) conditions plotted together. Open points and dotted lines show results of the first three conditions, filled points and solid lines show results of the next three conditions. Plots are fitted
10 5 0
H IG H
LO W
S IG N A L /N O IS E
Figure 5. Comparison of results from subjects’ first condition and the final replication of the condition.
condition rather than preceded it. Another order effect is seen in the right plot of Figure 4: threshold search times for the two-distractor conditions are higher than anticipated by the function for both groups of subjects. The likely explanation is that this was the first LOW condition experienced by all subjects. Finally, Figure 5 compares the threshold search time in the first condition with the final replication of that condition. Five of the six subjects showed lower thresholds in the replication, but as seen in Figure 5, the reduction was modest.
HIGH
DISTRACTORS
LOW
MEAN DISPLAY DURATION (SEC)
30 2 8 32
20 10 0
LOW
HIGH
30 20 10 0 10
20
30
40
10
20
30
40
TRIALS
Figure 6. Display durations at ten trial intervals. The HIGHLOW group results are shown in the upper plots and the LOWHIGH group results are shown in the lower plots.
Figure 6 shows that the PEST procedure was almost always able to establish thresholds well within the 40 trials of a condition. On the x-axis is plotted display duration at 10-trial intervals. Successful determination of a threshold is indicated by an increasingly horizontal trend in display duration. For example, the top-row graphs show data from the High-Low Group. The solid squares show display duration with 32 distractors. In the left plot, display duration is about 20-s at trial 10 and remains close 20-s at 20, 30, and 40 trials. This indicates that the threshold was determined by the 10th trial. In the right plot, however, display duration is again at 20-s at trial 10, but climbs slightly, suggesting that the threshold may have been slightly underestimated. Visual inspection of Figure 5 suggests that the PEST produced reliable results with the possible exception of the LOW conditions, here target and distractor signals were most similar. These conditions might have benefited from additional trials.
4. DISCUSSION The solid line in Figure 7 shows how the PEST threshold measurement is related to the search-rate measure predicted by the Gendron-Staddon3 model. Setting Pd=0.5 and rearranging, the relation between search rate, S, and the crypticity measure K is: (3)
The search-crypticity function in Figure 7 shows that threshold search rate remains high with non-cryptic prey and then suddenly falls off as crypticity increases. The problem, of course, is that we don’t know how the crypticity measure, K, is related to actual independent variables in our study, such as the number of distractors. We have provided a rough fit to our findings by plotting search rate in each condition as a proportion of maximum search rate. And, by assuming that search rate falls close to zero with a large number of distractors, we plot crypticity as a proportion of maximum distractors (distractors divided by 100). The model provides a rough fit to the data without making any provision for effects of intensity ratio. The obtained search rate appears to fall off more quickly than predicted, the number of “crypticity” values we used tried is too few to be sure.
HL / HIGH HL / LOW LH / HIGH LH / LOW
1.0
SEARCH RATE
S=100((LN(-EXP(LN(0.5)*K) + 1))/K)
0.5
0.0 0.0
0.5
1.0
CRYPTICITY
Figure 7. Search-crypticity function and mean The small effect of the intensity ratio on threshold thresholds from the present study. The solid line shows search time was not anticipated. We chose the IR parameters threshold search rate as a function of crypticity in the experiment after we found values that produced large predicted by the Gendron-Staddon model. Data points differences in the time it took to find mines. We did not are from conditions described in the legend. Other anticipate that the main effect of decreasing the intensity details in text. ratio would be to increase FAR, although in retrospect the finding is obvious. This is a major departure from previous findings on prey detection by animals and humans, where FAR stays very low irrespective of the intensity ratio. But in fact, our simulation data closely resemble the data collected in field tests. Those data show fewer false alarms with the metal detector than with the ground-penetrating radar (GPR). The reason is that the GPR gives the same auditory signal to all buried objects, as in our low signal/noise condition. We were also surprised by the marginal effect of training history. Many studies show that training subjects on progressively more difficult discriminations, a procedure called fading, results in more rapid learning and greater accuracy (e.g., Sidman & Stoddard, 1967; Terrace, 1963). Our HIGH-LOW group was exposed to a fading regimen but showed very little benefit. A likely reason is that fading requires feedback. Feedback in our study was impoverished in that our subjects had auditory feedback from the computer, but no indication of whether their marks were on target. Training is such a critical issue in performance that this question merits a more systematic investigation. The present experiment is a first step toward the development of a valid model of the behavior involved in the detection of hidden targets. Little is known about the variables that must be included in a more complete model and how they contribute to the final performance. The ultimate value of a model will be to predict performance under novel conditions and to suggest ways to make the feedback from sensors most useful to the human operator.
5. ACKNOWLEDGEMENTS We wish to thank Rosa Maria Cerutti for assistance in running the experiment. This work was supported by U.S.Army Research Office, Grant No. DAAH04-96-1-0448 (Multidisciplinary University Research Initiative to Demining).
6. REFERENCES 1. 2. 3. 4. 5. 6. 7. 8. 9. 10. 11. 12. 13.
Blough, D. S. 1979. Effects of the number and form of stimuli on visual search in the pigeon. J. Exp. Psychol. Anim. Behav. Proc. 5:211-223. Gendron, R. P. (1982). The foraging behavior of bobwhite quail searching for cryptic prey. Ph.D. diss. Duke University. Gendron, R. P., and J. E. R. Staddon. 1983. Searching for cryptic prey: the effect of search rate. Am. Nat. 121:172-186. Gendron, R. P., and J. E. R. Staddon. 1984. A laboratory simulation of foraging behavior: The effect of search rate on the probability of detecting prey. Am. Nat. 124: 407-415. Guilford, T., & Dawkins, M. S. (1989). Search image versus search rate: Two different ways to enhance prey capture. Animal Behaviour, 37, 163-165. Pentland, A. (1980). Maximum likelihood estimation: The best PEST. Perception and Psychophysics, 28, 377-379. Plaisted, K. C., & Mackintosh, N. J. (1995). Visual search for cryptic stimuli in pigeons: Implications for the search image and search rate hypotheses. Animal-Behaviour, 50, 1219-1232. Reid, P. J., & Shettleworth, S. J. (1992). Detection of cryptic prey: Search image or search rate? Journal-ofExperimental-Psychology:-Animal-Behavior-Processes, 18, 273-286. Sidman, M., & Stoddard, L. T. (1967. The effectiveness of fading in programming a simultaneous form discrimination for retarded children. Journal of the Experimental Analysis of Behavior, 10, 3-15. Staddon, J. E. R., & Gendron, R. P. (1983). Optimal detection of cryptic prey may lead to predator switching. American Naturalist, 122, 843-848. Terrace, H. (1963). Discrimination learning with and without “errors.” Journal of the Experimental Analysis of Behavior, 10, 3-15. Treutwein, B. (1995) Adaptive psychophysical procedures: Minireview. Vision Res., 35, 2503–2522. Tye, A. (1989). A model of search behaviour for the northern wheatear Oenanthe oenanthe (Aves, Turdidae) and other pause-travel predators. Ethology, 83, 1-18.
7. APPENDIX Subjects’ mean search threshold and false-alarm rate for the last ten trials of each condition. -------------------------------------------------------------------------------------------------------------------------Search time(sec) False-alarm rate ------------------------------------ ---------------------------------------------Subj. Distractors High Signal Low Signal High Signal Low Signal ------------------------------------------------------------------------------------------------------------------------High-to-low group HL1 2 10.8 13.0 0.2 0.0 8 10.8 19.8 0.0 0.8 32 15.6 16.8 0.2 0.7 2 10.4 ----0.1 HL2 2 10.2 25.4 0.3 0.0 8 13.2 10.4 0.2 0.6 32 22.2 25.8 0.4 1.0 2 5.6 ----0.3 HL3 2 15.0 13.0 0.3 0.2 8 18.2 19.0 0.6 0.9 32 22.0 29.0 0.3 1.0 2 13.0 ----0.4 Low-to-high group LH1 2 25.0 9.2 0.2 0.7 8 17.0 12.8 0.0 0.8 32 27.4 21.0 0.3 0.5 2 ----22.8 0.0 LH2 2 14.6 15.0 0.7 0.5 8 15.0 20.8 0.6 0.9 32 23.8. 17.0 0.6 1.0 2 ----9.0 0.3 LH3 2 12.4 12.2 0.2 0.2 8 29.0 13.6 0.2 0.4 32 29.0 21.0 0.1 0.9 2 ----12.8 0.0 -----------------------------------------------------------------------------------------------------------------------------------