Nov 12, 2004 - langston, baldwin@ cs.utk.edu. 3Department of ... asaxton @ utk.edu. ABSTRACT .... was done on the OIT Cluster of 32 nodes of SInRG project.
Detecting Network Motifs in Gene Co-expression Networks Xinxia Peng1, Michael A. Langston2, Arnold M. Saxton3, Nicole E. Baldwin2, Jay R. Snoddy1 1
Graduate School of Genome Science and Technology, The University of Tennessee-Oak Ridge National Laboratory, Oak Ridge, TN 37831
pengxn, snoddyj@ ornl.gov 2
Department of Computer Science, The University of Tennessee, Knoxville, TN 37996
langston, baldwin@ cs.utk.edu 3
Department of Animal Science, The University of Tennessee, Knoxville, TN 37996
asaxton @ utk.edu ABSTRACT
Keywords
Biological networks can be broken down into modules, groups of interacting molecules. To uncover these functional modules and study their evolution, our research groups are developing graphtheory based strategies for the analysis of gene expression data. We are looking for groups of completely connected subgraphs (e.g. cliques) in which corresponding members have the same combination of protein domains in co-expression networks. The common pattern shown by a group of similar cliques is a “network motif” that may be reused multiple times within organisms. We have developed algorithms for constructing gene co-expression networks labeled with corresponding protein sequence domain combinations, and then detected recurring network motifs with similar protein domain memberships within these labeled networks. The statistical significance of detected network motifs is evaluated by comparing results with those from randomized networks. Also the biological relevance of network motifs is evaluated for shared Gene Ontology annotations on biological processes. We applied our approach to the malaria transcriptome and found many network motifs with three, four, or five members. Many predicted network motifs were further supported by their existence in yeast protein interaction networks. These results illustrate a new strategy for studying the modularity of biological networks by integrating different types of data and cross-species comparisons. A full description of results is available at http://mouse.ornl.gov/~xpv/camda04/.
Graph Algorithms, Microarray Analysis, Clustering, Network Motif, Gene Expression, Protein Domain, Protein Interaction, Data Integration
1. INTRODUCTION Gene expression microarrays provide a revolutionary approach for measuring the mRNA levels of thousands of genes at the same time. Systematic analysis of genome-wide expression profiles across multiple conditions, together with integration with other kinds of data, should help give us insight into biological networks. Functionally related genes could be clustered together based on similar expression profiles. Additional information such as Gene Ontology (GO) can be exploited to help further biological interpretation if the target organism is well studied such as yeast, mouse and human, but this data is often not sufficient in other important organisms. Even so, general clustering algorithms produce clusters of relatively large size, making it difficult to test the cluster of interest using wet-lab experiments. In addition, general clustering algorithms do not provide reasonably detailed information about the relationship among genes in a cluster, such as if some genes directly interact with each other and how. This makes it even more difficult for individual researchers to verify the predictions experimentally. Additional independent information is needed to break big clusters into smaller ones and thereby provide more detailed insights into relationships among genes within subclusters. Protein sequence information is a good candidate. Proteins can be decomposed into protein domains, both the units of protein function and evolution. More importantly, there is considerable evidence that biological systems build various functional units by reusing protein domains with different combinations [10]. This feature enables us to attempt to decode the common mechanisms used in biological systems through studying protein domains.
Categories and Subject Descriptors G.2.2 [Graph Theory]: graph algorithms; J.3 [Life and Medical Sciences]: Biology and genetics
General Terms Algorithms, Experimentation, Theory
Duplication and divergence is an important factor in the evolution of genomes and biological complexity. Duplicated genes can retain or change their interaction partners. They may, over time, replace interaction partners, but the duplicated gene might still interact directly or indirectly with a partner having similar characteristics to the original partner. Multiple instances of MAP3K-MAP2K-MAPK three-tiered cascades constitute a well studied example [3]. It is still unknown whether it is a general
This work was presented at the fifth international conference for the Critical Assessment of Microarray Data Analysis (CAMDA 2004), November 10-12, 2004, Durham, North Carolina, U.S.A.
1
principle in biology that different genes form instances of common patterns such as in MAPK pathways. In this study, we developed novel algorithms to decompose the clusters of genes into smaller ones by integrating protein domain information into the clustering algorithm. Our algorithm is able to provide more detailed information about relationships among members of clusters, as the predicted clusters could serve as basic functional modules in larger systems. In addition, we provide evidence that some similar function units are temporally regulated differently at the transcriptional level. To gain further confidence, our approach is able to integrate additional information, such as protein interaction data from different species. Yeast is a good source because rich information has been already collected.
2. MATERIALS AND METHODS 2.1 Co-expression Networks
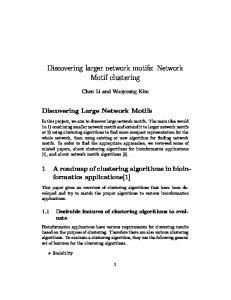
Figure 1. Schematic of Network Motif
In a co-expression network, the genes are represented by vertices (nodes). An unweighted and undirected edge (connection) is placed between two genes if they are co-expressed, measured by having a correlation higher than some specified threshold. The malaria transcriptome [2] was downloaded from the CAMDA04 website (http://www.camda.duke.edu/camda04/datasets/) and the Complete Dataset was used in this study. For ORFs represented by multiple oligonucleotides on the DNA microarray, the expression ratios were averaged. All Cy5/Cy3 ratio intensities were log2 transformed, and gene pairwise correlation coefficients were calculated using the standard Pearson method. Correlation coefficients between pairs of genes computed with fewer than 33 of 46 timepoints (approximately 75%) were discarded. Based on a selected cutoff value, the calculated correlation matrix was converted into a binary symmetric matrix of the same size. An entry in this matrix was set to 1 if the corresponding correlation coefficient was greater than or equal to the cutoff value, otherwise the entry was set to 0. Rows (columns) with all-zero entries were deleted from the binary matrix, corresponding to the elimination of isolated vertices in the graph associated with such a matrix.
information as reflected in its label. Figure 1B shows 7 hypothetical genes in a co-expression network forming three distinct instances of the network motif as described in Figure 1A. In each of the instances, three genes are highly correlated with each other as indicated by the edges, and their protein domain information maps one-to-one to the specified network motif. Among the three instances, instances II and III share at least one gene (here two genes) and we say these two instances are “overlapping”. On the other hand, instance I does not share any genes with instance II, so these two are “non-overlapping”. Instances I and III form another pair of non-overlapping instances. In general, we insist that in a network motif of size k (k = 3 in the above example) every pair of vertices is joined by an edge, that is, the network motif forms a clique. Starting from the above calculated P. falciparum co-expression network, we converted it into a labeled graph whose vertices (genes) were labeled with their corresponding annotated Pfam protein domain information. The clique-based clustering algorithm of [6] was applied to this labeled co-expression network to search for patterns of highly co-expressed genes or network motifs (Figure 1). For a specified k, we scanned all k-vertex cliques and grouped all cliques found based on the protein domain information. Within a group of cliques, protein domain information in each clique can match one-to-one against protein domain information of genes in any other clique. These groups of cliques are called “putative network motifs”. Next, a parameter f specifying the minimum number of mutual non-overlapping instances in a network motif was used to trim the list of putative network motifs. Only putative network motifs having at least f non-overlapping instances were kept as network motifs.
2.2 Protein Domain Annotation Plasmodium falciparum protein sequences and GO annotations were downloaded from PlasmoDB (http://plasmodb.org). To get protein domain annotations, all protein sequences were searched against Pfam HMM library (Release 14.0, global, ls mode, PfamA HMMs with a total of 7459 families) using hmmpfam with trusted cutoffs. The HMM library was downloaded from Pfam website (http://www.sanger.ac.uk/Software/Pfam). HMMER 2.3.2 was downloaded from http://hmmer.wustl.edu. The computation was done on the OIT Cluster of 32 nodes of SInRG project (http://icl.cs.utk.edu/sinrg/index.html).
To account for the abundance of different domains in the whole genome, we further assessed the statistical significance of each detected network motif by comparison to randomized networks. Starting from the real co-expression network, we generated a randomized network by randomly permuting the domain labels of all genes while leaving the connection structure of the graph untouched, and then ran the same network motif detection procedure on the resulting randomized network. This process was repeated 1,000 times. The fraction of times the same network motif was found in the randomized networks was defined as the p-value for the network motif.
2.3 Network Motif Discovery The concept of “network motifs” was first proposed by Alon’s group in studying various real world networks including biological networks [8, 11]. Network motifs were defined as patterns of interactions recurring more frequently in a network than in randomized networks. Here we extended the concept of network motif to labeled graphs by studying patterns of vertex labels (Figure 1). As shown in Figure 1A, a hypothetical network motif might be a clique of three genes. These genes are highly coexpressed as required by the correlation cutoff to create an edge. In addition, each gene has its own characteristic protein domain
2
Table 1. Summary of the number of putative network motifs detected. Domain matching level A k=3
k=4
k=5
k=6
f=2
88, 25
18, 11
6, 5
1, 1
f=3
3, 2
0, 0
0, 0
0, 0
Domain matching level B k=3
k=4
k=5
k=6
f=2
197, 53
87, 29
32, 17
9, 6
f=3
17, 13
6, 6
0, 0
0, 0
f=4
5, 5
0, 0
0, 0
0, 0
2.5 Data Visualization Detected network motifs are presented on the web using ALIVE (http://mouse.ornl.gov/alive). Expression plots were drawn using R (http://www.r-project.org).
Figure 2. Degree distribution of co-expression networks generated under different cutoff values of correlation coefficient (R).
3. RESULTS 3.1 Co-expression Networks To convert a correlation matrix into a corresponding coexpression network, a suitable cutoff value for the correlation coefficient must be chosen. Based on the previous reports that biological networks, including co-expression networks, follow a scale-free distribution of connectivities [1, 7], we chose a cutoff value which gave fewer vertices with higher degree (connectivity). Plots of the degree distribution for graphs generated under a series of cutoff values suggest that a correlation cutoff value of 0.95 is appropriate (Figure 2).
Matching of protein domain information between two genes can be classified into many possible levels, but here we propose only domain matching levels A and B. Level A requires that two proteins have the exact same type of domain, the same number of each type of domain and all domains in the same order in the respective protein sequences from N-terminal to C-terminal. Domain matching level A tries to ensure that the two proteins are fully comparable in terms of domain architecture. Domain matching level B only requires the same type of domain, with no constraints on the number and the order of domains in the proteins. At this level, the domain duplication and domain shuffling during evolution are taken into consideration while ensuring that the basic functions of each protein are comparable. The network motif detection procedure was run separately using different domain matching levels.
This value was surprisingly higher than our expectation. We compared the distribution of correlation coefficients of this dataset with those of several cell/life cycle gene expression datasets and found the distribution of correlations in this dataset showed a characteristic bimodal-like shape while others had belllike shape (data not shown). One of the possible reasons is that the majority of genes in this dataset exhibit periodicity [2]. Within this data set and others, we observed that genes which exhibit periodicity tend to shift the distribution toward higher correlations. We further verified that 2,124 of 2,292 (about 93%) of unique ORFs in the co-expression network (R ≥ 0.95) are in the Overview Dataset of 2,714 ORFs that were selected based on their strong periodic behavior (about 78%).
2.4 Protein Interaction Networks A yeast protein interaction dataset was downloaded from the BIND website (http://www.blueprint.org/bind/bind.php). In the protein interaction network, genes are again vertices (nodes). An un-weighted and undirected edge (connection) is placed between two genes if there is a documented interaction between these two genes. Since the topologies of most protein complexes are unknown at this time, we converted protein complexes into binary interactions using the “matrix” model, which put edges between all possible pairs of genes in the same protein complex. The use of the matrix model facilitates searching for possible instances of network motifs found in co-expression networks in protein complexes. Yeast GO annotations were downloaded from SGD (http://www.yeastgenome.org/).
3.2 Prediction of Network Motifs Using a series of values for parameters k and f, we found a number of putative network motifs under different domain matching levels (Table 1). As shown in Table 1, both increasing k, the size of network motifs and f, the minimum number of nonoverlapping instances, decrease the number of network motifs detected (first number in each cell). The majority of putative network motifs have p-values less than 0.05.
3
Figure 4. Instances found in yeast protein interaction network for network motif shown in Figure 3.
3.3 Confirmation of Prediction by Yeast Protein Interactions
Figure 3. An example of putative network motif detected.
One of the advantages of treating protein domains as functional units of proteins and labeling genes with their protein domain information is the flexibility of doing cross-species comparisons. To gain further confidence in our predictions, we used yeast protein interaction data that includes rich protein complex information, and searched for instances of putative malaria network motifs. The second number in each cell of Table 1 shows the number of malaria network motifs having instances in yeast protein interaction network. We can see that more malaria network motifs were supported by yeast interaction data as the parameters became more stringent.
Furthermore, the biological relevance of the putative network motifs was evaluated by the number of genes within an instance that share the same GO annotation in a biological process category. This is based on the assumption that genes in the same instance of a network motif should share the same biological process if they are indeed functionally related. Although the GO annotations on malaria genes are relatively limited, we can still observe that genes with GO annotations in the same motif instance do share similar terms. We also used the functional gene groups as provided in [2] to check the similarity of functions of genes in the same instances, and this gave similar results.
Figure 4 shows the instances formed by different combinations of 27 genes detected in the yeast protein interaction network for the malaria network motif shown in Figure 3 (note the domain coloring is slightly varied). Forty-five protein complexes stored in the BIND database have at least two members belonging to this group of 27 genes. This strongly suggests that these gene products directly interact with each other under different conditions in various ways. One extreme example is that protein complex 11635 contains six genes forming an exact instance of the predicted network motif. The two largest groups of genes sharing a common GO annotation in this group of 27 genes are a group of 9 genes annotated as ribosomal large subunit assembly and maintenance (GO:27) and the other 8 genes as 35S primary transcript processing (GO:6365). These two groups totally cover 13 out of 27 genes. All of the evidence above suggests that this particular network motif represents a core interaction unit for various protein complexes involving cytoplasmic translation, or even more specifically as ribosome biogenesis. All of the involved malaria genes without any annotation could be annotated as such. The strength of our strategy is both to cluster functionally related genes and to provide more detailed information about relationships among these genes by integrating information from multiple orthogonal sources.
Figure 3A shows a putative network motif detected under domain matching level A, k = 6 and f = 2. This motif consists of six highly co-expressed genes. Three of six genes have the same domain combination as two domains ordered from N-terminal to C-terminal, DEAD/DEAH box helicase (PF00270) and Helicase conserved C-terminal domain (PF00271). These genes are involved in RNA metabolism as suggested by their domain information. One of the six genes has three WD domains, G-beta repeats (PF00400), one has a Brix domain (PF04427) and the last one has GTPase of unknown function (PF01926). The protein domain functions suggest that this network motif is involved in ribosome biogenesis [5, 9]. Figure 3B shows the P. falciparum genes form various instances of the network motifs under different combinations of genes. (Genes are colored in the same way as in Figure 3A to indicate their corresponding domain information.) Only 5 of 13 genes were assigned with functional group annotation and all of these five genes were in Cytoplasmic Translation Machinery functional group [2]. Only 3 of the 13 genes have GO annotations. Significantly, these three genes are a subset of the group of five and they all were assigned with the same GO terms as RNA metabolism (GO:16070), nucleobase, nucleoside, nucleotide and nucleic acid metabolism (GO:6139), cell growth and/or maintenance (GO:8151) and metabolism (GO:8152). These GO annotations are very broad, but agree with the more specific hypothesis that these genes are related to ribosome biogenesis.
3.4 Prediction of Complementary Functional Units A network motif represents a specific combination of individual protein domains, and this combination can carry out a special function shared by individual instances as relatively independent
4
propose a new strategy to analyze gene expression data by integrating a diversity of additional information, such as primary sequence information and protein interaction data. As demonstrated, our approach can easily make use of cross-species information. The strategy of integrating protein domain information into expression data analysis was based on our hypothesis that genes/proteins form relatively independent functional modules. Gene expressions in these modules will be well coordinated because of selective forces or functional constraints. The possible origins of these modules are gene duplication and reuse of protein domains. This then implies that these modules might form some common patterns at protein domain level that we can observe in experimental data. Our predictions can easily lead back to experimental verification and elucidation by examining other data in light of these presumptive network motifs, including studies of networks under other conditions. Several things can be done to refine the analyses. For example, we might be able to combine these motifs together in specific subset of conditions toward building up larger interacting network components. We should be able to loosen the strict requirements for exact cliques for motifs of interest, as evolution will not always preserve exact coexpression matches and not all members of a motif will duplicate. The general approach that we have begun to outline here, we believe, can become a useful tool to ask a number of other interesting research questions about how networks work in the present time and how they arose to work that way over evolutionary time.
Figure 5. Instances of a network motif showing different expression profiles.
subsystems. We hypothesized that individual instances of a network motif could function in different locations and times, dependent upon regulation. The malaria time series data enables us to test this hypothesis by examining the temporal expression profiles of instances of network motifs. Figure 5 shows such an example network motif detected with parameter values at domain matching level B, k = 3 and f = 2. This network motif represents a combination of three independent domains, AhpC/TSA family (PF00578), protein kinase domain (PF00069) and Calcineurinlike phosphoesterase (PF00149) (Figure 5A). Six P. falciparum genes form two independent instances of this network motif (Figure 5B). The AhpC/TSA family contains Peroxiredoxins (Prxs), a ubiquitous family of antioxidant enzymes and Prxs can be regulated by phosphorylation [12]. The paired kinase and phosphatase may reflect that these two Prxs are tightly controlled through phosphorylation and dephosphorylation. Of striking interest is that apparently these six genes all have similar expression profiles and the only major difference is the timing. There is a phase difference between two instances while all three genes within each of two instances have the same expression profiles. When these expression profiles are compared with morphological data [2], we would conclude that one instance (PF08_0131, PFD0865c, PFA0390w) functions at trophozoite stage and another (PF14_0142, PFC0775c, PFL0725w) at schizont stage based on their peak expression values. Having instances in yeast protein interaction data provide further support that these genes do interact directly (Figure 5D). It is worth mentioning that none of these genes were assigned to a functional group [2] and these six genes share very broad GO annotations such as cell growth and/or maintenance (GO:8151) and metabolism (GO:8152).
5. ACKNOWLEDGMENTS Research sponsored, in part, by the Office of Biological and Environmental Research, managed by UT-Battelle, LLC for the U. S. Department of Energy under Contract No. DE-AC0500OR33735 and, in part, by National Institute of Health grants to the University of Tennessee, including NIDA project No. 5-P01DA015027-02 and NIAA project No. 5-U01-AA012512-02. This research has used resources provided by the Scalable Intracampus Research Grid (SInRG), a project at the University of Tennessee supported by the National Science Foundation under award EIA9972889. It has also been supported by the Office of Naval Research under grant N00014-01-1-0608, by the Department of Energy under contract DE-AC05-000R22725, and by the Tennessee Center for Information Technology Research under award E01-0178-261.
6. REFERENCES [1] Bhan, A., Galas, D.J. and Dewey, T.G. A duplication growth model of gene expression networks. Bioinformatics, 18 (11). 1486-1493. [2] Bozdech, Z., Llinas, M., Pulliam, B.L., Wong, E.D., Zhu, J. and DeRisi, J.L. The Transcriptome of the Intraerythrocytic Developmental Cycle of Plasmodium falciparum. PLoS Biol, 1 (1). E5.
4. DISCUSSION
[3] Chang, L. and Karin, M. Mammalian MAP kinase signalling cascades. Nature, 410 (6824). 37-40.
With the rapid development of high-throughput methods such as microarrays in recent years, massive amounts of experimental data have been collected for different species under various conditions. New computational approaches are needed to analyze these data in an integrative way and provide more reliable results with finer resolution for experimental verification. Here we
[4] Chang, T.S., Jeong, W., Choi, S.Y., Yu, S., Kang, S.W. and Rhee, S.G. Regulation of peroxiredoxin I activity by Cdc2-
5
building blocks of complex networks. Science, 298 (5594). 824-827.
mediated phosphorylation. J Biol Chem, 277 (28). 2537025376. [5] Eisenhaber, F., Wechselberger, C. and Kreil, G. The Brix domain protein family - a key to the ribosomal biogenesis pathway? Trends in Biochemical Sciences, 26 (6). 345-347.
[9] Neer, E.J., Schmidt, C.J., Nambudripad, R. and Smith, T.F. The ancient regulatory-protein family of WD-repeat proteins. Nature, 371 (6495). 297-300.
[6] Langston, M., Lin, L., Peng, X., Baldwin, N., Symons, C., Zhang, B. and Snoddy, J. A Combinatorial Approach to the Analysis of Differential Gene Expression Data: The Use of Graph Algorithms for Disease Prediction and Screening. in Methods of Microarray Data Analysis IV, Springer-Verlag, New York.
[10] Pawson, T. and Nash, P. Assembly of cell regulatory systems through protein interaction domains. Science, 300 (5618). 445-452.
[7] Lee, H.K., Hsu, A.K., Sajdak, J., Qin, J. and Pavlidis, P. Coexpression analysis of human genes across many microarray data sets. Genome Research, 14 (6). 1085-1094.
[12] , Z.A., Schroder, E., Robin Harris, J. and Poole, L.B. Structure, mechanism and regulation of peroxiredoxins. Trends Biochem Sci, 28 (1). 32-40.
[11] Shen-Orr, S.S., Milo, R., Mangan, S. and Alon, U. Network motifs in the transcriptional regulation network of Escherichia coli. Nature Genetics, 31 (1). 64-68.
[8] Milo, R., Shen-Orr, S., Itzkovitz, S., Kashtan, N., Chklovskii, D. and Alon, U. Network motifs: Simple
6