[20] K. Lepak, H. Cain, and M. Lipasti. Redeeming ipc as a performance ... [34] Dean Tullsen, Susan Eggers, and Henry Levy. Simultaneous multithreading: Max ...
IEEE International Parallel and Distributed Processing Symposium (IPDPS), April 2006
Detecting Phases in Parallel Applications on Shared Memory Architectures Erez Perelman† † Department
Marzia Polito‡ Brad Calder†
Jean-Yves Bouguet‡ Carole Dulong‡
John Sampson†
of Computer Science and Engineering, University of California, San Diego ‡ Intel Corporation
Abstract
architecture simulation by simulating a single representative portion of each phase of execution [1, 24, 26, 28]. These prior techniques have focused on finding phase behavior in serial applications. In this paper we build upon these prior techniques to find phase behavior in parallel applications. We focus on providing parallel phase analysis for shared memory multi-processors and applications with data parallelism [13, 23, 33]. In this paper, we focus on machines with 2-4 processors because of the expected wide spread deployment of small multi-core machines that will occur over the coming years. There are two main goals with this work. First we propose a parallel program analysis technique that can analyze the phase behavior across different amounts of parallelism (number of threads) for a program/input pair. The primary goal is to enable a user to track how different phases of a program’s execution scale across different number of threads to see which phases benefit the most from the additional parallelism. A secondary goal is to exploit the phase characterization for guiding the picking of simulation points for deterministic multi-threaded simulators. This is an enhancement to the single threaded SimPoint [28] algorithm, where we find representative samples across the threads of a parallel program to accurately represent the entire parallel execution to guide multi-threaded simulation.
Most programs are repetitive, where similar behavior can be seen at different execution times. Algorithms have been proposed that automatically group similar portions of a program’s execution into phases, where samples of execution in the same phase have homogeneous behavior and similar resource requirements. In this paper, we examine applying these phase analysis algorithms and how to adapt them to parallel applications running on shared memory processors. Our approach relies on a separate representation of each thread’s activity. We first focus on showing its ability to identify similar intervals of execution across threads for a single run. We then show that it is effective at identifying similar behavior of a program when the number of threads is varied between runs. This can be used by developers to examine how different phases scale across different number of threads. Finally, we examine using the phase analysis to pick simulation points to guide multithreaded simulation.
1 Introduction The behavior of a program is not random - as programs execute, they exhibit cyclic behavior patterns. Recent research [1, 2, 9, 10, 11, 24, 26, 28, 29], has shown that it is possible to accurately identify and predict these phases in program execution. Phase behavior can be exploited for accurate architecture simulation [27, 28], to save energy by dynamically reconfiguring caches and processor width [2, 9, 10, 29], to guide compiler optimizations [3, 22] and finally to provide feedback to the programmer to guide program optimization. All of these techniques take advantage of the phase behavior that exists in programs. Prior work on phase classification [18, 26, 28, 29] divides a program’s execution into non-overlapping fixed-length intervals. An interval is a contiguous portion of execution (a slice in time) of a program. A phase is a set of intervals within a program’s execution that have similar behavior (e.g., CPI, cache miss rates, branch miss rates, etc), regardless of temporal adjacency. This means that intervals that belong to a phase may appear throughout the program’s execution. Some of the prior work uses an off-line clustering algorithm to break a program’s execution into phases to perform fast and accurate
2 Related Work Program phase behavior can be detected by examining a program’s working set [7], and several researchers have examined phase behavior in programs. In this section we give a brief overview of this related work. Balasubramonian et al. [2] proposed using hardware counters to collect miss rates, CPI and branch frequency information for every hundred thousand instructions. They use the miss rate and the total number of branches executed for each interval to dynamically evaluate the program’s stability. They used their approach to guide dynamic cache reconfiguration to save energy without sacrificing performance. Dhodapkar and Smith [8, 9, 10] found a relationship between phases and instruction working sets, and that phase changes occur when the working set changes. They proposed dynamic reconfiguration of multi-configuration units in response to phase changes indicated by working set changes. 1
3 Methodology and Metrics
They use working set analysis for reconfiguration of instruction cache, data cache and branch predictor to save energy [9, 10].
The data presented in this paper was collected on a 4-node Itanium II. This platform has four Intel T M Itanium II processors at 1 GHz with a 256KB L2 cache and a 3MB L3 cache, an 870 Intel T M chipset, and a 400MHz front side bus. This is a multi-processor system, and each processor has its own L2 and L3 cache, and only main memory is shared across the processors. For this work we only run one thread per processor node. Our data collection methodology utilizes the commercially available Intel VTune Performance Analyzer [35]. Our phase analysis framework processes the VTune output file (in tb5 format) collected from the execution of a program on any platform for which VTune is available. The applications examined in this work are a selection from an extensive set of experiments we ran. We experimented with both OpenMP and p-thread, and on taskparallel applications. We found the definition of phases proved to be coherent even when different threads clearly do not execute the same phase at the same time. To show the range of parallel phase behavior found we provide results for the OpenMP C version of the NAS parallel Benchmarks (NPB) [23], which are derived from computational fluid dynamics (CFD) applications, consisting of five kernels and three pseudo-applications, and two more benchmarks OpenMP-parallelized:
Hind et al. [14] provide a framework for defining and reasoning about program phase classification focusing on how to appropriately define granularity and similarity to perform phase analysis. Georges et al. [12] propose an off-line method-level phase analysis approach for Java workloads. Execution time for each method invocation is used to generate a dynamic callgraph which is then analyzed to identify method-level phases for serial executions. In [27, 28], Sherwood et al. proposed that periodic phase behavior in programs can be automatically identified by profiling the code executed. They used techniques from machine learning to classify the execution of the program into phases (clusters). They found that intervals of execution grouped into the same phase had similar behavior across all architectural metrics examined. From this analysis, they created a tool called SimPoint [28], which automatically identifies a small set of intervals of execution (simulation points) in a program for detailed architectural simulation. These simulation points provide an accurate and efficient representation of the complete execution of the program. They then extended this approach to perform hardware phase classification and prediction [19, 29]. Patil et al. [24] has been examining using SimPoint to pick simulation points to guide simulation at Intel.
• SNP (Single Nucleotide Polymorphism) is capable of detecting structure around a single nucleotide polymorphism in a DNA chain. This application has been coded by using Intel’s Open Source Probabilistic Network Library (PNL) [33]
Isci and Martonosi [15, 16] have shown the ability to dynamically identify the power phase behavior using power vectors. Deusterwald et al. [11] recently used hardware counters and other phase prediction architectures to find phase behavior.
• SVM RFE (Support Vector Machine Recursive Feature Elimination [13]) is based on the state of the art Support Vector Machine classification algorithm and is used for eliminating gene redundancy in micro-array data analysis.
In [6], Davies et al. used sampled information extracted by the Intel T M VTune Performance Analyzer in order to construct an approximate yet faithful representation of program execution within a given interval. Such information is collected at runtime on native hardware, but is not influenced by the performance of the hardware itself. Performance data is collected at the same time for subsequent validation of results. Analogous methods to SimPoint [28] are then employed to extract Simulation Points. Annavaram et al. [1] used this VTune approach to examine phase behavior for database applications. We use this VTune sampling approach to collect our code vectors, which is detailed in Section 4.
Both of these applications repeatedly access very large databases, and apply general purpose machine learning and data mining algorithms to bioinformatics applications. 3.1 Metrics for Evaluating Phase Classification Phase Detection is performed in a completely performanceindependent fashion, solely based on code signatures as described in Section 4. A major assumption underlying this and most of the phase analysis related work is that similar code execution intervals yield similar performance. To this end, we decide to also collect performance data at runtime using VTune while collecting the code signature. This allows us to later verify the assumption and validate our work. The metrics we examined from VTune are CPI, together with L2 and L3 Hits and Hit-Rates. We have found that these are the key metrics to analyze in order to understand the performance of a multi-threaded application, which is often bounded by issues such as data-reuse and conflicts between caches.
Van Biesbrouck et al. [4] used phase behavior to guide simulation for Simultaneous Multithreading [34]. A co-phase matrix is generated to represent the per-thread performance for each potential combination of the single-threaded phase behaviors that can be found when multiple programs are run together. The co-phase matrix is populated by collecting samples of the programs’ phase combinations, and is used to guide fast forwarding between samples. 2
We measure the effectiveness of our phase classifications by examining the similarity of program metrics within each phase. After classifying a program’s intervals into phases, we compute the phase based standard deviation for each metric (e.g., CPI, data cache hit rates). This is computed by combining the weighted standard deviation from each phase. We weight each phase’s standard deviation by the relative size the phase represents from the entire execution, since phases can have significantly different execution spans. We compare this phase-based standard deviation to the standard deviation seen when looking at all of the intervals of the program’s execution. Better phase classifications will exhibit lower per-phase standard deviation for an architecture metric when compared to the standard deviation of the complete execution. For example, if all of the intervals in the same phase have exactly the same CPI, then the per-phase standard deviation will be zero.
sional array where each element in the array corresponds to one Extended Instruction Pointer in the program execution. The EIPV contains all zeroes at the beginning of each interval of execution. During each interval, the number of times each EIP occurs during sampling with VTune is recorded, and each EIP’s final interval count is stored in the EIPV. The intuition behind this is that the behavior of the program at a given time is directly related to the code executed during that interval [28]. The EIP vectors can be used as code signatures for each interval of execution: each vector tells us which portions of code are executed, and how frequently. For a suitably chosen sampling frequency, the sampled information gives a sufficiently accurate estimate of the frequency of execution of significant EIPs within a given interval. By comparing the EIPVs of two intervals, we can evaluate the similarity of those two intervals. If the distance between the EIPVs is small, then the two intervals spend about the same amount of time in roughly the same code, and therefore the performance of those two intervals should be similar.
4 Profiling Program Behavior In this section we provide a description of the basic structure we use in order to represent code execution in a given interval.
4.2 Sampled Basic Block Vectors The construction of EIPVs has been proposed in [6] as an alternative to Basic Block Vectors (BBVs), first introduced in [27]. A basic block is a single-entry, single-exit section of code with no internal control flow. Similarly to EIPVs, a Basic Block Vector (BBV) is a one dimensional array where each element in the array corresponds to one static basic block in the program. During each interval, the number of times each basic block in the program has been entered is counted, and the count is recorded in the BBV. Lau et al. [17] mapped the EIPs of an EIPV back to coarser program constructs, namely loops and procedures. This improved phase classification when compared to EIPVs for the SPEC CPU2000 suite on IA-32 Linux. This helped reduce the artificial noise between two EIPV code signatures that were classified as different because there were different counts between the two vectors for EIPs from the same basic block. To address this problem, Lau et al. [17] proposed mapping the EIPs back to the static code constructs to create Sampled Code Vectors for each interval where each dimension was the number of times each static loop, procedure, or basic block was sampled. In this paper, we examine mapping the EIPs down to basic blocks to create sampled basic block vectors. The mappings in [17] were produced by using Pin to instrument IA-64 binaries. We implemented mapping EIPs to basic blocks using the Itanium version of Pin. We statically process a binary, marking every instruction as a conditional branch, a conditional branch target, both, or neither, and then use these markings as boundaries in assigning a block ID to every instruction in the binary. We then use this ID mapping (a dimension in the sampled BBV) to coalesce all dimensions in the EIPV that map to the same block-ID into a single dimension with weight equal to the summation of the weights of the remapped EIP dimensions, producing a sampled BBV. For the results in this paper we use the sampled BBVs to find the phase behavior in
4.1 Extended Instruction Pointers Davies et al. [6] proposed using hardware sampling of instruction pointers to represent code signatures for finding phase behavior, and such an approach was recently used by Annavaram et al. [1] to try to find phase behavior in database workloads. In this work, we also use Extended Instruction Pointers (EIPs) to find phase behavior [1]. An EIP is the memory address of an instruction, analogous to PC. The EIPs are extracted while running an application on native hardware. VTune, a commercially available software performance analyzer for Intel T M architectures [35] is used to collect the EIPs. We focus on this approach, instead of instrumentation, since VTune has the ability to non-intrusively analyze any application running on native hardware with negligible overhead. The underlying VTune driver monitors a large number of performance/code execution attributes stored in the embedded event counters of the Intel processors while a program is being executed on real hardware. It collects information, such as EIPs and CPI, which are then used to perform code clustering, phase analysis, and validation. VTune interrupts execution at regular intervals of instructions executed and records the EIP and event counter totals (e.g. clock tick count, instruction count.) Sampling at a high frequency can significantly increase execution overhead. Conversely, too low a sampling frequency will lead to sparse data that could compromise phase analysis. Based on our experimental data, we set the VTune sampling rate to be once every hundred thousand instructions. It proved to be a good trade-off between execution overhead and collecting adequate sampling data. At this sampling rate, the typical overhead of using VTune is not more than 2%. Annavaram et al. [1] used the EIPs to create an Extended Instruction Pointer Vector (EIPV), which is a one dimen3
parallel programs.
it handles the data from multiple threads at different stages in the algorithm. Several modifications are essential to ensure that the phases found between the threads are consistent and can be compared across the threads. The algorithm is described in the following steps:
5 Discovering Phases for a Single Parallel Run Parallel applications can have multiple threads executing different parts of the binary at the same time. This presents new challenges in program characterization and phase analysis. In this section we provide a detailed description of the algorithm we use that characterizes parallel applications. In this section we focus on analyzing a single parallel run, and in Section 6 we describe how to extend this to examine behavior varying the number of threads.
1. We first collect code execution frequencies of EIPs for each thread in the application. This data is partitioned into intervals of 100 million instructions, where each thread has a unique set of intervals representing its own execution. 2. For each thread we have a trace of intervals that represents its execution. We then generate a large combined trace for all the threads by concatenating the interval traces from each thread. This step does not contaminate the per thread execution behavior, since each thread occupies a non-overlapping sub-section in the trace. The purpose of this step is to find intervals of execution that are similar across the different threads. 3. We then cluster all the intervals into a set of phases. For this step we use the k-means [21] algorithm of SimPoint. SimPoint determines the number of phases by clustering over a range of values, and then use the Bayesian Information Criterion (BIC) [25] to quantify the goodness of each clustering. In this work we considered a range of up to 10 phases, and a larger range can be used for attaining higher accuracy.
5.1 Phase Analysis Merging All Threads Together The foundation of parallel application characterization relies on preserving the parallel structure of execution during phase analysis. The thread level behavior of the application is the framework through which the parallel structure is perceived. Hence, the representation of the thread level behavior is a critical component in the analysis. One possible thread representation is an agglomerated (combined) view of all the activity across the different threads to create intervals of execution. This is achieved by agglomerating the execution samples collected from individual threads into a single execution trace and creating fixed length intervals from that. For this approach the different thread behaviors would be intermingled into one trace as they occur during execution. This trace can be run through existing phase analysis techniques but has the following drawback: the phases discovered in this trace do not apply to any individual threads, but instead apply to the combination of behaviors from all threads. This provides the following issues: (1) it is difficult to interpret the behavior of individual threads and (2) it is hard to validate the behavior of an agglomerated interval, since it represents a combination of parts of several threads of execution. If threads execute at different rates relative to each other, then the phase representation will not be consistent across the intervals formed. We tried the agglomerated method, and it can provide a coarse parallel characterization, but is not sufficient for low level understanding of the parallel phase behavior.
This algorithm finds the phases in a parallel execution. Each phase defines a particular code behavior in the parallel execution that is independent of the multi-thread interaction, since we are only looking at the code signatures for the intervals on a per thread basis. We also find similar execution across threads, since we cluster all of the threads intervals together at the same time. The vectors are formed on a per-thread basis, but the clustering is performed looking at all of the intervals from all of the threads at once. Therefore, the phases discovered are applicable across all threads, where similar behavior observed across multiple threads will be captured and characterized as one behavior. A method similar to this was independently developed and briefly examined in [24]. 5.4 Thread Execution Reconstruction The phase analysis described above discovers the phase behavior across threads by clustering the BBVs collected in all thread executions in terms of instruction count. We now describe how to map the phase information found to the threaded program’s execution over time. In a parallel execution there may be synchronization points, where some threads are waiting for other threads before continuing execution or certain threads are spawned in the middle of execution. We take this into consideration when forming the fixed length interval, so that an interval does not span across these types of stalls. In addition, we need to take this into consideration when mapping the phase classification back to a parallel execution trace.
5.2 Keeping the Thread Data Separate Instead of agglomerating the behavior of the threads, we found that representing each individual thread in the application independently is the key to parallel phase analysis. For this approach each thread has its own set of sampled BBVs for its execution. In this manner each thread is an independent entity. We do this, because we want to find phase similarities across threads. 5.3 General Algorithm The parallel phase analysis algorithm is similar to the serial SimPoint [28] algorithm at a high level. The execution of the application is broken down into intervals which are then clustered into a set of phases. It is different, however, in how 4
BM bt.A
The goal here is to identify visually for a user what phase of execution each part of a thread’s execution is in. VTune outputs EIP samples in the order they were collected across the multiple processors and threads. This provides a complete sequential ordering and EIP trace among the threads of execution. We use this trace to reconstruct a total count of instructions retired (global instruction count) across all threads of execution. This allows us to correlate when a fixed length interval, which was assigned to a phase for a thread, occurs during execution relative to the intervals from other threads. We can then examine cross-thread phase behavior over time, since intervals from different threads can be grouped into the same phase. Note, since the intervals were formed using only per-thread instruction counts, the start and end of the intervals may not be synchronized across all threads. This leads us to the step of reconstructing exactly when each interval starts and stops in terms of the overall execution time.
cg.B ep.B ft.B is.B lu.B mg.B sp.A snp svm Avg
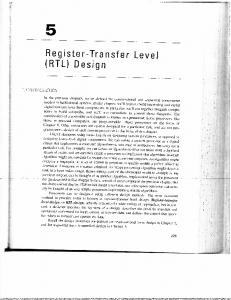
Figure 1 graphically shows the phase classification for the NAS benchmark ft.B when using 4 threads with respect to instructions retired over time. The top most sub-figure shows the phases color coded across the entire execution. In this plot, the x-axis shows the total number of instructions (global instruction count) retired for all the threads. The global instruction count, which is across all threads being executed, was also gathered along with the EIPs during VTune sampling. The global instruction count was not used to perform the phase classification, we just use it to map the per-thread phase intervals to execution time (represented by global instruction count). The y-axis is partitioned into 4 sections, 1 per thread. Each phase has a particular color (or shade). If a thread has an interval of white it means that no instructions were retired during that interval. The lower sub-figures are showing L3 cache references, and L3 cache hit rates. The xaxis in these sub-figures are showing the number of instructions retired, and are equivalent to the x-axis in the top subfigure for phases.
#T 2 4 2 4 2 4 2 4 2 4 2 4 2 4 2 4 2 4 2 4
CPI 0.9 (+/- 0.40) 1.1 (+/- 0.44) 1.4 (+/- 0.60) 1.5 (+/- 1.05) 1.0 (+/- 0.01) 1.0 (+/- 0.01) 0.7 (+/- 1.58) 0.8 (+/- 2.60) 3.0 (+/- 5.77) 4.2 (+/- 10.0) 1.1 (+/- 0.24) 1.0 (+/- 0.20) 0.8 (+/- 1.27) 0.9 (+/- 1.90) 1.6 (+/- 0.25) 2.2 (+/- 0.34) 1.0 (+/- 0.09) 0.9 (+/- 0.05) 0.9 (+/- 0.32) 1.4 (+/- 0.41) 1.4 (+/- 1.38)
L2 HR 0.98 (+/- 0.02) 0.98 (+/- 0.01) 0.65 (+/- 0.02) 0.66 (+/- 0.02) 0.99 (+/- 0.00) 0.99 (+/- 0.00) 0.95 (+/- 0.04) 0.97 (+/- 0.05) 0.83 (+/- 0.13) 0.82 (+/- 0.12) 0.95 (+/- 0.02) 0.95 (+/- 0.01) 0.99 (+/- 0.01) 0.99 (+/- 0.01) 0.96 (+/- 0.00) 0.96 (+/- 0.00) 0.95 (+/- 0.02) 0.94 (+/- 0.03) 0.91 (+/- 0.05) 0.90 (+/- 0.04) 0.92 (+/- 0.03)
L3 HR 0.51 (+/- 0.10) 0.53 (+/- 0.10) 0.87 (+/- 0.03) 0.87 (+/- 0.02) 0.98 (+/- 0.04) 1.00 (+/- 0.01) 0.87 (+/- 0.14) 0.75 (+/- 0.25) 0.75 (+/- 0.33) 0.74 (+/- 0.33) 0.49 (+/- 0.10) 0.69 (+/- 0.11) 0.49 (+/- 0.08) 0.46 (+/- 0.08) 0.47 (+/- 0.05) 0.46 (+/- 0.02) 0.06 (+/- 0.07) 0.36 (+/- 0.21) 0.48 (+/- 0.21) 0.48 (+/- 0.18) 0.61 (+/- 0.12)
#P 6 5 7 5 5 5 6 9 8 4 4 4 6 8 9 7 8 6 6 5 6
Table 1: Full execution CPI, L2 and L3 hit rates with standard deviation across all intervals of execution for each benchmark with 2 and 4 threads (#T). The number of phases (#P) is equivalent to the number of simulation points. a portion of the code is not parallelized or requires a smaller number of threads than the available thread-count. It can also happen for other synchronization issues, or OS activity; note that this naturally happens at the beginning or end of a short serial phase. 5.5 Single Parallel Run Results We now examine the performance of our parallel phase analysis on the NAS benchmark suite and two data mining benchmarks. The programs and methodology used are described in Section 3. 5.5.1 Reduction of Variance The goal of parallel phase analysis is to group together program execution across the different threads by only looking at code signatures. If the phase classification worked well, then the variance in CPI, L2 and L3 cache hit rates should decrease between all of the intervals within a phase when compared to the variance seen across the complete execution of the program. For all of the results an interval size of 100 million instructions and a maximum limit of 10 phases (clusters) was used when performing the phase analysis. Table 1 shows the mean and standard deviation for CPI (cycles per instruction), and L2 and L3 caches hit rates for the full execution. The number in parenthesis is the standard deviation. Results are shown for each program for a 2-thread parallel run and a 4-thread run. The last column is the number of phases chosen by our analysis for that run. Note, all of the CPI and hit rate results are the average and standard deviation seen across all of the intervals of execution. For example, svm 2-thread has a CPI of 0.87 with a standard deviation of 0.32 over all of the intervals of execution, its L3 hit rate is 48% with a standard deviation of 21%, and its execution was clustered into 6 phases.
When mapping a per-thread’s intervals to the global instruction count, if there is a large gap (greater than an interval size) in a per-thread’s execution with respect to the global instruction count, then a blank (white) interval is shown representing that the thread was stalled or context switched out during that part of execution. It is interesting to see how the phase analysis, performed ignoring any time or similarity information among threads, does indeed automatically detect phases coherently with the execution flow across threads. The benchmark ft.B represented in Figure 1 is a data-parallel application, and the phase analysis correctly places all threads in the same phases at the same time for the majority of the execution. However, occasionally different roles for the different threads are also seen; this occurs in the figure whenever one thread is in charge of initialization or collecting results. When this occurred the code signature formed clearly identified that execution as different. White intervals visible in the picture represent intervals of execution where one or more threads are stalled because 5
Workload : ftB −− Thread count: 4
Threads
1 2 3 4 500
1000
1500
2000
2500
3000
3500
4000
4500
5000
5500
Instruction Retired (x 100000000)
L3 Cache Hit Rates
L3 Cache References
6
x 10 6 4 2 0 0
1000
2000
3000
4000
5000
0
1000
2000
3000
4000
5000
1 0.8 0.6 0.4
Instruction Retired (x 100000000)
Figure 1: Phase classifications and L3 performance metrics for a four-threaded run of ft.B. Phase classifications are applied to each thread independently. The NAS benchmark suite shows several different potential program behaviors, where ep.B and is.B are at the two extremes. In Table 1, the program is.B has a huge standard deviation in CPI (+/- 10) for 4-threads because there are intervals of execution that have a spike greater than 10 CPI. The serial part of the code for is.B covers approximately 80% of the execution (instructions retired), and this makes it a very peculiar one among the NAS benchmarks. In comparison, the results for ep.B show that across all of execution there is a low standard deviation across all of the metrics.
chitecture metrics, when examining them across all of the intervals within a phase. Figures 2, 3 and 4 show the reduction in the standard deviation of CPI, L2 and L3 hit rates over the baseline values shown in Table 1 for the 2-thread and 4-thread runs. This is computed by first computing the difference between the standard deviation of the baseline and the weighted standard deviation of the phases, and then dividing it by the baseline standard deviation. A large reduction in standard deviation means that the phase analysis succeeds in breaking varying program behavior into homogeneous phases. The results show that when looking at the program’s execution in terms of phases that on average the standard deviation for CPI is reduced by 50%, the L2 hit rate by 60% and the L3 hit rate by 45%. The reason why there is little reduction in the standard deviation for ep.B for L2 and L3 hit rates is that there was little standard deviation to begin with as shown in Table 1.
Table 1 shows that the CPI can be stable or increase when going from 2-threads to 4-threads. This happens whenever the speedup obtained by executing the benchmark in parallel does not scale linearly with the thread count, and the parallelization introduces overhead. The CPI shown is calculated on a per-thread basis, and does not represent a measure of speed of execution of the overall program on the machine, but rather a measure of speed of execution of instructions on each single thread.
6 Discovering Phases Across Parallel Runs
We now examine how well the phase classification, based on code, worked in terms of the underlying architecture metrics. If the phase analysis groups the intervals correctly, then we should see reductions in the standard deviation of these ar-
One of the motivations for us to perform phase analysis for parallel programs it to be able to examine the same behavior and performance when using a different number of threads. 6
In this section, we describe how we achieve this “threadvarying” phase analysis by extending the parallel phase analysis described in Section 5.
4T CPI
80 70 60
6.1 Phase Analysis Varying the Number of Threads The prior section described how to find phases in a single parallel run of a program. The goal of this analysis is to find similar intervals of execution between different runs as the number of threads is varied. We call this thread-varying phase analysis. We want to perform this analysis on a parallel program running a specific input varying the number of threads. We start by combining all of the sampled BBVs for each thread for a given run as described in Section 5. We then concatenate each of these run’s sampled BBVs together, where the number of threads has been varied, for a specific parallel binary/input. SimPoint phase analysis is then run over this vector trace. This results in a clustering that successfully groups together not only intervals from separate threads of the same run, as shown in the prior section, but also intervals from different runs, where the number of threads were varied.
50 40 30 20 10
m
Av g
sv
sn p
sp .A
lu .B m g. B
is .B
ft. B
ep .B
cg .B
0
bt .A
% Decrease in CPI StdDev
2T CPI
90
4T L2 HR
6.2 Thread-Varying Phase Analysis Results In this work we applied our thread-varying phase analysis on four separate runs for each program: serial, 2 threads, 3 threads, and 4 threads. We combined the runs as described, and computed the phases across the threads and runs. In doing this thread-varying phase analysis, we verified that the intervals grouped within the same phase from the same run had similar architecture metrics as found in the previous section. But intervals from different runs (different number of threads) grouped into the same phase will not have the same architecture metrics. This is exactly what we want to analyze. We use this thread-varying analysis to see for similar code regions how the architecture metrics varied for a phase as the number of threads was varied. To show this, we will examine the execution of snp running with a single thread (serial execution), as well as 2, 3, and 4 threads. We then combine the threads in each of the parallel runs and perform our thread-varying phase analysis. Note that the number of phases chosen is different from Section 5 since we are performing the thread-varying clustering. Figure 5 shows the phases discovered across four different parallel executions for snp. The top most sub-figure displays the phases in a single threaded run of snp. The next two subfigures below show phases in a two threaded run. The next three sub-figures are for a three threaded run, and the last four sub-figures are a four threaded run. The x-axis shows the phase classification results over the global count of all instructions executed across all threads. Each phase is denoted by a different color or gray-scale (as shown on the right side of the Figure), and the same phase colors are used across the different runs. White means that no instructions are executed during that interval due to synchronization or serialization. Figure 5 shows that even though each run has a different number of threads, we are able to identify the same regions of execution across the different runs. The initialization phase
Av g
m
sn p
sp .A
lu .B m g. B
is .B
ft. B
ep .B
cg .B
2T L2 HR
sv
100 90 80 70 60 50 40 30 20 10 0
bt .A
% Decrease in L2 HitRate StdDev
Figure 2: Percent reduction in standard deviation for CPI with phase analysis for 2 and 4 threads (T)
90
2T L3 HR
80
4T L3 HR
70 60 50 40 30 20 10
Av g
m sv
sn p
sp .A
lu .B m g. B
is .B
ft. B
ep .B
cg .B
0
bt .A
% Decrease in L3 HitRate StdDev
Figure 3: Percent reduction in standard deviation for L2 hit rate with phase analysis for 2 and 4 threads (T)
Figure 4: Percent reduction in standard deviation for L3 hit rate with phase analysis for 2 and 4 threads (T) This can be used by programmers and scientists to study where they should tune their code and to better understand the implications of increasing the number of processors to run an application on. For example, to analyze the benefit of parallelizing a program we would like to take a representative slice of the program’s execution when using 2 threads, and that same exact slice for 3 threads, 4 threads, etc... and compare how the program’s CPI or cache hit rates change as we vary the number of threads. Prior work on the scalability of parallel applications [5, 31, 32] has focused on how the overall execution of the program scales as the number of threads varies. In comparison, we are instead focusing on the scalability of the program in terms of how each of its phases scales as the number of threads varies. 7
Thread 1
1000
2000
3000
4000
5000
6000
7000
8000
9000
10000
Thread 1
Thread 2 1000
2000
3000
4000
5000
6000
7000
8000
9000
10000
Thread 1 Thread 2 Thread 3 1000
2000
3000
4000
5000
6000
7000
8000
9000
10000
Thread 1 Thread 2 Thread 3 Thread 4 1000
2000
3000
4000
5000
6000
7000
8000
9000
10000
5 4 3 2 1 N/A 5 4 3 2 1 N/A 5 4 3 2 1 N/A 5 4 3 2 1 N/A 5 4 3 2 1 N/A 5 4 3 2 1 N/A 5 4 3 2 1 N/A 5 4 3 2 1 N/A 5 4 3 2 1 N/A 5 4 3 2 1 N/A
Figure 5: Phases discovered across 4 different parallel executions of snp: serial, 2, 3, and 4 threads. The x-axis shows the phase classification results over the global count of all instructions executed across all threads. for snp is the shade of the first phase in the single threaded execution. Exactly one thread has that color and all other threads are inactive during that part of execution for the multithreaded runs. It is also worth noting that the phases also line up along the x-axis. In this figure the x-axis is the number of instructions retired across all threads in a run, and this means that the phases found between different runs execute a similar number of instructions.
trend is visible for each phase, however the trend varies from phase to phase. One can see that Phase 2 and Phase 4 (the top 2 lines) benefit the most from the parallelization, and one can go back to the code to analyze why this is the case. It also shows that more significant speedups can be achieved by parallelizing Phase 2 and 4 up to four threads, whereas Phase 5 has diminishing returns from parallelization once two threads are used. This is a confirmation that it is worthwhile to perform phase analysis on parallel benchmarks, as each phase exhibits different parallelization potential and performance.
Figure 6 shows the number of cycles per phase across 4 different parallel executions of sp.A. The y-axis is the number of cycles and x-axis is the different runs varying the number of threads 1, 2, 3 and 4. In this Figure, the number of cycles (y-axis) is the actual time spent executing the benchmark. Cycles are not accounted for on a per-thread basis, as it was in the CPI computation of Section 5, but actually represent the time elapsed while one or more threads is in a specific phase. If two or more threads are in two different phases during a part of execution, the time elapsed is split among them with appropriate weights. For example, Phase 2 (the top line) accounts for 11 billion cycles of execution with one thread, and only 3.8 billion cycles when four threads are used.
Figure 7 shows the number of instructions retired that are classified into each of the phases across 4 different parallel runs (again, 1, 2, 3, and 4 threaded executions). This shows that across the different runs, each phase occupies a similar number of executed instructions. For example, for Phase 2 (the top line), the total number of instructions executed is 80 billion with one thread, and about 85 billion for 4 threads. The important observation here is that the proportion of intervals assigned to each phase is the same across the different runs when varying the threads. This shows that phase behaviors coherently correspond to the execution of different paths in the code. The thread-count increase changes the distribution of the execution of these paths among different threads, but does not significantly alter their nature nor the
This Figure is an example of the coherency of our phase definition. Increasing thread-count improves the performance of each phase for this application. An intuitive downward 8
Relative Error Using SimPoint
1.1E+11
Phase1 Phase2 Phase3 Phase4 Phase5
1.0E+11 9.0E+10 8.0E+10
Cycles
7.0E+10 6.0E+10
2T SP CPI
18%
2T SP L2 HR
4T SP CPI
4T SP L2 HR
16% 14% 12% 10% 8% 6% 4% 2% 0% bt.A
cg.B
ep.B
ft.B
is.B
lu.B
mg.B
sp.A
snp
svm
Avg
Figure 8: SimPoint relative error rates for CPI, L2 and L3 hit rates
5.0E+10
sents (no matter what thread the interval came from). The architecture metrics for these simulation points are then gathered during simulation, and the results are combined with the weights to create an overall estimate of the program’s execution in terms of architecture metrics. See [28] for a complete description of SimPoint. Figure 8 shows the relative error rates for CPI and L2 hit rate for the 2-thread and 4-thread runs when comparing the parallel SimPoint estimated metric to the overall program’s baseline metric. The number of simulation points used for each program is shown in Table 1. The results show that the CPI error is 15% or less, with an average of 3% for the 2thread runs, and similar results are seen for the cache hit rate. Lower error rates are seen for the 4-thread runs. Programs like is.B have higher error rates due to the huge deviation in program behavior between the parallel and sequential part of execution. Even so, the error rate is small (less than 4%) for 4-threads. This result, along with the reduction in standard deviation as shown in Section 5, shows that our approach groups similar parts of execution together based only on the sampled code signatures. It is important to note that the absolute error of a program/input run on one hardware configuration is not as important as tracking the change in metrics across different architecture configurations. When using simulation points for an architecture design space exploration the CPI error compared to the baseline is not as important as making sure that this error is consistent between the different architectures being examined. What is important is that a consistent relative error is seen across the design space exploration, and SimPoint has this consistent bias as shown in [26]. Therefore, even though a program/input using SimPoint might have 10% error when compared to the complete execution, we have found that when aggressively varying the design space we see this same relative error in the same direction. This allows the designer, when using SimPoint, to make the correct design space exploration trade-offs, since we have found that the relative error is consistent and biased in the same direction.
4.0E+10 3.0E+10 2.0E+10 1.0E+10
1
2
3
4
Thread Count
Figure 6: Number of cycles per phase across 4 different parallel executions of sp.A: serial, 2, 3, and 4 threads. 1E+11
Phase1
Phase2
Phase3
Phase4
Phase5
9E+10 8E+10
Instructions Retired
20%
7E+10 6E+10 5E+10 4E+10 3E+10 2E+10 1E+10 0 1
2
3
4
Thread Count
Figure 7: Number of instructions per phase across 4 different parallel executions of sp.A: serial, 2, 3, and 4 threads. amount of executed instructions in each phase. It is therefore to be expected and required for a good definition of phases that a given phase behavior occupies approximately the same number of instructions retired, independently from the thread-count, as the number of threads is varied.
7 Parallel SimPoint We now examine using the phase groupings described in Section 5 for Parallel SimPoint. The goal is to choose a small set of simulation points (on a per thread basis) that when simulated on a deterministic multi-thread simulator [20, 30] provide an accurate representation of the complete parallel run. For Parallel SimPoint, we use the phase clustering algorithm described in Section 5. A simulation point is chosen for each phase, which is the interval for a specific thread with its sampled basic block vector closest to the centroid of the phase. Remember for our approach, phases can represent intervals from different threads after clustering. Each simulation point is assigned a weight equal to the percent of the program’s execution (in terms of intervals) its phase repre-
8 Summary In this paper we focus on discovering phases in parallel applications running on shared memory systems. We start by describing how to recognize similar activities performed by different threads for a program’s execution. The results showed that this can be used with SimPoint to accurately represent the program’s parallel behavior with an average error less than 9
4% for CPI, and L2 and L3 hit rates, as well as significantly reduce the standard deviation of these metrics within a phase. We also showed that we can perform thread-varying phase analysis across different runs of a program as the number of threads used varies from 1 to 4 threads. We found that threadvarying phase analysis can be used to examine the effect on specific parts of the program’s execution as the number of threads are varied. This can be used by researchers to better understand a parallel program’s execution for different number of threads/processors. Finally we showed that using the parallel phase analysis can be used to accurately pick simulation points to guide multi-threaded simulation.
[15] C. Isci and M. Martonosi. Identifying program power phase behavior using power vectors. In Workshop on Workload Characterization, September 2003. [16] C. Isci and M. Martonosi. Runtime power monitoring in high-end processors: Methodology and empirical data. In 36th International Symposium on Microarchitecture, December 2003. [17] J. Lau, J. Sampson, E. Perelman, G. Hamerly, and B. Calder. The strong correlation between code signatures and performance. In Proceedings of the 2005 IEEE International Symposium on Performance Analysis of Systems and Software, March 2005. [18] J. Lau., S. Schoenmackers, and B. Calder. Structures for phase classification. In IEEE International Symposium on Performance Analysis of Systems and Software, March 2004. [19] J. Lau, S. Schoenmackers, and B. Calder. Transition phase classification and prediction. In Proceedings of the International Symposium on High-Performance Computer Architecture, January 2005.
Acknowledgments
[20] K. Lepak, H. Cain, and M. Lipasti. Redeeming ipc as a performance metric for multithreaded programs. In 12th International Conference on Parallel Architectures and Compilation Techniques, 2003.
We would like to thank the anonymous reviewers for providing helpful feedback on this paper. This work was funded in part by NSF grant No. CCF-0342522, NSF grant No. CCF0311710, a UC MICRO grant, and a grant from Intel.
[21] J. MacQueen. Some methods for classification and analysis of multivariate observations. In L. M. LeCam and J. Neyman, editors, Proceedings of the Fifth Berkeley Symposium on Mathematical Statistics and Probability, volume 1, pages 281–297, Berkeley, CA, 1967. University of California Press. [22] M. Merten, A. Trick, R. Barnes, E. Nystrom, C. George, J. Gyllenhaal, and Wen mei W. Hwu. An architectural framework for run-time optimization. IEEE Transactions on Computers, 50(6):567–589, June 2001.
References
[23] http://phase.hpcc.jp/omni/benchmarks/npb/.
[1] M. Annavaram, R. Rakvic, M. Polito, R. Hankins, J.Y. Bouguet, and B. Davies. The fuzzy correlation between code and performance predictability. In 37th International Symposium on Microarchitecture, December 2004. [2] R. Balasubramonian, D. H. Albonesi, A. Buyuktosunoglu, and S. Dwarkadas. Memory hierarchy reconfiguration for energy and performance in general-purpose processor architectures. In 33rd International Symposium on Microarchitecture, pages 245–257, 2000.
[24] H. Patil, R. Cohn, M. Charney, R. Kapoor, A. Sun, and A. Karunanidhi. Pinpointing representative portions of large intel itanium programs with dynamic instrumentation. In MICRO, 2004. [25] D. Pelleg and A. Moore. X-means: Extending K-means with efficient estimation of the number of clusters. In Proceedings of the 17th International Conf. on Machine Learning, pages 727–734. Morgan Kaufmann, San Francisco, CA, 2000.
[3] R. D. Barnes, E. M. Nystrom, M. C. Merten, and W. W. Hwu. Vacuum packing: Extracting hardware-detected program phases for post-link optimization. In 35th International Symposium on Microarchitecture, December 2002.
[26] E. Perelman, G. Hamerly, and B. Calder. Picking statistically valid and early simulation points. In International Conference on Parallel Architectures and Compilation Techniques, September 2003.
[4] M. V. Biesbrouck, T. Sherwood, and B. Calder. A co-phase matrix to guide simultaneous multithreading simulation. In IEEE International Symposium on Performance Analysis of Systems and Software, March 2004.
[27] T. Sherwood, E. Perelman, and B. Calder. Basic block distribution analysis to find periodic behavior and simulation points in applications. In International Conference on Parallel Architectures and Compilation Techniques, September 2001.
[5] Dhruba Chandra, Fei Guo, Seongbeom Kim, and Yan Solihin. Predicting interthread cache contention on a chip multi-processor architecture. In HPCA ’05: Proceedings of the 11th International Symposium on High-Performance Computer Architecture, pages 340–351, Washington, DC, USA, 2005. IEEE Computer Society.
[28] T. Sherwood, E. Perelman, G. Hamerly, and B. Calder. Automatically characterizing large scale program behavior. In Proceedings of the 10th International Conference on Architectural Support for Programming Languages and Operating Systems, October 2002. [29] T. Sherwood, S. Sair, and B. Calder. Phase tracking and prediction. In 30th Annual International Symposium on Computer Architecture, June 2003.
[6] B. Davies, J.Y. Bouguet, M. Polito, and M. Annavaram. ipart: An automated phase detection and recognition tool. Technical report, Intel Research Tech Report IR-TR-2004-1 (http://research.intel.com/ir/tools/presentations/files/IR-TR2004-1-iPART.pdf), 2003.
[30] R. Singhal, K.S. Venkatraman, E. Cohn, J.G. Holm, D.Koufaty, M.J. Lin, M. Madhav, M. Mattwandel, N. Nidhi, J. Pearce, and M. Seshadri. Performance analysis and validation of the intel pentium 4 processor on 90nm technology. Intel Technology Journal, 8(1), February 2004.
[7] P.J. Denning and S. C. Schwartz. Properties of the working-set model. Communications of the ACM, 15(3):191–198, March 1972.
[31] Anand Sivasubramaniam, Aman Singla, Umakishore Ramachandran, and H. Venkateswaran. An approach to scalability study of shared memory parallel systems. SIGMETRICS Perform. Eval. Rev., 22(1):171–180, 1994.
[8] A. Dhodapkar and J. Smith. Comparing program phase detection techniques. In 36th International Symposium on Microarchitecture, December 2003. [9] A. Dhodapkar and J. E. Smith. Dynamic microarchitecture adaptation via codesigned virtual machines. In International Solid State Circuits Conference, February 2002.
[32] Allan Snavely, Laura Carrington, Nicole Wolter, Jesus Labarta, Rosa Badia, and Avi Purkayastha. A framework for performance modeling and prediction. In Supercomputing ’02: Proceedings of the 2002 ACM/IEEE conference on Supercomputing, pages 1–17, Los Alamitos, CA, USA, 2002. IEEE Computer Society Press.
[10] A. Dhodapkar and J. E. Smith. Managing multi-configuration hardware via dynamic working set analysis. In 29th Annual International Symposium on Computer Architecture, May 2002.
[33] http://www.intel.com/research/mrl/pnl/. [34] Dean Tullsen, Susan Eggers, and Henry Levy. Simultaneous multithreading: Maximizing on-chip parallelism. In Proceedings of the 22rd Annual International Symposium on Computer Architecture (ISCA), June 1995.
[11] E. Duesterwald, C. Cascaval, and S. Dwarkadas. Characterizing and predicting program behavior and its variability. In International Conference on Parallel Architectures and Compilation Techniques, October 2003.
[35] http://www.intel.com/software/products/vtune/.
[12] A. Georges, D. Buytaert, L. Eeckhout, and K. De Bosschere. Method-level phase behavior in Java workloads. In Proceedings of the ACM Conference on ObjectOriented Programming Systems, Languages and Applications, 2004. [13] Isabelle Guyon, Jason Weston, Stephen Barnhill, and Vladimir Vapnik. Gene selection for cancer classification using support vector machines. Machine Learning, 36(1-2):389–422, April 2002. [14] M. Hind, V. Rjan, and P. Sweeney. Phase shift detection: A problem classification. Technical report, IBM, August 2003.
10


![ModelSim Tutorial - UCSD CSE [PDF]](https://m.moam.info/img/260x300/modelsim-tutorial-ucsd-cse-pdf_64799306098a9e495b8b45ed.jpg)