Detecting Replay Attacks from Far-Field. Recordings on Speaker Verification Systems. Jesús Villalba and Eduardo Lleida. Communications Technology Group ...
Detecting Replay Attacks from Far-Field Recordings on Speaker Verification Systems Jes´ us Villalba and Eduardo Lleida Communications Technology Group (GTC), Aragon Institute for Engineering Research (I3A), University of Zaragoza, Spain {villalba,lleida}@unizar.es
Abstract. In this paper, we describe a system for detecting spoofing attacks on speaker verification systems. By spoofing we mean an attempt to impersonate a legitimate user. We focus on detecting if the test segment is a far-field microphone recording of the victim. This kind of attack is of critical importance in security applications like access to bank accounts. We present experiments on databases created for this purpose, including land line and GSM telephone channels. We present spoofing detection results with EER between 0% and 9% depending on the condition. We show the degradation on the speaker verification performance in the presence of this kind of attack and how to use the spoofing detection to mitigate that degradation. Keywords: spoofing, speaker verification, replay attack, far-field
1
Introduction
Current state of the art speaker verification systems (SV) have achieved great performance due, mainly, to the appearance of the GMM-UBM [1] and Joint Factor Analysis (JFA) [2] approaches. However, this performance is usually measured in conditions where impostors do not make any effort to disguise their voices to make them similar to any true target speaker and where a true target speaker does not try to modify his voice to hide his identity. That is what happens in NIST evaluations [3]. In this paper, we dealt with a type of attack known as spoofing. Spoofing is the fact of impersonating another person using different techniques like voice transformation or playing of a recording of the victim. There are multiple techniques for voice disguise. In [4] authors do a study of voice disguise methods and classify them into electronic transformation or conversion, imitation, and mechanical and prosodic alteration. In [5] an impostor voice is transformed into the target speaker voice using a voice encoder and decoder. More recently, in [6] an HMM based speech synthesizer with models adapted from the target speaker is used to deceive an SV system. In this work, we focus on detecting a type of spoof known as replay attack. This is a very low technology spoof and the most easily available for any impostor without speech processing knowledge.
2
Jes´ us Villalba and Eduardo Lleida
The far-field recording and replay attack can be applied to text dependent and independent speaker recognition systems. The utterance used in the test is recorded by a far-field microphone and/or replayed on the telephone handset using a loudspeaker. This paper is organized as follows. Section 2 explains the replay attack detection system. Section 3 describes the experiments and results. Finally, in section 4 we show some conclusions.
2 2.1
Far-Field Replay Attack Detection System Features
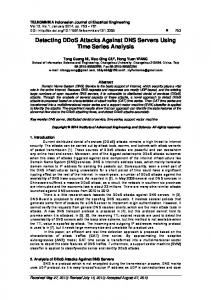
For each recording we extract a set of several features. These features have been selected in order to be able to detect two types of manipulations on the speech signal: – The signal have been acquired using a far-field microphone. – The signal have been replayed using a loudspeaker. Currently, speaker verification systems are mostly used on telephone applications. This means that the user is suppose to be near the telephone handset. If we can detect that the user was far of the handset during the recording we can consider it as an spoofing attempt. A far-field recording will cause an increment of the noise and reverberation levels of the signal. This will have as consequence a flattening of the spectrum and a reduction of the modulation indexes of the signal. The simpliest way of injecting the spoofing recording into a phone-call is using a loudspeaker. Probably, the impostor will use a easily transportable device, with a small loudspeaker, like a smart-phone. This kind of loudspeaker presents bad frequency responses in the low part of the spectrum. Figure 1 shows a typical frequency response of a smart-phone loudspeaker. We can see that the low frequencies are strongly attenuated. Following, we describe each of the features extracted. Spectral Ratio The spectral ratio (SR) is the ratio between the signal energy from 0 to 2 kHz and from 2 kHz and 4 kHz. For a frame n, it is calculated as: N F F T /2−1
SR(n) =
X
f =0
log (|X(f, n)|) cos
�
(2f + 1)π NFFT
�
.
(1)
where X(f, n) is the Fast Fourier Transform of the signal for the frame n. The average value of the spectral ratio for the speech segment is calculated using speech frames only. Using this ratio we can detect the flattening of the spectrum due to noise and reverberation.
Detecting Replay Attacks from Far-Field Recordings on SV Systems
3
10
5
0
dB
−5
−10
−15
−20
−25
0
500
1000
1500
2000 Hz
2500
3000
3500
4000
Fig. 1. Typical frequency response of smartphone loudspeaker.
Low Frequency Ratio We call low frequency (LFR) ratio to the ratio between the signal energy from 100Hz to 300Hz and from 300Hz to 500Hz. For a frame n, it is calculated as: LF R(n) =
300Hz X
log (|X(f, n)|) −
f =100Hz
500Hz X
log (|X(f, n)|) .
(2)
f =300Hz
where X(f, n) is the Fast Fourier Transform of the signal for frame n. The average value of the low frequency ratio for the speech segment is calculated using speech frames only. This ratio is useful for detecting the effect of the loudspeaker on the low part of the spectrum of the replayed signal. Modulation Index The modulation index at time t is calculated as Indx(t) =
vmax (t) − vmin (t) . vmax (t) + vmin (t)
(3)
where v(t) is the envelope of the signal and vmax (t) and vmin (t) are the local maximum and minimum of the envelope in the region close to time t. The envelope is approximated by the absolute value of the signal s(t) down sampled to 60 Hz. The mean modulation index of the signal is calculated as the average of the modulation index of the frames that are above a threshold of 0.75. In Figure 2 we show a block diagram of the algorithm. The envelope of the far-field recording has higher local minimums due, mainly, to the additive noise. Therefore, it will have lower modulation indexes. Sub-band Modulation Index If the noise affects only to a small frequency band it could not have a noticeable effect on the previous modulation index. We
4
Jes´ us Villalba and Eduardo Lleida
s(t)
8kHZ > 200 HZ
Abs
200HZ > 60 HZ
Max/Min Det
Indx(t)
Avg
Indx
Fig. 2. Modulation index calculation.
calculate the modulation index of several sub-bands to be able to detect farfield recordings with coloured noises. The modulation index of each sub-band is calculated filtering the signal with a pass-band filter in the desired band previous to calculating the modulation index. We have chosen to use indexes in the bands: 1kHz-3kHz, 1kHz–2kHz, 2kHz–3kHz, 0.5kHz–1kHz, 1kHz–1.5kHz, 1.5kHz–2kHz, 2kHz–2.5kHz, 2.5kHz–3kHz, 3kHz–3.5kHz.
s(t)
Mod Indx
BP Filter (f1,f2)
Indx(f1,f2)
Fig. 3. Sub-band modulation index calculation.
2.2
Classification algorithm
Using the features described in the previous section we get a feature vector for each recording: x = (SR, LF R, Indx(0, 4kHz), . . . , Indx(3kHz, 3.5kHz)) .
For each input vector x we apply the SVM classification function: X f (x) = αi k(x, xi ) + b .
(4)
(5)
i
where k is the kernel function, and xi , αi and b are the support vectors, the support vector weights, and the bias parameter that are estimated in the SVM training process. The kernel that best suits our task is the Gaussian kernel. � � 2 (6) k(xi , xj ) = exp γ kxi − xj k . For each input vector x we apply an SVM classifier with a Gaussian kernel. We have used the LIBSVM toolkit [7]. For training the SVM parameters we have used data extracted from the training set of the SRE08 NIST database:
– Non spoofs: 1788 telephone signals of NIST SRE08 train set. – Spoofs: synthetic spoofs made using interview signals from NIST SRE08 train set. We pass these signals through a loudspeaker and a telephone channel to simulate the conditions of a real spoof. We have used two different loudspeakers: a USB loudspeaker for a desktop computer and a mobile device loudspeaker; and two different telephone channels: analog and digital. In this way, we have 1475x4 spoof signals.
Detecting Replay Attacks from Far-Field Recordings on SV Systems
3 3.1
5
Experiments Databases Description
Far-Field Database 1 We have used a database consisting of 5 speakers. Each speaker has 4 groups of signals: – Originals: Recorded by a close talk microphone and transmitted by telephone channel. There are 1 train signal and 7 test signals. They are transmitted through different telephone channels: digital (1 train and 3 test signals), analog wired (2 test signals) and analog wireless (2 test signals). – Microphone: Recorded simultaneously with the originals by a far-field microphone. – Analog Spoof: The microphone test signals are used to do a replay attack on a telephone handset and transmitted by an analog channel. – Digital Spoof: The microphone test signals with replay attack and transmitted by a digital channel. Far-Field Database 2 This database has been recorded to do experiments with replay attacks on text dependent speaker recognition systems. In this kind of system, during the test phase, the speaker is asked to utter a given sentence. The spoofing process consists of manufacturing the test utterance by cutting and pasting fragments of speech (words, syllables) recorded previously from the speaker. There are no publicly available databases for this task so we have recorded our own one. The fragments used to create the test segments have been recorded using a far-field microphone so we can use our system to detect spoofing trials. The database consists of three phases: – Phase 1 + Phase 2: it has 20 speakers. It includes landline (T) signals for training, non spoof tests and spoofs tests; and GSM (G) for spoofs tests. – Phase 3: it has 10 speakers. It includes landline and GSM signals for all training and testing sets. Each phase has three sessions: – Session 1: it is used for enrolling the speakers into the system. Each speaker has 3 utterances by channel type of 2 different sentences (F1,F2). Each sentence is about 2 seconds long. – Session 2: it is used for testing non spoofing access trials and has 3 recordings by channel type of each of the F1 and F2 sentences. – Session 3: it is made of different sentences and a long text that contain words from the sentences F1 and F2. It has been recorded by a far-field microphone. From this session several segments are extracted and used to build 6 sentences F1 and F2 that will be used for spoofing trials. After that, the signals are played on a telephone handset with a loudspeaker and transmitted through a landline or GSM channel.
6
3.2
Jes´ us Villalba and Eduardo Lleida
Speaker verification system
We have used an SV system based on JFA [2] to measure the performance degradation. Feature vectors of 20 MFCCs (C0-C19) plus first and second derivatives are extracted. After frame selection, features are short time Gaussianized as in [8]. A gender independent Universal Background Model (UBM) of 2048 Gaussians is trained by EM iterations. Then 300 eigenvoices v and 100 eigenchannels u are trained by EM ML+MD iterations. Speakers are enrolled using MAP estimates of their speaker factors (y,z) so the speaker means super vector is given by Ms = mU BM + vy + dz. Trial scoring is performed using a first order Taylor approximation of the LLR between the target and the UBM models like in [9]. Scores are ZT Normalized and calibrated to log-likelihood ratios by linear logistic regression using the FoCal package [10] and the SRE08 trial lists. We have used telephone data from SRE04, SRE05 and SRE06 for UBM and JFA training, and score normalization. 3.3
Speaker verification performance degradation
Far-Field Database 1 We have used this database to create 35 legitimate target trials, 140 non spoof non target, 35 analog spoofs and 35 digital spoofs. The training signals are 60 seconds long and the test signals 5 seconds approximately. We have got an EER of 0.71% using the non spoofing trials only. In Figure 4 we show the miss and false acceptance probabilities against the decision threshold. In that figure, we can see that, if we would choose the EER operating point as the decision threshold, we would accept 68% of the spoofing trials. Pmiss/Pfa vs Decision Threshold 100 Pmiss Pfa Pfa analog spoof Pfa digital spoof
90
80
Pmiss/Pfa (%)
70
60
50
40
30
20
10
0 −10
−5
0
5 thr=−logPprior
10
15
20
Fig. 4. Pmiss/Pfa vs decision threshold of the far-field database 1.
In Figure 5 we show the score distribution of each trial dataset. There is an important overlap between the target and the spoof dataset. Table 1 presents the
Detecting Replay Attacks from Far-Field Recordings on SV Systems
7
score degradation statistics from a legitimate utterance to the same utterance after the spoofing processing (far-field recording, replay attack). The average degradation is only around 30%. However, it has a big dispersion with some spoofing utterances getting a higher score than the original ones.
Score Distributions Replay Attack 0.16 target 0.14
nontarget analog spoof
0.12
digital spoof
pdf
0.1
0.08
0.06
0.04
0.02
0 −10
−5
0
5 log−likelihood ratio
10
15
20
Fig. 5. Speaker verification score distributions of the far-field database 1.
Table 1. Score degradation due to replay attack of the far-field database 1. Mean Std Median Max Min ∆scr 3.38 2.42 3.47 9.70 -1.26 Analog ∆scr/scr (%) 29.00 19.37 28.22 70.43 -10.38 ∆scr 3.52 2.30 3.37 9.87 -1.68 Digital ∆scr/scr (%) 30.29 18.92 29.52 77.06 -16.74
Far-Field Database 2 We did separate experiments using phase1+2 and phase3 datasets. For phase1+2, we train speaker models using 6 landline utterances, and do 120 legitimate target trials, 2280 non spoof non target, 80 landline spoofs and 80 GSM spoofs. For phase 3, we train speaker models using 12 utterances (6 landline + 6 GSM), and do 120 legitimate target trials (60 landline + 60 GSM), 1080 non spoof non target (540 landline + 540 GSM) and 80 spoofs (40 landline + 40 GSM). Using non spoof trials we have got and EER of 1.66% and EER of 5.74% for phase1+2 and phase3 respectively. In Figure 6 we show the miss and false acceptance probabilities against the decision threshold for phase1+2 database. If we choose the EER threshold we have 5% of landline spoofs passing the speaker
8
Jes´ us Villalba and Eduardo Lleida
verification which is not as bad as in the previous database. None of the GSM spoofs would be accepted.
Pmiss/Pfa vs Decision Threshold 15 Pmiss Pfa Pfa spoof land Pfa spoof gsm
Pmiss/Pfa (%)
10
5
0 1
2
3
4 thr=−logPprior
5
6
7
Fig. 6. Pmiss/Pfa vs decision threshold of far-field database 2 phase 1+2.
Figure 7 shows the score distributions for each of the databases. Table 2 shows the score degradation statistics due to the spoofing processing. The degradation is calculated by speaker and sentence type, that is, we calculate the difference between the average score of the clean sentence F x of a given speaker and the average score of the spoofing sentences F x of the same speaker. As expected, the degradation is worse in this case than in the database with replay attack only. Even for phase 3, the spoofing scores are lower than the non target scores. This means that the processing used for creating the spoofs can modify the channel conditions in a way that makes the spoofing useless. We think that this is also affected by the length of the utterances. It is known that when the utterances are very short, Joint Factor Analysis cannot do proper channel compensation. If the channel component were well estimated the spoofing scores should be higher. 3.4
Far-Field Replay Attack Detection
Far-Field Database 1 In Table 3 we show spoofing detection EER for the different channel types and features. The LFR is the feature that produces better results getting 0% of error in the same channel condition and 7.32% in the mixed channel condition. The spectral ratio and modulation indexes do not achieve very good results separately but combined can be near the results of the LFR. Digital spoofs are more difficult to detect than analog with the SR and modulation indexes. We think that the digital processing mitigate the noise effect on the signal. The LFR is mainly detecting the effect of the loudspeaker. To detect
Detecting Replay Attacks from Far-Field Recordings on SV Systems Score Distributions Cut and Paste Replay Attack
9
Score Distributions Cut and Paste Replay Attack
0.25
0.35 target nontarget spoof landline spoof gsm
target landline target gsm nontarget landline nontarget gsm spoof landline spoof gsm
0.3
0.2 0.25
0.15 pdf
pdf
0.2
0.15 0.1
0.1 0.05 0.05
0 −10
−5
0
5
10
15
log−likelihood ratio
0 −6
−4
−2
0
2
4 6 log−likelihood ratio
8
10
12
14
Fig. 7. Score distributions of far-field database 2 phase1+2 (left) and phase3 (right). Table 2. Score degradation due to replay attack of the far-field database 2.
T Phase1+2 G T Phase3 G
∆scr ∆scr/scr ∆scr ∆scr/scr ∆scr ∆scr/scr ∆scr ∆scr/scr
(%) (%) (%) (%)
Mean 8.29 90.53 9.98 111.94 10.21 123.06 10.21 121.63
Std Median Max Min 3.87 7.96 17.89 1.41 31.64 90.72 144.88 27.46 2.96 9.56 18.517535 5.40 18.03 109.437717 159.69 80.41 2.51 9.76 17.78 6.86 18.47 117.54 180.38 95.60 3.32 10.19 18.36 4.65 19.50 119.39 167.15 92.67
spoofs where the impostor uses another mean to inject the speech signal into the telephone line we keep the rest of features. Using all the features, we achieve similar performance than using the LFR only. Figure 8 shows the DET curve for the mixed channel condition using all the features. Far-Field Database 2 In Table 4 we show EER for both databases for the different channel combinations. The nomenclature used for defining each condition is: NonSpoofTestChannel SpoofTestChannel. Phase1+2 database has higher error rates which could mean that they have been recorded in a way that produces less channel mismatch. That is also consistent with the speaker verification performance, the database with less channel mismatch has higher spoof acceptance. The type of telephone channel has little effect on the results. Figure 9 shows the spoofing detection DET curves. 3.5
Fusion of Speaker Verification and Spoofing Detection
Finally we are going to fuse the spoofing detection and speaker verification systems. The fused system should keep similar performance for legitimate trials to
Jes´ us Villalba and Eduardo Lleida Table 3. Spoofing detection EER for the far-field database 1. Channel
Features EER(%) SR 20.00 Analog Orig. LFR 0.00 vs. MI 30.7 Analog Spoof Sb-MI 10.71 (SR,MI,Sb-MI) 0.00 (SR,LFR,MI,Sb-MI) 0.00 SR 36.07 Digital Orig. LFR 0.00 vs. MI 30.7 Digital Spoof Sb-MI 14.64 (SR,MI,Sb-MI) 10.71 (SR,LFR,MI,Sb-MI) 0.00 SR 37.32 Analog+Dig Orig. LFR 7.32 vs. MI 31.9 Analog+Dig Spoof Sb-MI 12.36 (SR,MI,Sb-MI) 8.03 (SR,LFR,MI,Sb-MI) 8.03
FF Mixed Channel 40
20
Miss probability (in %)
10
10
5
2 1 0.5 0.2 0.1 0.1
0.2
0.5
1
2 5 10 False Alarm probability (in %)
20
40
Fig. 8. DET spoofing detection curve for the far-field database 1. Table 4. Spoofing detection EER for the far-field database 2.
TT Phase1+2 T G T TG TT Phase3 GG TG TG
EER(%) 9.38 2.71 5.62 0.00 1.67 1.46
T−T T−G T−TG
20 10 5 2 1 0.5
0.5 1 2 5 10 20 False Alarm probability (in %)
Miss probability (in %)
Miss probability (in %)
Detecting Replay Attacks from Far-Field Recordings on SV Systems
20
11
T−T G−G TG−TG
10 5 2 1 0.5
0.5 1 2 5 10 20 False Alarm probability (in %)
Fig. 9. DET spoofing detection curves for the far-field database 2 phase1+2 (left) and phase 3 (right).
the original speaker verification system but reduce the number of spoofing trials that deceive the system. We have done a hard fusion in which we reject the trials that are marked as spoof by the spoofing detection system; the rest of trials keep the score given by the speaker verification system. In order to not increase the number of misses of target trials, which would annoy the legitimate users of the system, we have selected a high decision threshold for the spoofing detection system. We present results on the far-field database 1 because it has the higher spoofing acceptance rate. Figure 10 shows the miss and false acceptance probabilities against the decision threshold for the fused system. If we again consider the EER operating point we can see that the number of accepted spoofs has decreased from 68% to zero for landlines and 17% for GSM.
4
Conclusions
We have presented a system able to detect replay attacks on speaker verification systems when the recordings of the victim have been obtained using a far-field microphone and replayed on a telephone handset with a loudspeaker. We have seen that the procedure to carry out this kind of attack changes the spectrum and modulation indexes of the signal in a way that can be modeled by discriminative approaches. We have found that we can use synthetic spoofs to train the SVM model and yet, we can get good results on real spoofs. This method can significantly reduce the number of false acceptances when impostors try to deceive an SV system. This is especially important for persuading users and companies to accept using SV for security applications.
References 1. Douglas A. Reynolds, Thomas F. Quatieri, and Robert B. Dunn. Speaker Verification Using Adapted Gaussian Mixture Models. Digital Signal Processing, 10(1-
12
Jes´ us Villalba and Eduardo Lleida Pmiss/Pfa vs Decision Threshold 100 Pmiss Pfa Pfa analog spoof Pfa digital spoof
90
80
Pmiss/Pfa (%)
70
60
50
40
30
20
10
0 −10
−5
0
5 thr=−logPprior
10
15
20
Fig. 10. Pmiss/Pfa vs. decision threshold for a speaker verification system with spoofing detection.
3):19–41, January 2000. 2. Patrick Kenny, Pierre Ouellet, Najim Dehak, Vishwa Gupta, and Pierre Dumouchel. A Study of Interspeaker Variability in Speaker Verification. IEEE Transactions on Audio, Speech, and Language Processing, 16(5):980–988, July 2008. 3. http://www.itl.nist.gov/iad/mig/tests/sre/2010/NIST SRE10 evalplan.r6.pdf. 4. Patrick Perrot, Guido Aversano, and G´erard Chollet. Voice disguise and automatic detection:review and perspectives. Lecture Notes In Computer Science, pages 101– 117, 2007. 5. P. Perrot, G. Aversano, R. Blouet, M. Charbit, and G. Chollet. Voice Forgery Using ALISP: Indexation in a Client Memory. In Proceedings. (ICASSP ’05). IEEE International Conference on Acoustics, Speech, and Signal Processing, 2005., pages 17–20. IEEE. 6. Phillip L. De Leon, Michael Pucher, and Junichi Yamagishi. Evaluation of the vulnerability of speaker verification to synthetic speech. In Proceedings of Odyssey 2010 - The Speaker and Language Recognition Workshop, Brno, Czech Republic, 2010. 7. Chih-Chung Chang and Chih-Jen Lin. LIBSVM: a library for support vector machines, 2001. 8. Jason Pelecanos and Sridha Sridharan. Feature warping for robust speaker verification. In Oddyssey Speaker and Language Recognition Workshop, Crete, Greece, 2001. 9. Ondrej Glembek, Lukas Burget, Najim Dehak, Niko Brummer, and Patrick Kenny. Comparison of scoring methods used in speaker recognition with Joint Factor Analysis. In ICASSP ’09: Proceedings of the 2009 IEEE International Conference on Acoustics, Speech and Signal Processing, pages 4057–4060, Washington, DC, USA, 2009. IEEE Computer Society. 10. Niko Brummer. http://sites.google.com/site/nikobrummer/focalbilinear.