Detecting Tip Spam in Location-based Social Networks Helen Costa
Fabricio Benevenuto
Luiz H. C. Merschmann
UFOP Ouro Preto, Brazil
UFMG / UFOP Ouro Preto, Brazil
UFOP Ouro Preto, Brazil
[email protected] [email protected] ABSTRACT Location Based Social Networks (LBSNs) are attracting new users in exponential rates. LBSNs like Foursquare and Gowalla allow users to share their geographic location with friends, search for interesting places as well as posting tips about existing locations. By allowing users to comment on locations, LBSNs increasingly have to deal with a new wave of spammers, which aim at advertising unsolicited messages on tips and comments about locations. In this paper, we investigated the task of identifying tip spam on a popular Brazilian LBSN system, namely Apontador. Based on a labeled collection of tips provided by Apontador as well as crawled information about users and locations, we identified a number of attributes able to distinguish spam from non-spam tips. We leveraged our characterization study towards a spam detection mechanism. Using a classification technique, we were able to correctly identify 84% of spam tips and 91.8% of non-spam tips. Our results also highlight the importance that places and related user activity have for detecting tip spam on LBSNs.
Categories and Subject Descriptors J.4 [Computer Applications]: Social and behavioral sciences; H.3.5 [ Information Storage and Retrieval]: Online Information Services
General Terms Human factors, Measurement
Keywords location-based social networks, social networks, tip spam, tip analysis
1.
INTRODUCTION
Location Based Social Networks (LBSNs) are new Web 2.0 systems that are attracting new users in exponential rates.
Permission to make digital or hard copies of all or part of this work for personal or classroom use is granted without fee provided that copies are not made or distributed for profit or commercial advantage and that copies bear this notice and the full citation on the first page. To copy otherwise, to republish, to post on servers or to redistribute to lists, requires prior specific permission and/or a fee. SAC’13 March 18-22, 2013, Coimbra, Portugal. Copyright 2003 ACM 978-1-4503-1656-9/13/03 ...$10.00.
[email protected]
LBSNs like Foursquare and Gowalla allow users to share their geographic location with friends through smartphones equipped with GPS, search for interesting places as well as posting tips about existing locations. It has been reported that, nowadays, nearly one in five smartphone owners access this kind of service via their mobile devices [2]. In Brazil, a popular LBSN system is namely Apontador1 , and it includes the main features of systems like Foursquare and Gowalla. It allows users to search for places, register new locations and check-in in locations using smartphones. Additionally, Apontador contains one of the most interesting features of LBSNs, which is allowing users to post tips to existing places. Due to these tips, with a smartphone and access to a LBSN, a user might not only find nearby places to visit, but also read suggestions about what to order, what to buy or even what to avoid on specific places. Thus, tips in LBSN work as crowdsourcing recommendations about specific locations. Although appealing as a mechanism to enrich the user experience on the system, this feature opens opportunities for users to disseminate unsolicited messages. LBSNs increasingly have to deal with a wave of spammers, which aim at advertising unsolicited messages instead of true tips about locations. Spammers in these systems are driven by several goals, such as spread advertise to generate sales, disseminate pornography, or simply compromise system reputation. Spam may jeopardize the trust of users on the existing tips available in the system, thus compromising its success in promoting location-based social interactions. Furthermore, spam in tips may compromise user patience and satisfaction with the system since users need to filter out spam from what worth reading. In spite of that, the available literature is limited in providing a deep understanding of this problem. In this paper, we address the issue of detecting tip spam in LBSNs adopting a 3-step approach. First, we obtained tips about places labeled as spam or non-spam by Apontador’s moderators and we further crawled information from users and places that appear on this labeled dataset. Second, we analyzed a number of attributes extracted from the tips’ content and from the user behavior on the system aiming at understanding their relative discriminative power to distinguish between spam and non-spam tips. Lastly, we investigated the feasibility of applying a supervised machine learning method to identify tip spam. Our approach was able to correctly identify a significant part of the tips as spam or non-spam. The rest of the paper is organized as follows. Next section 1
www.apontador.com.br
presents related efforts. Section 3 describes our crawling strategy and how the labeled collection was created. Section 4 investigates a number of attributes and their ability to distinguish between spam and non-spam tips. Section 5 describes and evaluates our strategy to detect tip spam and Section 6 offers conclusions and directions for future work.
2.
RELATED WORK
Spam detection has been observed in various social network systems, including YouTube [7], Twitter [6, 11], Facebook [10], and MySpace [14]. Particularly, Benevenuto et al. [6] approached the problem of detecting spammers on Twitter. By using a labeled collection of users manually classified, they applied a classification machine learning approach to differentiate spammer users from legitimate ones. Similarly, Lee et al. [14] created social honeypots to identify a set of spammers on MySpace and Twitter. In addition to showing that social honeypots are accurate in identifying spammers, they propose a machine learning method to detect spammers in these two systems. Although these methods inspired the approach we used in these efforts, our work is complementary to them as we investigate spam in a different environment, identifying the specific features that allow us to accurately identify tip spam. In the context of reviews about products, Jindal and Liu [13] investigated the detection of opinion spam on product reviews, based on the analysis of reviews from amazon.com. Opinions spam are untruthful opinions that deliberately mislead readers by giving undeserving positive reviews to some target objects in order to promote the objects and/or by giving unjust or malicious negative reviews in order to damage the objects’ reputation. Thus, they proposed a model to detect harmful opinions, based on duplicate reviews (copies), which inspired a few metrics proposed in our work. There are many other efforts that attempt to characterize and understand the use of LBSNs. Particularly, Scellato et al. [16] analyzed the social, geographic and geo-social properties of social networks that provide location information about their users. They showed that LBSNs are characterized by short-distance spatial-clustered friendships, while in the other types of networks, such as Twitter and LiveJournal, users have heterogeneous connection lengths. An analysis of three LBSNs (i.e., Foursquare, Gowalla, and Brightkite) identified the main properties of the graphs that connect users of these systems [17]. In [15], the authors analyzed the user check-in dynamics and the presence of spatio-temporal patterns in Foursquare. Complementarily, recent work modeled and identified patterns of the evolution of LBSNs [4]. Finally, in a recent effort, Vasconcelos et al. [18] crawled Foursquare to characterize the user behavior based on information of tips, dones and toDos. Using an expectation maximization clustering algorithm, they classified users into four groups, out of which one contained tip spammers. Thus, they presented the first evidence of spam on LBSNs. However, to the best of our knowledge, the main characteristics of tip spammers as well as an investigation of methods for countering tip spam have not been explored in the literature.
3.
DATASET AND DEFINITIONS
Before presenting the datasets used in this work, we first introduce the definition of tip spam. Although spam presents
different aspects on different environments, it is defined in most of its forms as unsolicited electronic messages, especially advertising, sent indiscriminately to users [12]. In LBSNs, spam mostly occurs in the form of tips that aim at spreading advertises. Examples of tip spam are: (i) an advertisement of a local service or website selling local products, and (ii) pornographic advertisement posted as tips to places that are popular among teenagers. We built our dataset based on data obtained from Apontador, a Brazilian LBSN that contains more than seven million registered places and services. It consists of two sets of data, one containing tips labeled as spam and non-spam and the other consists of data we crawled in order to enhance the features used to differentiate spam from non-spam tips. Next, we describe both datasets.
3.1
Labeled dataset
We obtained from Apontador a dataset containing tips about places manually labeled as spam or non-spam by Apontador’s moderators2 . They manually inspected the tips posted from 15th to 22th September 2011 and identified 1,260 tips classified as spam. Aiming at using a balanced dataset (with the same number of instances for both classes), Apontador also provided 1,260 tips classified as non-spam. As this manual classification relies on human judgment to decide whether a tip is spam or not, we decided to investigate if there is agreement with the labeling performed by Apontador’s moderators. We asked volunteers from our research group to manually verify 100 randomly selected spam tips and classify them as spam or non-spam. Volunteers classified 2 tips as non-spam and 98 as spam. From the spam tips, 65 were considered to be local advertises, 29 pollution (i.e., unrelated or irrelevant text), and 4 were considered to be aggressive comments about the places. Despite the 2 tips considered as non-spam, we noted a high level of agreement with the labeled performed by Apontador, which reflects a high level of confidence of this human classification. Thus, we considered for our study the labeled dataset obtained from Apontador without any further modification on it. In summary, our labeled dataset contains 2,520 labeled tips equally divided as spam and non-spam. These tips were posted by 1,984 unique users to 2,216 different places. In addition to be labeled as spam or non-spam, each tip obtained contains the following information: the tip content, timestamp, click counter in the link “This tip helped me”, click counter in the link “Report abuse”, the tip ID, the user ID, and the place ID.
3.2
Crawling Apontador
The labeled tips obtained from Apontador contain the unique ID of places, which allow us to gather further information about places from the Apontador API3 . Each place entry on the Apontador API contains the following information: unique ID, name, description, counter click, number of tips, number of recommendations, category (e.g., restaurant, hotel, or hospital), address, phone, latitude, longitude, and information about the user who made the place registration on the system (i.e., the place owner). We developed a python crawler to gather this information for each place 2 We plan to make our labeled collection available to the research community on http://www.dcc.ufmg.br/~fabricio 3 http://api.apontador.com.br/
that appeared in the tips from the labeled dataset, which corresponds to 2,216 places. In addition to places, we developed a second crawler that gathered information about the user’s social network (list of followers and followees) as well as all the tips posted by them. By gathering the list of followers and followees of a user, new users were discovered and also gathered. We executed this process recursively until all discovered users were gathered, which corresponds to an entire weakly connected component of the Apontador graph. From the 1,984 users that appeared in the labeled dataset we discovered and crawled a social network graph containing 137,464 users. For each crawled user we gathered the following information: user name, number of places registered, number of tips posted, and number of photos posted.
4.
IDENTIFYING ATTRIBUTES
Unlike ordinary users of LBSNs, people who spam aim at commercial intent (e.g., advertising), self-promotion, and belittlement of ideas and reputation [12]. Thus, not only the characteristics of the tip content might be helpful in identifying tip spam, but also the behavior and actions of spammers in the system. This section aims at identifying characteristics of users and tips that underscore the differences between the two classes of tips. We analyzed a set of attributes that reflect user behavior in the system, characteristics of the tip content as well as aspects of the places targeted by the studied tips. We considered four attribute sets, namely, content attributes, user attributes, place attributes, and social attributes, discussed next. Content attributes are properties of the text of tips posted by users. The following attributes were investigated for each tip of our labeled collection: number of words, number of numeric characters (i.e., 1,2,3) that appear on the text, number of spam words or expressions from a popular list of spam words [1] and a set of SpamAsassin rules in Portuguese [3] that contains regular expressions for common spam sentences that appear on the corpus of emails, number of capital letters, number of words with all letters in capital, number of URLs, number of email addresses, number of phone numbers, and number of contact information on the text (which is the sum of number of email addresses and number of phone numbers). We also measured the Jaccard coefficient [5], defined as follows. Let A and B be the sets of words of two tips from the same user. The Jaccard coefficient, J(A, B), between A and B is given by the number of words in common in A and B divided by the total number of words in the union of both sets: J(A, B) = |A ∩ B|/|A ∪ B|. A Jaccard coefficient J equal to 0 means that the two tips have no word in common, whereas J close to 1 indicates that both tips share most of the words. Finally, we also considered two other attributes that are related to tip content, but not directly with the text. These attributes are the number of clicks on the link “This tip helped me” and the number of clicks on the link “Report abuse”. The second set of attributes consists of specific properties of user behavior in the system. We considered the following user attributes: number of places registered by the user, number of tips posted by the user, number of photos posted by the user, and the distance among all places reviewed by the user. To compute this last attribute, we measured the distance between each pair of places reviewed by the user,
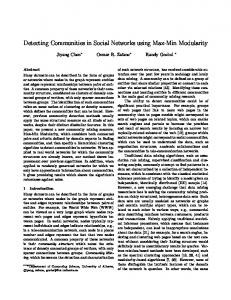
considering only those users who reviewed more than one different place. Otherwise, the value of this attribute is zero. Then, we computed the distance between each pair of places using the information of longitude and latitude of them. The third set of attributes is related to the place where the tip was posted. We selected 5 place attributes: number of clicks on the place page, number of tips on the place, place rating (a 5-point rating scale with 1 being the worst and 5 being the best), number of clicks on the link “Thumbs up” of the place, and number of clicks on the link “Thumbs down” of the place. Finally, the fourth set of attributes captures the relationships established among users via the social network. The idea is that these attributes might capture specific interaction patterns that could help differentiating users who post non-spam tips from those who post spam. We selected the following attributes extracted from the social network, which capture the level of (social) interaction of the corresponding user: clustering coefficient, betweenness, reciprocity, assortativity, in-degree, out-degree, degree, fraction of followers (in-degree) per followees (out-degree), and Pagerank. The clustering coefficient of a node i, cc(i), is the ratio of the number of existing edges over the number of all possible edges between i’s neighbors. It measures the density of communication, not only between two users but among neighbors of neighbors. Another interesting metric to observe is the reciprocity of each user. The reciprocity (R) of , where Out(x) is a user is given by R(x) = |Out(x)∩In(x)| |Out(x)| the set of users that user x follows (followees) and In(x) is the set of users that follows user x (followers). Reciprocity measures the probability of a user being followed by each user that he/she follows. Node assortativity is defined as the ratio between the node (in/out) degree and the average (in/out) degree of its neighbors. We compute node assortativity for the four types of degree-degree correlations (i.e., in-in, in-out, out-in, out-out). We also use the Pagerank [9] algorithm on the social graph. Basically, a user has a high rank if he/she has many incoming links or the user has links coming from highly ranked users. The scores computed by the Pagerank algorithm could be used as indicators of the importance of users in terms of their participation in the LBSN. We assessed the relative power of the 41 selected attributes in discriminating one class from the other by independently applying two well known feature selection methods, namely, information gain and χ2 (Chi Squared) [20]. Table 1 summarizes the results, showing the rank of attributes from each set (content, user, place and social) according to the ranking produced by χ2 . Results for information gain are very similar and, thus, are omitted. Note that the 10 most discriminative attributes are distributed among the four categories, which shows the importance of having investigated each one of them. The two most discriminative attributes (according to both methods) are related to the place, being the number of tips on the place (i.e., place popularity) the most discriminative attribute. Figure 1(a) presents the cumulative distribution of this attribute for each class, showing that about 60% of the spam tips were posted to places that have up to 100 tips, whereas approximately 67% of non-spam tips were posted to places that have up to 10 tips. Thus, places with more tips are likely to have a higher fraction of tip spam. The most discriminative attribute related to the content
non−spam spam 0
101
102
103
104
100 90 80 70 60 50 40 30 20 10 0
Cumulative %
Cumulative %
Cumulative %
100 90 80 70 60 50 40 30 20 10 0
non−spam spam 0
Number of tips of the place
101
102
103
104
105
100 90 80 70 60 50 40 30 20 10 0
106
spam non−spam 101
0
Number of numeric characters in the tip
(a) Tips of the place
102
103
104
105
106
Number of photos of the user
(b) Numeric characters in the tip
(c) Photos of the user
Figure 1: Cumulative distribution of attributes of the tips is the number of contact information. Actually, other three attributes related with contact information are in the top 10 attributes: number of numeric characters, number of phone numbers, and number of email addresses. Figure 1(b) shows that the attribute number of numeric characters has potential to differentiate the two tip classes, in which about 60% of all non-spam tips have up to 16 numeric characters on the text, whereas 60% of spam tips have up to 250 numeric characters on the text. In fact, spam tips might tend to have more numerical characters on their texts as some spammers tend to advertise local services, sharing phone numbers. With respect to the set of attributes related to the user who posted the tip, the more discriminative is the maximum distance among all places reviewed by the user. It is interesting that this feature has a good predictive power as it can be computed only in the context of LBSNs. Additionally, the attribute “number of photos posted by the user” is also among the top 15. Figure 1(c) shows that approximately 67% of the spam tips belong to users who posted up to 10 photos, whereas 51% of non-spam tips belong to users who posted up to 100 photos. This indicates that legitimate users interact more with system tools than spammer.
5.
DETECTING TIP SPAM
In this section, we investigate the feasibility of applying a supervised learning algorithm along with the attributes discussed in the previous section for the task of detecting tip spam on Apontador. In this approach, each tip is represented by a vector of values, one for each attribute. The algorithm learns a classification model from a set of previously labeled (i.e., pre-classified) data, and then applies the acquired knowledge to classify new (unseen) tips into two classes: spam and non-spam. Note that, in this paper, we have a labeled collection provided by Apontador. In a practical scenario, labeled data may be obtained through various initiatives (e.g., volunteers who help marking spam, professionals hired to periodically manually classify a sample of tips, etc). Our goal here is to assess the potential effectiveness of the proposed approach as a first effort towards detecting tip spam on LBSNs. We continue by presenting the metrics used to evaluate our experimental results in Section 5.1. Next, Section 5.2 describes the classification algorithm, i.e., the classifier, and the experimental setup used. The experimental results are presented in Sections 5.3 and 5.4.
5.1
Evaluation Metrics
To assess the effectiveness of our classification strategy, we adopted metrics commonly used in Machine Learning and Information Retrieval [5]. To explain these metrics in the context of our problem, we will use the following confusion matrix:
True Label
Non-spam Spam
Predicted Label Non-spam Spam a b c d
where a indicates the number of non-spam tips that were correctly classified, b indicates the number of non-spam tips that were wrongly classified as spam, c indicates the number of spam tips that were wrongly classified as non-spam, and d indicates the number of spam tips that were correctly classified. The following metrics were considered in our evaluation: accuracy, true positive rate (or recall), true negative rate and F-measure. The accuracy is the percentage of both spam and non-spam tips that are correctly classified by the classifier. The true positive rate of the class spam d (T Pspam = c+d ) expresses the ability of the classifier to identify spam tips. The true negative rate of the class spam a (T Nspam = a+b ) is the fraction of non-spam tips that are correctly predicted as non-spam. The F-measure metric is a standard way of summarizing precision (P ) and recall (R), ×R and is defined as F = 2 × P , where P is the precision P +R d P = b+d . The F-measure metric reaches its best value at 1 (indicating a perfect prediction) and worst at 0.
5.2
Classifier and Experimental Setup
We used the Random Forest classifier [8], which is a stateof-the-art method in classification. Random Forest grows many decision trees (forest) that are used to classify new objects. Each decision tree is built from a random subset of the training dataset (bootstrap sample). In addition, a random subset of the available attributes is used to split each tree node. To classify a new object, it is pushed down each of the trees in the forest. Each decision tree votes for the result, and the Random Forest chooses the classification having the most votes (over all the trees in the forest). The experiments were carried out using the algorithm RandomForest implemented in the Weka tool [19]. Aiming at finding the best classifier parameters, a grid search parameter optimization algorithm was applied on parameters numFeatures (used in random selection of attributes)
Table 1: Ranking of attributes Category Content 16 attributes
User 8 attributes
Place 5 attributes
Social 12 attributes
χ2 ranking 12 38 7 35 4 11 37 26 6 5 3 39,33,41,40,36 24 16 14 17,15,9,28,10 31 1 2 29 22 13 18 32 8 21 19 25 30,34,27,23 20
description Clicks on the link “ This tip helped me” Clicks on the link “ Report abuse” Number of words Number of words in capital Number of numeric characters Number of capital letters Number of spam words and spam rules Number of URLs on the text Number of email addresses on the text Number of phone numbers on the text Number of contact information on the text Similarity score (avg, median, max, min, sd) Number of places registered by the user Number of tips posted by the user Number of photos posted by the user Distance among all places reviewed by the user (avg, median, max, min, sd) Number of clicks on the place page Number of tips on the place Place rating Clicks on the link “Thumbs up” Clicks on the link “Thumbs down” Clustering coefficient Fraction of followers per followees Number of followees (out-degree) Number of followers (in-degree) Degree Reciprocity Betweenness Assortativity (in-in, in-out, out-in, out-out) Pagerank
and numTrees (number of trees to be generated) of the classifier. As result, the parameter values numF eatures = 10 and numT rees = 195 were adopted in our experiments. The predictive performance was measured using a 5-fold cross-validation method. In each test, the original dataset is partitioned into 5 exclusive sets, out of which four are used as training data, and the remaining one is used for testing the classifier. The process is then repeated 5 times, with each of the 5 sets used exactly once as the test data, thus producing 5 results. The entire 5-fold cross validation was repeated 10 times with different seeds used to shuffle the original dataset, thus producing 50 different results for each test. So, the results reported in Section 5.3 are averages of the 50 runs. With 95% of confidence, these results do not differ from the average in more than 1%.
5.3
Classification Results
Table 2 shows the experimental results obtained using all attributes listed in Table 1. We observe that Random Forests obtained 0.840 for true positive rate, meaning that 84% of the spam tips were correctly classified as spam and could be correctly removed from the system. For the nonspam tips, 91.8% were classified correctly. Therefore, only a small fraction of non-spam tips (less than 9%) were misclassified as spams. As a summary of the classification result, the accuracy shows that our approach classified correctly 87.8% of all tips.
5.4
Impact of Reducing the Attribute Set
In Section 4 we evaluated the relative power of the attributes considered in our dataset in discriminating between spam and non-spam tips. However, as important as to understand the relevance of these attributes, is to assess
Table 2: Classification Results Metric TP TN F-measure Accuracy
Value 0.840 0.918 0.873 0.878
Confidence Interval ± 0.009 ± 0.005 ± 0.005 ± 0.004
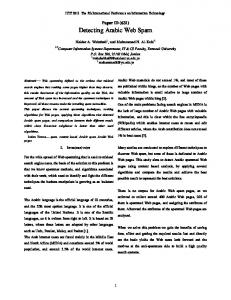
whether competitive classification performance can be with fewer attributes and different sets of attributes. This type of analysis is important for the following reasons. First, since it is expected that the spammers will evolve and adapt their strategies to fool anti-spam systems, in the course of time, some attributes may become less important while others may gain importance. Second, given the huge dimensions of the datasets related to social network applications, reaching accurate classification results from reduced datasets is desirable to speed up the classification process and to improve the model interpretability. In order to evaluate the classifier performance considering different subsets of attributes, we conducted experiments using subsets of 10 attributes that occupy contiguous positions in the ranking (i.e., the first top 10 attributes, the next 10 attributes and so on) presented in Table 1. Figure 2 shows the accuracy value for all attributes, for different subsets of attributes, and for a baseline classifier that considers all tips as non-spam. As can be observed in Figure 2, our classification provides gains over the baseline for all subsets of attributes evaluated, i.e., even low ranked attributes have some discriminatory power. In addition, significant improvements over the baseline can be reached even if only part of the group of attributes considered in our experiments can be obtained.
100
[5]
90
Accuracy Accuracy baseline
80
Metric (%)
70
[6]
60 50 40
[7]
30 20 10 0 All
1−10
11−20
21−30
31−41
Subset of Features from x² Ranking
[8] [9]
Figure 2: Results with subsets of attributes
6.
CONCLUSION AND FUTURE WORK
In this paper we approached the problem of detecting spam tips on Apontador. We crawled the Apontador site to obtain information of places, users and the social graph of more than 137,000 users with their links of follower and followees. Based on the labeled collection of tips provided by Apontador added to the collected places and users information, we did a characterization of the tips of this labeled collection, bringing to the light several attributes useful to differentiate spam from non-spam tips. We leveraged our characterization study towards a spam detection mechanism. Using a classification technique, we were able to correctly identify a significant fraction of the spam and also non-spam tips. In addition, our experimental results show that even with a small subset of attributes (containing 10 attributes), our classification approach was able to reach high accuracy (82.6%). We envision three directions towards which our work can evolve. First, we intend to explore other refinements to the proposed approach such as the use of other classification methods. Second, we consider to extend our proposed approach to other kinds of social networks that suffer the same kind of spam attack. Finally, we aim at investigating other kinds of attacks on LBSNs.
7.
[11]
[12]
[13]
[14]
[15]
[16]
ACKNOWLEDGEMENTS
This research was supported in part by CAPES, CNPq, and Fapemig. The authors would like to thank Apontador for data provided, which made this research possible. We also thank Fabricio Barth for his valuable suggestions.
8.
[10]
REFERENCES
[1] List of spam words. http://codex.wordpress.org/Spam_Words. [2] Nearly 1 in 5 smartphone owners access check-in services via their mobile device. http://bit.ly/mgaCIG. [3] Spamasassin rules to portuguese. https://github.com/ppadron/spamassassin-pt-br. [4] M. Allamanis, S. Scellato, and C. Mascolo. Evolution of a location-based online social network: Analysis
[17]
[18]
[19]
[20]
and models. In ACM Int’l Conference on Internet Measurement (IMC), 2010. R. Baeza-Yates and B. Ribeiro-Neto. Modern Information Retrieval. ACM Press / Addison-Wesley, 1999. F. Benevenuto, G. Magno, T. Rodrigues, and V. Almeida. Detecting spammers on twitter. In 7th Annual Collaboration, Electronic messaging, Anti-Abuse and Spam Conference (CEAS), 2010. F. Benevenuto, T. Rodrigues, V. Almeida, J. Almeida, and M. Gon¸calves. Detecting spammers and content promoters in online video social networks. In Int’l ACM Conference on Research and Development in Information Retrieval (SIGIR), pages 620–627, 2009. L. Breiman. Random forests. Machine Learning, 45(1):5–32, 2001. S. Brin and L. Page. The anatomy of a large-scale hypertextual web search engine. Computer Networks and ISDN Systems, 30(1-7):107–117, 1998. H. Gao, J. Hu, C. Wilson, Z. Li, Y. Chen, and B. Y. Zhao. Detecting and characterizing social spam campaigns. In ACM Int’l Conference on Internet Measurement (IMC), 2010. S. Ghosh, B. Viswanath, F. Kooti, N. K. Sharma, K. Gautam, F. Benevenuto, N. Ganguly, and K. Gummadi. Understanding and Combating Link Farming in the Twitter Social Network. In Int’l World Wide Web Conference (WWW’12), 2012. P. Heymann, G. Koutrika, and H. Garcia-Molina. Fighting spam on social web sites: A survey of approaches and future challenges. IEEE Internet Computing, 11:36–45, 2007. N. Jindal and B. Liu. Opinion spam and analysis. In ACM International Conference of Web Search and Data Mining (WSDM), 2008. K. Lee, J. Caverlee, and S. Webb. Uncovering social spammers: social honeypots + machine learning. In ACM Int’l Conference on Research and Development in Information Retrieval (SIGIR), 2010. A. Noulas, S. Scellato, C. Mascolo, and M. Pontil. An empirical study of geographic user activity patterns in foursquare. In Int’l AAAI Conference on Weblogs and Social Media (ICWSM), 2011. S. Scellato, C. Mascolo, M. Musolesi, and V. Latora. Distance matters: geo-social metrics for online social networks. In ACM SIGCOMM Workshop on Online social networks (WOSN), 2010. S. Scellato, A. Noulas, R. Lambiotte, and C. Mascolo. Socio-spatial properties of online location-based social networks. In Int’l AAAI Conference on Weblogs and Social Media (ICWSM), 2011. M. Vasconcelos, S. Ricci, J. Almeida, F. Benevenuto, and V. Almeida. Tips, dones and to-dos: Uncovering user profiles in foursquare. In ACM Int’l Conference of Web Search and Data Mining (WSDM), 2012. I. Witten and E. Frank. Data Mining: Practical machine learning tools and techniques. Morgan Kaufmann, 2005. Y. Yang and J. Pedersen. A comparative study on feature selection in text categorization. In Conference on Machine Learning (ICML), 1997.


![Detecting Events in Online Social Networks - Ioannis Katakis [PDF]](https://m.moam.info/img/260x300/detecting-events-in-online-social-networks-ioannis_648990b8098a9ec0118b4642.jpg)