Rudloff, Schönauer, Fellendorf
1 2 3 4 5 6 7 8 9 10 11 12 13 14 15 16 17 18 19 20 21 22 23 24 25 26 27 28 29 30 31 32 33
-1-
Comparing a calibrated shared space simulation model to real life data
Christian Rudloff (Corresponding Author) Dynamic Transportation Systems Austrian Institute of Technology Giefinggasse 2 A-1210 Vienna, Austria Phone: +43 (0) 50550-6439
[email protected] Robert Schönauer mobimera Fairkehrstechnologien Taborstrasse 11b/19 A-1020 Vienna, Austria Phone: +43 (0) 650 8415746
[email protected] Martin Fellendorf TU Graz, Institute for Highway Engineering and Transport Planning Rechbauerstraße 12/II A-8010 Graz Phone: +43 (0)316 873-6221
[email protected]
Submitted: August 1, 2012 Word Count: 5452 Table: 2 Figures: 6 Total no. words: 7452
Rudloff, Schönauer, Fellendorf
1 2 3 4 5 6 7 8 9 10 11 12 13
-2-
ABSTRACT Shared spaces are being implemented in many countries to deal with safety concerns and traffic flow problems on busy urban streets and street crossings. However, shared space concepts could not be tested before being build so far due to the lack of a functioning microscopic shared space simulation. Lane based car following models, currently used in traffic simulation cannot reproduce the high heterogeneity of mixed traffic mode’s non-channelized flow. Our novel approach introduces an extended social force model for vehicles and pedestrians, incorporating social interactions between different modes of transport rather than following a purely rule based approach. The calibration of such a microscopic traffic simulation model using real world data from two shared space sites is presented in this paper. Furthermore, it is shown that the simulation can reproduce real life shared space behavior by comparing it to trajectory and interaction data collected at an implemented shared space project.
Rudloff, Schönauer, Fellendorf
1 2 3 4 5 6 7 8 9 10 11 12 13 14 15 16 17 18 19 20 21 22 23 24 25 26 27 28 29 30 31 32 33 34 35 36 37 38 39 40 41 42 43 44 45 46
-3-
INTRODUCTION In many cities shared spaces were introduced or are being planned as a concept to solve problems in busy urban environments that pose a danger to vulnerable road users like pedestrians and cyclists. The idea is to design spaces without clearly dedicating road areas for each of the modes of transportation and without road signs guiding traffic behavior. This will make everyone more aware of their surroundings and heighten the attention to the traffic environment (see e.g. (1), (2) and (3)). First empirical studies have been performed, comparing shared spaces to conventional road setups. In (4), changes in give-way behavior at intersections were studied at two conventional and two shared space sites with similar dimensions and traffic quantities. It turned out that at the refurbished intersections cars were more likely to yield to pedestrians. Dong (5) applies a traffic risk analysis tool to data gained at London’s Shared Space in Exhibition Road. His work shows a slight decrease in both the frequency and severity of traffic conflict after the conversion to a Shared Space. The overall risk value decreases by 20%. Other studies (i.e. (6)) done in shared spaces, implemented several years back show that the number of accidents after the redesign does not increase. In (7) data from a refurbished shared space environment were compared with data collected at the classical roundabout that existed before refurbishment. It was discovered that the distribution of speeds got narrower in the shared space for all traffic modes and decreased with time. There is no indication of lower maximum speeds after the redesign at the observed traffic density. Furthermore, the technical normative dominates social behavior only above a certain speed. Literature (i.e. (8)) defines this critical speed to 30 km/h. Next to speed limits, also perception, communication and other psychological phenomena influence velocity. There are also some studies on modeling the interaction between individuals using different modes. In most parts the interaction is handled with rule based approaches like crosswalks (9) where cars give way to pedestrians within a certain area close to the crosswalk. In a shared space setting Kaparias et al. (10) include social interaction by fitting a discrete choice model on the willingness of drivers to share space with pedestrians according to different input factors. While there are tools being developed to make existing shared spaces saver (4), good planning tools are necessary to help convince the public as well as local authorities that well designed shared space areas are advantageous for travelers in all modes. First steps into that direction were taken in (12) where the modeling concept incorporates the possibility of simulating shared space with PTV VISSIM. It uses a combination of an infrastructure model, an operational social force model (SFM), car and bicycle models as well as a tactical conflict resolving game to model the behavior of different road users in a shared space environment. A similar combination of a SFM together with an infrastructure model and a car model as well as issues on steering and drivers vision are reviewed in (11). However, both these papers only describe preliminary results rather than a fully calibrated model that can reproduce real behavior in a shared space environment in a simulation. As a follow up to (12), in this paper a considerably larger amount of real world data were used to calibrate the models described in the previous paper. The paper is organized in the following way. First we present a reminder of the models implemented in the simulation program. In particular, the infrastructure model as well as the model resolving conflicts is presented in a slightly adjusted version. Second the model calibration including the data used for calibration and some calibration results are shown. Thirdly, for the first time, a fully functional shared space simulation model is implemented and tested against real world data collected at the second shared space site. The paper finishes with conclusions and an outlook to future work.
Rudloff, Schönauer, Fellendorf
-4-
1 2 3 4 5 6 7 8 9 10 11 12
THE SHARED SPACE SIMULATION MODEL The basic modeling idea of the shared space simulation is based on a social force model (SFM). As far as possible the agents are moved according to the SFM paradigm. However, as vehicle behavior cannot completely be explained with that approach, there are underlying vehicle and driver models for cars and bicycles. Furthermore, the basic routing is done by adding an infrastructure model that uses guiding fields to keep all road users on reasonable trajectories towards their goals. Lastly, in contrast to pure pedestrian models, just using the SFM for different modes of transport leads to unresolved conflicts for modes with higher velocities. For that purpose we introduce a tactical model based on a game theoretic approach. In this paper we concentrate on the calibration of the infrastructure model and the tactical game. These parts of the model are described again in the following sections. For details on the other model components see (12) or (13), (14).
13 14 15 16 17 18 19 20 21 22
Operational and Infrastructure Model In (15) a generalized force model for microscopic vehicular traffic flow models is proposed. They show that car-following can be described by introducing an acceleration force. While in (15) a change in the accelerating force is proposed. To handle the more complex situation of mixed traffic compared to lane based car following behavior, we go a slightly different way of a game theoretic conflict solving approach described in more detail below. Hence, the operational base model used in the shared space simulation is the simple social force model implemented in PTV VISSIM for pedestrians. While re-calibration of this model might further improve the simulation results, for this paper the parameters given in the VISSIM simulation program were taken. For an agent α the force that accelerates the agent is given as α
αβ
α
α
β α
23
where
24 25 26 27 28 29 30 31 32 33 34 35 36
their goal, αβ is the force accelerating α away from agent β and α is the force accelerating the agent away from the infrastructure element . The exact formulation of these forces is described in (12). To deal with the higher speeds of cars and bicycles compared to pedestrians the model uses three second ahead forecasts of the agents positions to calculate the forces αβ and α . In addition the direction of the agent is influenced by a force field that is generated for each agent. This force field enables the agents to react to local features of the road design on their way towards their goal. The infrastructural space is divided in straight road sections and joining sections. For that generation of the guiding field each agent gets assigned a random value drawn from a distribution that determines the lateral position of their path along straight sections of road. In turns connecting two straight sections the two guiding paths are interpolated and the turning angled smoothened. This guiding attracts the agents by adding a force α that steers the agent towards their assigned path again.
37 38 39
Tactical Model Due to the high speeds compared to pedestrian simulation certain conflicts between agents cannot be solved purely by the SFM approach. Hence a tactical game is proposed to resolve the
α
is the force accelerating the agent towards their intended velocity in direction of
Rudloff, Schönauer, Fellendorf
1 2 3 4 5 6 7 8 9 10 11 12 13 14
-5-
remaining conflicts. Game theory has previously been applied on road traffic interaction in an urban context in (16), where gap acceptance behavior on highways was modeled. Also Kita (17) formulated a game for car conflicts. We extend this game to handle multi-modal conflicts. The presented conflict solving approach is based on a rational game play. A non symmetric hierarchical game with leader and follower players is used. The leader who holds the powerful position announces her strategy. Followers react to the leader's announced strategy. The available strategies are continue (without reaction), brake (or stop), avoid on left side, avoid on right side. For each strategy pair both players obtain a certain utility - the game matrix. The game solving is based on random utility maximization. It is assumed that both players have full information about the deterministic part of the utility of the other player. As a result the leader knows the expected outcome of any of their actions and decides on their strategy by maximizing that expected utility. The follower reacts to the leader by choosing the strategy that offers the highest utility available. The leader decision is triggered by maximizing the random expected utility defined as ε
ε
15 16 17
where is the utility of the leader if she chooses strategy and as a reaction the follower chooses strategy j, is the conditional probability that the follower chooses j conditional on the leader choosing and ε is the unexplained, random part of the utility of the leader.
18 19
The utility of the follower when choosing is given as │ as the utility of the decision for conditional of the leader choosing . Again there is a random part ε contained in
20
the utility. To guarantee the applicability of the Logit model, the random parts of the utilities ε
21
and ε are assumed to be distributes according to an extreme value distribution. Accordingly
22
the conditional probability
can be calculated as │
23
│ Similarly, the probability of the leader choosing is given as
24 25 26 27 28 29 30 31 32 33 34 35
The strategies of the leader and follower are then drawn using the probabilities above. The utilities are given as a weighted sum of the following components: 1. , velocity dependent disutility calculated as the collision probability coming from speed differences of the leader and follower. The disutility is calculated as ), where is the relative speed after following the strategy pair . The cell value is when the agents are moving away from each other ( ). 2. , distance related disutility, calculated as, length of the spatial relative vector of collision probability disutility coming from distance, utility calculated as ), where is the closest distance between the agents after following the strategy pair . 3. social utility for agents given as when the decision is supported by social convention and otherwise, i.e. for a car it is socially preferable to let the
Rudloff, Schönauer, Fellendorf
-6-
1 2 3 4 5 6 7 8 9 10 11 12 13 14 15 16 17 18
pedestrian cross the street. At the strategies left, right the geometry of the agents is included into the calculation. If the position and direction of movement allows a dodging maneuver behind the other agent (less disturbing) the equivalent is set to . The social utility is included as ). 4. , energy loss disutility (zero-strategy = 0) of the agents given as the negative absolute value of the velocity change. This component is equivalent to the square root of the kinetic energy loss . 5. , normative utility according to traffic regulations (give way etc.). Within this component the pedestrians crossing the road always gain 0 except the vehicles having to stop to let them cross. If the strategies left or right allow a crossing of the road without disturbing vehicular traffic the corresponding is set to . The normative utility is considered as: ). For agents at decision the utilities are and similarly for The components above are calculated by simulating the decisions using the SFM. Values like the speeds are then calculated from the resulting trajectories. The estimation methodology for the calibration of the weights in the weighted sum and the data used for calibration are described in the following section.
19 20 21
CALIBRATION The models defined in the last chapter need to be calibrated using real data to be able to reproduce real life behavior of all modes.
22 23 24 25 26 27 28 29 30 31 32 33 34 35
Calibration Data Data for the calibration process were collected at two shared space sites in Austria. The first one is a through road in Gleinstätten, Austria. The second one is a redesigned urban roundabout in Graz, Austria. In both cases video data were recorded for several hours on a weekday. The videos were visually analyzed to find relevant scenes. In the Gleinstätten data two kinds of scenarios were collected. The first were scenes with only one vehicle present for the calibration of the force field. The second were scenes with conflicts, i.e. scenes where two vehicles would come closer than a certain distance within a three second interval if they were to continue with their current speeds. At the Graz site only conflict data were collected. The latter data were used for the calibration of the tactical game. In all of the 61 conflict samples the (hypothetical) closest distance was obtained, the mean found to be 1.7m - the 90% quartile at 3.95. Accordingly the distance threshold was set to 4 m - below this value the simulation requires a conflict solving procedure. For the relevant scenes, trajectory data were collected by semi-manual annotation (18).
36 37 38 39 40 41
Calibration of the Force Field To determine the force field for a vehicle the position of the guiding line is drawn from a beta distribution. The calibration process for this distribution works as follows: For each of 10 vehicles unobstructed by other traffic, the best possible guiding line is found by minimizing the mean distance between the real trajectory and the trajectory estimated in the simulation model.
Rudloff, Schönauer, Fellendorf
1 2 3 4 5
-7-
The vehicles and pedestrians were simulated using the VISSIM SFM and the best guiding line was found by minimizing the square distance between real and simulated trajectory using the MATLAB function fmincon. Finally a beta distribution was fitted to the empirical distribution of fitted guiding lines. The two shape parameters were fitted as and .
6 7 8 9 10 11 12
Calibration of the tactical game The way the game is designed the well known theory from the area of discrete choice models can be used. As the two random parts of the utilities and are independent the probability of the pair being chosen by the leader and the follower is given by . Given the chosen strategies in the collected data, a log-likelihood approach can be used to estimate the parameter values in the following way.
13
where
14 15 16 17 18 19 20 21 22 23 24 25
The parameters are estimated by minimizing the negative log-likelihood above using numerical optimization in MATLAB. The calibration data were collected at two sites. Due to the difficult process of finding relevant video scenes and the labor intensive manual annotation of the scenes only a relatively small amount of data are available. Before the data are combined for the final estimation of the game it has to be tested if the data are actually from one population. A Wald test is applied to estimated models from both sites. Due to the small amount of data the test gives only an indication as not all the parameters are significant. However the Wald test returns a value of 7.967 (p-value 0.151) showing that the null hypothesis of the two models being from the same data cannot be rejected. As a result, the data are combined and the parameters were estimated. The estimated parameters are given in TABLE 1.
26 27 28 29 30
if is chosen by
and 0 otherwise. For estimation purposes the logarithm is taken
TABLE 1: Parameter values for the utility models and standard deviation for the parameters.
Parameter Value (standard deviation) 1.3538 (0.6598 ) (velocity) 1.1458 (0.3730) (space) 2.0249 (0.5787) (social) 1.1258 (0.5679) (normative) 1.9803 (0.4612) (energy consaving) One can see that all parameters are significant. This is especially interesting as it reaffirms that the social component is important in the decision of the conflict solving strategy that is chosen in a shared space environment.
Rudloff, Schönauer, Fellendorf
1 2 3 4 5 6 7 8 9 10 11 12 13
-8-
Who is the leader? In an explorative manner the best method of defining the leader and the follower in a game is estimated.In the tested approaches, the leader is represented by the agent that, A1: is faster, A2: has the right-of-way according to the traffic regulations, A3: is closer to the conflict point - in terms of time, A4-A6: is the "lighter" agent- if both modes are the same, one of the criteria defined above is applied. The comparison was done, by looking at the log likelihoods of the different model parameters. While the log likelihood results (TABLE 2) show that the first three selection processes produce models of very similar fit, we chose the one with the best fit. Hence in the simulation the leader is the player that is closer to the conflict point at the time of the decision. TABLE 2 Log likelihood values for the different leader selection models.
Leader selection method A1: Time to conflict point A2: Higher speed A3: Right of way A4: Type then time to conflict A5: Type then speed A6: Type then right of way (right before left)
Log-Likelihood 115.26 115.83 115.50 117.11 117.72 116.64
14 15 16 17 18 19 20 21
Application of the model on a real world conflict To further explain the model's characteristics it is applied to a real world scenario with varying parameters. In Figure 1(a) the interaction between a pedestrian and a cyclist is shown. While the pedestrian continues on his desired path the bike turns left to avoid the person. To demonstrate the model's reaction on varying the geometrical constellation of the interaction pair the arrival time of the bike at the point of conflict is shifted 1 second back and forth. The results in Figure 1(b) and 1(c) show where represents the bike and the pedestrian.
22 23
(a)
\
Rudloff, Schönauer, Fellendorf
-9-
P j, Pedestrian, in conflict number 51
P i, Bike in conflict number 51 L
L
L
L
L
L
L
F
F
F
F
F
F
F
F
F
F
F
F
F
F
1
1
0.8
0.8 cont stop left right
0.6
0.4
0.2
0.2
-0.8
-0.6
-0.4
-0.2
0
0.2
0.4
0.6
Shift in arrival time of agent i (bike)
0.8
F
F
F
F
F
L
L
L
L
L
L
L
L
L
L
L
1
0
L
L
cont stop left right
0.6
0.4
0
F
-0.8
-0.6
-0.4
-0.2
0
0.2
0.4
0.6
0.8
1
1 2 3 4 5 6
FIGURE 1: (a) Conflict and its real and "no reaction" trajectories at the Shared Space Sonnenfelsplatz (2012). (b) and (c) Probabilities for choosing specific strategies at varying arrival time of the cyclist at the point of conflict, leadership alternates. LEFT: for the bike. RIGHT: of the pedestrian. F...Follower, L...Leader.
7 8 9 10 11 12
When the cyclists arrives earlier at the point of the hypothetic conflict she or he is the leader in the conflict and gains more utility in turning on right side while the pedestrians’ strategy with highest utility provides the path on the right and to pass behind the bike. When the leader choice shifts to the pedestrian (indicated with L and F in FIGURE 2 she or he is able to obtain a higher utility by simply continuing on the path while the cyclists clearly makes a left turn.
13 14 15 16
SIMULATION To finish the analysis of the shared space simulation tool it is applied to realistic setting at the Sonnenfelsplatz in Graz. The results are then compared to real world data looking at speeds and space distribution data.
17 18 19 20 21 22 23 24 25 26
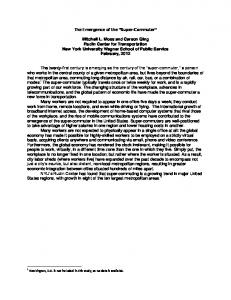
Data acquisition Data has been collected at the Sonnenfelsplatz in Graz before and after the reconstruction to a Shared Space. In 2009 a classical traffic survey was conducted (18) counting the vehicular flow and the number of pedestrian crossings. It shows a pedestrians crossing count of up to 3400/h, traffic volumes of up to 1500 cars/h (evening peak hour) and a cycle rate of 12%. For this paper the movement trajectories of pedestrians and vehicles have been generated by tracking the objects in video footage and transforming the trajectories to world coordinates. Semi-automated tracking is used to obtain the data (18). FIGURE 3 shows a screenshot of the data annotation process in the video frames. Road users are classified into pedestrians, bicycles and cars and origin / destination is determined.
27 28 29 30 31 32
Infrastructure Setup The road at Sonnenfelsplatz is a combination of 5 straight entrance sections, 5 turning spaces and 5 short sections describing a circle like structure in the square. The guiding field is therefore defined as a round shape surrounding the design object in the square's center. Vehicles and pedestrians are free to move across the central element. The roads physical boundaries are given by road furniture, the curbs at the bus station and the designated road surface design
(b)
Shift in arrival time of agent i (bike)
(c)
Rudloff, Schönauer, Fellendorf
1 2
3 4 5 6 7 8 9 10 11 12 13 14
- 10 -
characteristics. The agents in the simulation are not physically hindered to move through objects or surface design elements. However, the force field tends to keep them at a distance.
FIGURE 2: Rendered frame of the simulation. LEFT: Screenshot of the annotation process. RIGHT: Frame of the simulation video output.
Using VISSIMS capabilities of 3D rendering of objects, the output can be written to video files. The frame in FIGURE 3 shows a scene of the simulation analyzed in this paper. Demand Setup In the following sections the data samples are analyzed and differences are discussed. While a large amount of data are the basis for any meaningful analysis, the high extraction effort of about 8 minutes for one trajectory limits the underlying amount of observed traffic participants. Comparable weekdays and daytimes were chosen for the data samples. FIGURE 4 shows the distribution of extracted trajectories and the traffic demand in the simulation for a given time span. Number of simulated agents in the network in 2012
Number of tracked agents in the observation area in 2012
40
40 pedestrians bicycles cars all modes
35
30 quantity of agents [-]
quantity of agents [-]
30 25 20 15
25 20 15
10
10
5
5
0
0 0
100
200
300 t[s]
400
500
pedestrians bicycles cars all modes
35
600
0
100
200
300 t[s]
400
500
600
15 16 17
FIGURE 3: Number of simultaneously tracked road users in the observation area. LEFT: Real Traffic Demand 2012. RIGHT: Simulation Result.
18 19 20
In the simulation 51 pedestrians, 44 bikes and 35 cars are generated based on the observed origin destination matrix. The demand input at the origins stops after 400 seconds and the simulation fades out similarly to the real world trajectories.
21
Rudloff, Schönauer, Fellendorf
1 2 3 4
- 11 -
Qualitative simulation results The willingness to share the available road space between traffic modes is a major aim of the Shared Space concept. This section qualitatively shows the spatial distribution change of the 30 chosen paths for each traffic mode. 30 20
20 10
10 0
5 6 7 8 9 10 11 12 13 14 15 16 17 18 19 20 21 22 23 24
0
-10
-10
-20
-20
-30 -30
-20
-10
0
10
-30 -30 30
20
-20
-10
0
10
20
30
FIGURE 4: Trajectories of pedestrians and vehicles. LEFT: Shared Space in March 2012. RIGHT: Simulated Trajectories.
After the reconstruction, several changes in the walking behavior could be observed. Many pedestrians (red) cross the place using shorter paths closer to the square center (FIGURE 5, left hand side). A higher variation in the crossing locations can also be observed. In particular some crossings close to the center of the place were observed. In the new design a slightly elevated island forms the center of the square, causing a white spot in the trajectories (FIGURE 5, left hand side) in the bikes (green) and cars (black) trajectories. While the trajectories in the simulation run are in similar areas to those in the real world (FIGURE 5, right hand side) they show higher channeling effects through the square. The central element is not avoided by all agents since it is not modeled as obstacle or with higher friction. The pedestrian crossing trajectories are less curved than the real world trajectories and show higher curvature radii. The reasons lie in the path finding of the agents: The segmentation automatically leads to an orientation system similar to way points which can generate corners in the trajectories after reaching such a point. Comparing speeds Looking at FIGURE 6 (left hand side) the pedestrian's speed distribution is very narrow both in the simulation and in the real world data, since the probability that a pedestrian "brakes" or stops is marginal. Speed Distribution of 49 Bicycles (Shared Space 2012) mean = 3.80
Speed Distribution of 53 Pedestrians (Shared Space 2012) mean = 1.25
Speed Distribution of 51 Cars (Shared Space 2012) mean = 4.06
1600
1800
5000
1400
1600 1200
4000
1400 1000 N [-]
N [-]
N [-]
1200 3000
1000 800
800 600
2000
600 400
400
1000
200
200 0
25
0
0.5
1
1.5
2
2.5 3 speed [m/s]
3.5
4
4.5
5
0
0
1
2
3
4
5 6 speed [m/s]
7
8
9
10
11
0
0
1
2
3
4
5 6 speed [m/s]
7
8
9
10
11
Rudloff, Schönauer, Fellendorf
1
- 12 -
Emp. data (2012): Pedestrian. (mean: 1.25 m/s) b: (mean: m/s) SpeedBicycles Distribution of 44 Bicycles (Shared 3.80 Space 2012) Speed Distribution ofa: 51 Pedestrians (Shared Space 2012) 4
c: Cars (mean: m/s) Speed Distribution of 35 4.06 Cars (Shared Space 2012)
mean = 4.58
mean = 1.36
x 10
mean = 4.17
7000
2
3000
6000 1.5
2500
5000 N [-]
N [-]
N [-]
2000
4000
1500
1
3000 1000
2000 0.5 500
1000
0
1
1.5
2
2.5 3 speed [m/s]
3.5
4
4.5
5
0
0
1
2
3
4
5 6 speed [m/s]
7
8
9
10
11
0
1
e: Bicycles (mean: 4.58 m/s)
2
3
4
5 6 speed [m/s]
7
8
9
10
11
f: Cars (mean: 4.17 m/s)
FIGURE 5: Speed histograms of the Shared Space (first row) and the data, gained in the simulation.
One reason for the high mean cycling speed is that the bicycle speed in the simulation is constrained to a minimum of 4.2 m/s since the characteristics of the bikes stability transforms at this speed and would require a different vehicle controller. Eigenvalue analysis shows that the transition speeds in which the cycle changes from capsize mode to weaving mode is 4.2 m/s (20). The dynamic vehicle model for the cars is a linear single track model with continuous stability. For Cars and Pedestrians, mean speeds are close, but standard deviations are smaller in the simulation. In the simulation deceleration mostly happens when there is an obstruction by another agent, keeping the speeds closer to their starting values. Furthermore, slowing to a standstill is often not necessary to avoid conflicts in the simulation, so agents do not decelerate as far. A spatial speed distribution is considered to further look into the differences. Driving and walking speeds are major traffic performance and safety indicators. To show the spatial distribution the speeds for the three traffic modes are calculated and discretized using a cell grid with cell size of 1m x 1m. Finally for each cell the mean speeds for the three modes were Mapped computed and low pass filtered. The is shown speed dsitribution of pedestrians. Mappedresult speed dsitribution of bikes.in FIGURE 7. Mapped speed dsitribution of car. 0
0
10
10
10
20
20
20
30
30
30
x
0
40
40
40
50
50
50
60
19 20
0.5
Simulation: d: Ped. (mean: 1.36 m/s)
x
5 6 7 8 9 10 11 12 13 14 15 16 17 18
0 0
x
2 3 4
0
0.5
10
20
30 y
1
Empirical Data (2012):
40
1.5
50
60
60
2
a: Pedestrians
60
0
10
1
2
20
3
30 y
4
40
5
b: Bicycles
50
6
7
60
0
10
8
1
2
20
3
30 y
4
40
5
50
6
c: Cars
7
60
8
Rudloff, Schönauer, Fellendorf
- 13 -
Mapped speed dsitribution of bikes.
10
x
30
0
10
10
20
20
30
30
40
40
40
50
50
50
60
1 2 3 4
x
20
Mapped speed distribution of car.
0
x
Mapped speed dsitribution of pedestrians. 0
60 0
0.5
10
20
1
30 y
40
50
60
0
10
2
1
2
1.5
Simulation output data: d: Pedestrians
20
3
30 y
4
40
5
e: Bicycles
50
6
7
60
8
60
0
10
1
2
20
3
30 y
4
40
5
50
6
7
60
8
f: Cars
FIGURE 6: Modal map of estimated speeds, based on cell grid speeds, all speeds in m/s. TOP: Shared Space 2012. BOTTOM: Simulation.
5 6 7 8 9 10 11 12 13 14 15 16
The empirical trajectories show that the pedestrians in the shared space design are moving on a more homogeneous speed level. Especially the crossing of the roads is done at a slower and steadier speed. Looking at the car speeds in the very center of the square a reduction can be observed which does not happen for the entrance speeds. Car speeds stay high at the two straight east entrances to the square. In parts of the square’s center, bicycle speeds clearly dominate the speeds of motorized vehicles which is also observed in the simulation. Considering the simulated trajectories the pedestrian's higher speeds are within the areas where pedestrian directly cross the square. The pedestrians choose more direct paths than in the empirical set - the squares centre is more often used for crossing the road in the simulation. The reasons lie in the path finding of the agents. In the simulation as in real world cars show a higher speed when leaving the square. This tendency is based on braking for the turning maneuvers and for interactions.
17 18 19 20 21 22 23 24 25 26 27 28 29 30 31 32 33 34
CONCLUSIONS AND OUTLOOK In this paper the calibration and tests of a shared space simulation model using real data were described. Such a model offers civil engineers the chance to evaluate their design of a new shared space project before implementation. Applying an indicator introduced in (21), based on relative speed and distances between vehicles calculated from the simulated trajectories, it is possible to find hot spots for conflicts in the simulation. The calibration of the tactical game theoretic conflict handling confirms the assumption that in a shared space purely normative behavior does not dominate the variety of behavior that can be found in shared spaces during conflicts. Socially acceptable behavior is an important part of the utility that the players maximize during the described game. Furthermore it can be seen that it is not necessarily the faster vehicle or the one having right of way that decides on the strategy as the leader. The modeling results are somewhat inconclusive to which vehicle is the leader but there is a slight preference for agent closer to the conflict point as the leader. For the guiding field a simple approach was used. This is quite restricting for the path finding especially for pedestrians. Nevertheless, space usage is quite realistic already. It can also be seen that the simulation performs in a comparable way to the behavior observed in the real world data despite the complex setting of the Graz shared space that includes a relatively large square. In particular, it can be seen that both in real life and simulation, all three
Rudloff, Schönauer, Fellendorf
- 14 -
1 2 3 4 5 6 7 8 9 10 11 12 13 14 15 16 17 18 19 20 21 22 23 24 25
modes have a larger space usage compared with data from the time before refurbishment. In addition, for pedestrian and cars, the speed profiles for real and simulated data are both having comparable means. The standard deviations are smaller for the simulation, which might be due to missing rules to slow agents down when approaching areas they know to be points of possible conflicts like road crossings and intersections the effect that in the simulation it is often enough to slow down to avoid a conflict whereas in real life the agents actually go as far as a complete standstill. However, it can be seen, that cars in the simulation decelerate quite strongly to avoid conflict situations. The bicycle model does not support low speeds well yet, so the speed distribution for bikes are not similar. However, bikes tend to avoid conflicts less by breaking and more by riding around an obstacle, hence is not unrealistic that there are no very low speeds. From the estimated speed maps, it can be seen that in real data and simulation pedestrians cut across the square much more than on the roundabout. In both cases, speeds are higher during the crossing process than while the pedestrians are at the edge of the road. This is not the case for cars which, both in real life and simulation have areas in the square where they decelerate to give right of way to other agents. In future work the remaining problems with the implementation will be dealt with. This includes in particular a more realistic bicycle model and vehicle control. A re-calibration of the basic SFM should also be tackled to further improve the results of the simulation. Furthermore, the differences in speed distributions need to be explored to find a solution. Currently public transport is not handled in the simulation and needs to be included. A better combination of the guiding field with a tactical routing will improve the routes chosen by pedestrian. It also needs to be seen if the models are transferable to different shared space settings. In particular it would be interesting to see if it is enough to adjust desired speeds or even behavioral parameters to transfer the model to a shared space in a different country.
26 27 28 29 30 31 32 33
ACKNOWLEDGEMENTS The authors thankfully acknowledge Helmut Schrom-Feiertag, Martin Stubenschrott, Dietmar Bauer and Weinan Huang for their continuous valuable contribution and. The work for this paper is part of the project MixME, supported by the Austrian Ministry for traffic, innovation and technology (BMVIT) within the national funding framework IV2Splus under the contract 825227. Further, the authors thankfully acknowledge all project partners of MixME: Institute for Highway Engineering and Transport Planning at the TU Graz, Rosinak & Partner ZT GmbH, SLR engineering OG for the fruitful cooperation within this project.
Rudloff, Schönauer, Fellendorf
1 2 3 4 5 6 7 8 9 10 11 12 13 14 15 16 17 18 19 20 21 22 23 24 25 26 27 28 29 30 31 32 33 34 35 36 37 38 39 40 41 42 43 44 45
- 15 -
REFERENCES (1) Gerlach, J., D. Boenke, J. Leven, and R. Methorst. Sinn und Unsinn von Shared Space Zur Versachlichung einer populären Gestaltungsphilosophie. Straßenverkehrstechnik, vol. 2, 2008, pp. 61-65. (2) Hamilton-Baillie, B. Shared Space: Reconciling People, Places and Traffic. Built Environment, vol. 34, 2007, pp. 161-181. (3) Reid, M., Kocak, M., and Hunt, L., „DfT Shared Space Project Stage 1 : Appraisal of Shared Space“, MVA Consultancy, 2009. (4) Bliek, D., „Impacts of Shared Space Design on Pedestrian and Motorist Behaviour“, presented at the Institute of Transportation Engineers Annual Meeting, Vancouver, 2010. (5) Dong, W., „Traffic Conflict And Shared Space: A Before- And After- Case Study On Exhibition Road“, in Proceedings of the 1st Civil and Environmental Engineering Student Conference, Imperial College London, 2012. (6) Ortlepp, J., „Erfahrungen mit "Shared Space" und "Gemeinschaftsstraßen" in Deutschland“, Gesamtverband der Deutschen Versicherungswirtschaft e.V., 2011. (7) Schönauer, R., Stubenschrott, M., Schrom-Feiertag, H., and Menšik, K., „Social and spatial behavior in Shared Spaces“, in Proceedings of the 17th International Conference on Urban Planning and Regional Development in the Information Society 2012, Schwechat, 2012. (8) Topp H., „Denkmalschutz und Altstadt für Alle - Barrierefreie Strassen und Plätze“, Straßenverkehrstechnik, Bd. 54, Nr. 10, S. 647–651, 2010. (9) Boenisch, C.and Kretz, T., „Simulation of Pedestrians Crossing a Street“, in Proceedings of the Eighth International Conference on Traffic and Granular Flow, Shanghai, 2009. (10) Kaparias, I., Bell, M., Chan, C., Biagioli, T. and Kennedy, J., „Investigating The Willingness of Drivers to Share Space With Pedestrians“, presented at the 90th Transportation Research Board Annual Meeting, Washington DC, 2011. (11) Anvari, B., Daamen, W., Knopp, V. L., Hoogendoorn, S. P., and Bell, M. G. H., „Shared Space Modeling Based on Social Forces and Distance Potential Field“, presented at the 6th International Conference on Pedestrian and Evacuation Dynamics, 2012. (12) Schönauer, R., Stubenschrott, M., Huang, W., Rudloff, C., und Fellendorf, M., „Modeling concepts for mixed traffic: Steps towards a microscopic simulation tool for shared space zones“, Transportation Research Record: Journal of the Transportation Research Board (accepted), 2012. (13) Huang, W., R. Schönauer and M. Fellendorf. Social Force based Vehicle Model for 2dimensional Spaces. Proceedings of the 91th Transportation Research Board Annual Meeting, 2011. (14) Huang, W. and Fellendorf, M., „Social Force-Based Vehicle Model for Traffic Simulation“, Proceedings of the 1st European Symposium on Quantitative Methods in Transportation Systems, Lausanne, 2012. (15) Helbing, D., and Tilch, B., Generalized force model of traffic dynamics. Physical Review E, 58(1), 1998, pp. 133–138. (16) Li, Z.L., and Chen, D. A stackelberg game approach to ramp metering and variable speed control, Proceedings of Intelligent Transportation Systems, 2003, pp. 1060-1063. (17) Kita, H. A merging-giveway interaction model of cars in a merging section: a game theoretic analysis. Transportation Research Part A: Policy and Practice, vol. 33, Apr. 1999, pp. 305-312.
Rudloff, Schönauer, Fellendorf
1 2 3 4 5 6 7 8 9 10 11 12
- 16 -
(18) Schönauer, R., Lipetski, Y. and Schrom-Feiertag, H., „Vehicle tracking data for calibrating microscopic traffic simulation models“, Proceedings of SPIE/IS&T Electronic Imaging, Bd. 8301, Nr. 1, S. 83010F–83010F–9, Jan. 2012. (19) Koop. Sonnenfelsplatz, „Sonnenfelsplatz. Innovative civic participation at the first shared space project in Graz“. 2009. (20) Meijaard, J. P., Papadopoulos, J. M., Ruina, A. and Schwab, A. L., „Linearized dynamics equations for the balance and steer of a bicycle: a benchmark and review“, Proc. R. Soc. A, Bd. 463, Nr. 2084, S. 1955–1982, Aug. 2007. (21) Schönauer, R., Stubenschrott, M., Schrom-Feiertag, H., & Menšik, K. (2012). Social and spatial behavior in Shared Spaces. Proceedings of the 17th International Conference on Urban Planning and Regional Development in the Information Society, Schwechat, 2012,