similarity to the helicase and replicase genes of Pineapple mealybug-wilt ...... nearby large-scale markets eg: Azores and Canary Islands near Europe; Florida ...
DETECTION AND ELIMINATION OF MEALYBUG WILT-ASSOCIATED VIRUSES IN PINEAPPLE
A thesis submitted for the Degree of Master of Philosophy
by
Christine M. Horlock (B.Sc. Honours, The University of Queensland)
Department of Microbiology and Parasitology, The University of Queensland, St Lucia.
February 2003
DECLARATION OF ORIGINALITY
I declare that, except as acknowledged in the text, the work presented in this thesis is entirely my own work and has not been submitted, either in part or in whole, for a degree at this or any other university.
Christine Horlock (B.Sc., Honours) February 2003
ii
ACKNOWLEDGEMENTS I wish to thank Dr John Thomas (Queensland Department of Primary Industries, Queensland Horticulture Institute), Dr Ralf Dietzgen (Queensland Department of Primary Industries, Queensland Agricultural Biotechnology Centre), Dr David Teakle (Department of Microbiology and Parasitology, The University of Queensland), Dr Chris Hayward (Department of Microbiology and Parasitology, The University of Queensland) and Dr Lindsay Sly (Department of Microbiology and Parasitology, The University of Queensland) for advice and supervision throughout this study. I recognise the contribution of Dr Wasmo Wakman, Karen Thomson and Cherie Gambley to the present understanding of pineapple viruses in Australia. I am grateful for the seedling plants and parents from the commercial breeding program, and the pineapple plants representing Ananas germplasm that were provided by Garth Sanewski (Queensland Department of Primary Industries, Maroochy Horticultural Research Station). I thank Jim Harris (Moggill), Col Scott (Golden Circle Pty Ltd, Brisbane) and Doug Christiansen (Golden Circle Pty Ltd, Brisbane) for supplying pineapple plants, crowns and leaf material. I am indebted to Mike Smith (Queensland Department of Primary Industries, Maroochy Horticultural Research Station) for lessons and guidance in plant tissue culture as well as the provision of tissue cultured plantlets. I thank Mark Gibson (Production Manager, Golden Circle Pty Ltd, Brisbane) for the use of the steel pot, steam injected “beetroot cookers”, Peter Swan and Vicki Sharpe (Research and Development, Golden Circle Pty Ltd, Brisbane) for technical assistance, and Paddy, Chook and “X” for overseeing the running of the cookers during the hot water treatment process. I sincerely thank Anita Kessling, Lee McMichael, Cherie Gambley, Andrew Geering, Mary White and Murray Sharman (Department of Primary Industries, Queensland Horticulture Institute) for instruction in virological techniques including electron microscopy, serology and nucleic acid analysis. I am grateful to Soetarmi Serrono, Vishna Steele, Karen Bell and Louisa Storie for technical assistance with experimental work, and Dean Beasley for IT support during thesis production. I have greatly appreciated the encouragement given to me by all of the staff from the Plant Pathology group at the Queensland Department of Primary Industries. Particularly the graciousness of my past (Rob O’Brien, Bob Davis, Natalie Moore, Ken iii
Pegg, John Thomas and Linda Smith) and present (Denis Persley) employers in allowing me the time and flexibility to finish this thesis. On a personal note I would especially like to thank my parents Michael and Kathy Horlock, Dean Beasley, Angela Finch, Natalii Paczkowski, Olivia Sargent, Andrew Hoadley, Lee McDonald and Scott Tredwell for their constant enthusiasm and encouragement throughout the course of this project, without which this thesis would never have been completed.
iv
ABSTRACT Mealybug wilt disease (MBW) remains the most significant field disease of pineapples today.
Currently two different virus types have been found to infect
pineapples in Australia (Wakman et al., 1995) and Hawaii (Gunasinghe and German, 1989; Hu et al., 1996), Pineapple bacilliform virus (PBV) and pineapple closterovirus(es) (PCV).
The work undertaken in this thesis focuses on the
development of a detection system for pineapple closterovirus(es) and the elimination of both viruses from infected pineapple material. An effective purification system which would significantly increase the proportion of PCV particles, and removing PBV particles from the final preparation was not developed in this study. A substantial improvement of the previous technique used by Wakman (1994; Wakman et al., 1995) was achieved by optimising each step in the purification process, but still did not yield preparations of very high purity. Such preparations still contained PBV particles and significant amounts of host plant contamination. A variety of different techniques were used in attempts to transmit PCV and PBV to alternative plant hosts. It was hoped that a particular host plant species or cultivar may be infected by only one of the viruses, or may contain higher concentrations of virus particles, or might lead to less host plant contamination. Inoculation by mechanical methods, graft or wound contact techniques and insect vectors failed to transmit either virus to new plant species or even other pineapples. Serological studies involved the improvement of an immunosorbent electron microscope (ISEM) technique developed by Wakman (1994; Wakman et al., 1995). ISEM became more effective at detecting PBV particles after the addition of Sugarcane bacilliform virus antiserum (provided by B.E. Lockhart) to the trapping antibody. Although initially promising, a polyclonal antiserum produced by Wakman (1994; Wakman et al., 1995) was found to be unsuitable for use in ELISA. Attempts made by the author to produce PCV-specific monoclonal antibodies were unsuccessful due to a combination of impure virus preparations (Chapter 3) and an inferior adjuvant (Chapter 4). Extraction of dsRNA from MBW affected pineapples gave inconsistent results. The method of Gonsalves (1993) for PCV worked on one occasion, but was not reliable. A number of different methods were also attempted, but all failed to yield dsRNA. Cloning of cDNA from MBW affected pineapples provided by John Hu (University of v
Hawaii) produced two plasmid clones with inserts, which have only recently been confirmed to contain PCV-specific sequence. These two clones contain sequences with similarity to the helicase and replicase genes of Pineapple mealybug-wilt associated virus 1 (PMWaV1) and PMWaV2 respectively (personal communication John Hu; Melzer et al., 2001). A specific RT-PCR assay was developed from the sequence of the replicase clone, but was not sensitive enough for diagnostic use. The usefulness of this test remains unclear as it only detects a subset of the PCV particles observed by ISEM. Elimination of virus(es) from planting material, ie pineapple crowns, was attempted using hot water treatment (HWT) and plant tissue culture. Contrary to the findings of Ullman et al. (1991; Ullman et al., 1993) HWT was not able to eliminate either PCV or PBV from any crown. Meristem tip culture also failed to eliminate the viruses, even when combined with in vitro heat treatments.
vi
PUBLICATIONS Refereed Scientific Papers Wakman, W., Thomson, K.G., Horlock, C.M., Teakle, D.S., Dietzgen, R.G. and Thomas, J.E. (1996). Association of viruses with asymptomatic and wilt-affected pineapples in Queensland. Proceedings of the Third Horticultural Industry Technical Conference, Gold Coast, 18-22 August, 1996. Presentations to National and International Scientific Meetings Horlock, C.M., Thomas, J.E., Dietzgen, R.G. and D.S. Teakle. (1997). Attempts to Produce Virus Free Pineapples. Abstracts from the Australiasian Plant Pathology Society 11th Biennial Conference, Rendezvous Observation City Hotel, Perth, Western Australia, 29 September – 2 October, 1997. Horlock, C.M. and R.G. O’Brien. (1999). Hot Water Treatment Reduces Seed-borne Bacterial Blotch in Melons. Abstracts from the Australiasian Plant Pathology Society 12th Biennial Conference, Rydges Canberra, Canberra Australian Capital Territory, Australia, 27 – 30 September, 1999. Teakle, D.S., Wakman, W., Thomson, K.G., Horlock, C.M., Dietzgen, R.G. and Thomas, J.E. (1996). Association of viruses with asymptomatic and wilt-affected pineapples in Queensland. Abstracts from the Third Horticultural Industry Technical Conference, Gold Coast, 18-22 August, 1996. Thomas, J.E., Wakman, W., Teakle, D.S. Dietzgen, R.G., Thomson, K.G. and Horlock, C.M. (1994). Mealybug wilt of pineapple. Annual Pineapple Field Day, Beerwah, 15 July, 1994 (poster). Thomson, K.G., Horlock, C.M., Dietzgen, R.G., Thomas, J.E. and Teakle, D.S. (1995). A badnavirus from pineapple in Australia. Abstracts from the Australiasian Plant Pathology Society 10th Biennial Conference, Lincoln University, Christchurch, New Zealand, 28-30 August, 1995.
vii
Thomson, K.G., Horlock, C.M., Wakman, W., Thomas, J.E., Dietzgen, R.G. and Teakle, D.S. (1996). Properties of pineapple clostero-like viruses (PCV) and pineapple bacilliform virus (PBV) from Australia. Xth International Congress of Virology, Jerusalem, Israel, 11-16 August, 1996 (poster). Wakman, W., Thomson, K.G., Horlock, C.M., Teakle, D.S., Thomas, J.E., Dietzgen, R.G. and Scott, C.H. (1995). Newly discovered viruses infecting pineapple in Australia. The 2nd Symposium International Ananas Troi-Ilets, Martinique, 2024 February, 1995 (poster). Papers in Preparation Horlock, C.M., Thomas, J.E., Dietzgen, R.G. and D.S. Teakle. Hot water treatment of infected pineapple crowns does not eliminate closteroviruses or Pineapple bacilliform virus in Australia. (Target journal Australian Journal of Experimental Agriculture).
viii
Table of Contents
TABLE OF CONTENTS DECLARATION OF ORIGINALITY........................................................................ II ACKNOWLEDGEMENTS .........................................................................................III ABSTRACT ....................................................................................................................V PUBLICATIONS........................................................................................................ VII TABLE OF CONTENTS ............................................................................................. IX LIST OF TABLES..................................................................................................... XIX LIST OF FIGURES................................................................................................... XXI LIST OF APPENDICES ..........................................................................................XXII LIST OF ABBREVIATIONS ................................................................................ XXIII LIST OF SYMBOLS .............................................................................................. XXIX CHAPTER 1 1.1
LITERATURE REVIEW................................................................... 1
THE PINEAPPLE PLANT.................................................................................. 1
1.1.1
CULTIVARS AND VARIETIES.................................................................................. 2
1.1.2
BOTANY ................................................................................................................ 3
1.2
PINEAPPLE PRODUCTION INDUSTRY ....................................................... 7
1.2.1 1.3
PINEAPPLE INDUSTRY IN AUSTRALIA .................................................................... 7 PINEAPPLE PESTS, DISEASES AND DISORDERS ...................................... 8
1.3.1 1.4
VIRUSES INFECTING PINEAPPLE............................................................................. 9 MEALYBUG WILT OF PINEAPPLE ........................................................................ 13
1.4.1
SYMPTOMS ......................................................................................................... 14
1.4.2
HISTORY OF MBW DISEASE ............................................................................... 17
1.4.3
FACTORS INVOLVED IN MBW OF PINEAPPLE...................................................... 18
1.4.3.1
Wilt ................................................................................................................. 18
1.4.3.2
Mealybugs ...................................................................................................... 18
1.4.3.6
Ants................................................................................................................. 20
1.4.4
THE CAUSE OF MBW ......................................................................................... 20
1.4.4.1
“Toxin Hypothesis” ........................................................................................ 21
1.4.4.2
“Latent transmissible factor” hypothesis........................................................ 21 ix
Table of Contents
1.4.4.3
A transmissible “virus” from India................................................................. 22
1.4.4.4
“Mild strain virus” Hypothesis ....................................................................... 22
1.4.4.5
Which virus is it?............................................................................................ 23
1.4.5
CONTROL OF MBW ............................................................................................ 24
1.4.5.2 1.5
Control measures currently used in Australia................................................. 25
CLOSTEROVIRUSES....................................................................................... 26
1.5.1
TAXONOMY ........................................................................................................ 26
1.5.2
SYMPTOMS ......................................................................................................... 27
1.5.3
HOST RANGE AND DISTRIBUTION ........................................................................ 27
1.5.4
PARTICLE MORPHOLOGY ..................................................................................... 27
1.5.5
GENOME STRUCTURE .......................................................................................... 28
1.5.6
PROTEINS ............................................................................................................ 29
1.5.7
SEROLOGY .......................................................................................................... 29
1.5.8
TRANSMISSION ................................................................................................... 29
1.5.9
MIXED INFECTIONS INVOLVING CLOSTEROVIRUSES ............................................ 30
1.6
PINEAPPLE CLOSTEROVIRUS .................................................................... 31
1.6.1
NOMENCLATURE................................................................................................. 32
1.6.2
PARTICLE MORPHOLOGY ..................................................................................... 34
1.6.3
MOLECULAR INFORMATION ................................................................................ 34
1.6.4
TAXONOMY ........................................................................................................ 35
1.6.5
TRANSMISSION ................................................................................................... 35
1.6.6
PCV DETECTION ............................................................................................... 35
1.6.6.1
Nucleic-acid based detection .......................................................................... 36
1.6.6.2
Serological detection ...................................................................................... 36
1.6.8
VIRUS ELIMINATION ........................................................................................... 37
1.6.8.1
Heat treatment................................................................................................. 37
1.6.8.2
Virus elimination by tissue culture................................................................. 37 CURRENT STATUS OF RESEARCH ........................................................................ 37
1.6.9 1.6.9.1
Sri Lanka ........................................................................................................ 38
1.6.9.2
Hawaii............................................................................................................. 38
1.6.9.3
Other countries ............................................................................................... 38
1.6.9.4
Australia ......................................................................................................... 39
1.7
CONCLUSIONS.................................................................................................. 39
1.8
AIMS OF THE RESEARCH PROJECT.......................................................... 40
x
Table of Contents
CHAPTER 2
GENERAL MATERIALS AND METHODS ................................ 41
2.1
GENERAL REAGENTS AND CONDITIONS ................................................ 41
2.2
SOURCE AND MAINTENANCE OF PINEAPPLE PLANTS ...................... 41
2.3
ELECTRON MICROSCOPY ............................................................................ 42
2.3.1
NEGATIVE STAINING OF VIRUS PARTICLES .......................................................... 42
2.3.2
ISEM: TRAPPING AND STAINING OF VIRUS PARTICLES ....................................... 42
2.3.3
TRAPPING, DECORATING AND STAINING OF VIRUS PARTICLES............................. 42
2.3.4
DECORATION OF VIRUS PARTICLES USING GOLD CONJUGATES ............................ 43
2.4
POLYMERASE CHAIN REACTION DETECTION OF PBV ..................... 43
2.4.1
LEAF SOAK TEMPLATE PREPARATION.................................................................. 43
2.4.2
PBV-SPECIFIC PCR USING PBV1 AND PBV2 PRIMERS ...................................... 44
2.5
POLYCLONAL ANTIBODY PREPARATIONS............................................ 44
2.5.1
MATERIALS ........................................................................................................ 44
2.5.2
PREPARING ANTISERUM FROM WHOLE RABBIT BLOOD ........................................ 45
2.5.3
PURIFICATION OF IGG......................................................................................... 45
2.5.4
CONJUGATION OF PCV IGG................................................................................ 46
2.6
PRODUCTION OF MONOCLONAL ANTIBODIES .................................... 46
2.7
MOLECULAR BIOLOGY METHODS .......................................................... 47
2.7.1
MATERIALS ......................................................................................................... 47
2.7.2
COMMON METHODS ............................................................................................ 47
2.7.2.1
Phenol : chloroform extraction of DNA solutions.......................................... 47
2.7.2.2
Precipitation of nucleic acids.......................................................................... 47
2.7.2.3
Estimation of nucleic acid concentration ....................................................... 47
2.7.3
NUCLEIC ACID ENZYME DIGESTION PROTOCOLS ............................................... 48
2.7.3.1
DNase I digestion of dsRNA preparations ..................................................... 48
2.7.3.2
RNase A digestion of plasmid DNA preparations.......................................... 48
2.7.3.3
Proteinase K digestion and phenol-chloroform extraction............................. 49
2.7.4
PURIFICATION OF DNA....................................................................................... 49
2.7.4.1
Plasmid DNA purification .............................................................................. 49
2.7.4.2
“Double Geneclean” Protocol for cDNA purification.................................... 50
2.7.5 2.7.5.1
NUCLEIC ACID TEMPLATE PREPARATIONS FOR USE IN PCR................................. 50 Total nucleic acid extracts (TNAEs) .............................................................. 50
2.7.6
REVERSE TRANSCRIPTION OF RNA .................................................................... 51
2.7.7
SOUTHERN HYBRIDISATION TECHNIQUES ........................................................... 51 xi
Table of Contents
2.7.7.1
DNA transfer from agarose gel to nylon membrane ...................................... 51
2.7.7.2
Hybridisation .................................................................................................. 52
2.7.7.3
Chemiluminescent detection .......................................................................... 53
2.7.8
AGAROSE GEL ELECTROPHORESIS ....................................................................... 53
2.7.9
POLYACRYLAMIDE GEL ELECTROPHORESIS (PAGE).......................................... 54
2.7.9.1
TBE-PAGE..................................................................................................... 54
2.7.9.2
SDS-PAGE (Sambrook et al., 1989) .............................................................. 54
2.7.9.3
Polyacrylamide gel staining with Coomassie blue ......................................... 55
2.7.9.4
Polyacrylamide gel staining with ethidium bromide...................................... 55
2.7.9.5
Polyacrylamide gel staining with silver nitrate .............................................. 55
CHAPTER 3 3.1
PURIFICATION OF PCV ............................................................... 57
INTRODUCTION ............................................................................................... 57
3.1.1
PURIFICATION OF CLOSTEROVIRUSES ................................................................. 58
3.1.2
PURIFICATION OF PCV ....................................................................................... 58
3.1.3
PURIFICATION OF PBV ....................................................................................... 59
3.1.4
PURIFICATION OF VIRUSES FROM FIBROUS PLANT TISSUES .................................. 60
3.1.5
PRESERVING VIRUS-INFECTED PLANT TISSUES .................................................. 60
3.1.6
PLAN OF INVESTIGATION..................................................................................... 61
3.2
PRESERVING VIRUS INFECTED PINEAPPLE TISSUE .......................... 62
3.2.1
FREEZING LEAF TISSUE AT -70OC ........................................................................ 62
3.2.2
FREEZING LEAF TISSUE AT -20OC ........................................................................ 64
3.2.3
FREEZE DRYING LEAF TISSUE .............................................................................. 64
3.2.4
STORING LEAF TISSUE AT 5OC............................................................................. 64
3.2.5
MAINTAINING “LIVE CULTURES” OF PCV........................................................... 65
3.3
ISOLATING PINEAPPLE CLOSTEROVIRUSES FROM PINEAPPLE WITH PUBLISHED METHODS ...................................................................... 66
3.3.1
METHODS BASED ON THAT OF WAKMAN ET AL. (1995)....................................... 67
3.3.1.1
Original........................................................................................................... 67
3.3.1.2
Modification to Wakman et al. (1995): Caesium chloride gradient............... 68
3.3.1.3
Modification to Wakman et al. (1995): CelluclastTM .................................... 68
3.3.1.4
Modification to Wakman et al. (1995): Homogeniser .................................. 71
3.3.2
OTHER CLOSTEROVIRUS PURIFICATION METHODS ............................................. 71
3.3.2.1
Citrus tristeza virus (Barkley and Gillings, 1993) ........................................ 71
3.3.2.2
Lettuce infectious yellows virus (Klaassen et al., 1994)................................ 72
xii
Table of Contents
3.3.2.3
Grapevine virus B (Boscia et al., 1993) ........................................................ 72
3.3.2.4
Little cherry virus (Ragetli et al., 1982) ........................................................ 73
3.3.2.5
Modified Little cherry virus method ............................................................. 74
3.4
DEVELOPING AN IMPROVED PURIFICATION PROCESS FOR PINEAPPLE CLOSTEROVIRUSES ................................................................ 76
3.4.1
RELEASING VIRUSES FROM PINEAPPLE PLANT TISSUES ...................................... 76
3.4.2
DEVELOPING A BETTER EXTRACTION BUFFER ................................................... 77
3.4.2.1
Standard virus extraction method for assessing extraction buffers ................ 78
3.3.4.2
Testing established virus extraction buffers ................................................... 78
3.4.2.3
Testing different salt solutions ....................................................................... 80
3.4.2.4
Testing the pH of the extraction buffer .......................................................... 81
3.4.2.5
Testing the salt concentration of the extraction buffer ................................... 82
3.4.2.7
Summary of extraction buffer trials................................................................ 85
3.4.3
CLARIFICATION OF PINEAPPLE VIRUS EXTRACTS ............................................... 85
3.4.3.1
No treatment ................................................................................................... 86
3.4.3.2
Sucrose cushion .............................................................................................. 86
3.4.3.3
PEG precipitation ........................................................................................... 87
3.4.3.4
Charcoal / Bentonite ....................................................................................... 88
3.4.3.5
Chloroform ..................................................................................................... 88
3.4.3.6
Butanol ........................................................................................................... 89
3.4.3.7
Chloroform and Butanol................................................................................. 89
3.4.3.8
Summary of clarification methods ................................................................. 89
3.4.4
DENSITY GRADIENTS .......................................................................................... 90
3.4.4.1
Caesium sulphate gradients ............................................................................ 90
3.4.4.2
Caesium chloride gradients ............................................................................ 91
3.4.4.3
Caesium chloride cushion............................................................................... 92
3.4.4.4
Nycodenz gradients ...................................................................................... 93
3.4.4.5
Summary of density gradients ........................................................................ 94
3.5
OPTIMISED VIRUS PURIFICATION METHODS....................................... 94
3.5.1
LEAF SAP EXTRACT METHOD............................................................................... 97
3.5.2
PARTIAL PURIFICATION METHOD ........................................................................ 97
3.5.3
COMPLETE PURIFICATION METHOD ..................................................................... 97
3.6
DISCUSSION...................................................................................................... 99
xiii
Table of Contents
CHAPTER 4 DETECTION OF PINEAPPLE VIRUSES BY SEROLOGICAL METHODS...................................................................................................... 105 4.1
INTRODUCTION ............................................................................................ 105
4.1.1
ANTIBODIES ...................................................................................................... 105
4.1.1.1
Monoclonal antibodies (MAb) ..................................................................... 106
4.1.1.2
Polyclonal antisera (PAs) ............................................................................. 106
4.1.2
USE OF ANTIBODIES IN SEROLOGICAL ASSAYS .................................................. 107
4.1.3
USING ANTIBODIES TO DETECT VIRUSES ........................................................... 108
4.1.3.1
Electron microscopy ..................................................................................... 108
4.1.3.2
Enzyme-linked assays .................................................................................. 109
4.1.4
PCV ANTISERA ................................................................................................. 110
4.1.4.1
Hawaiian polyclonal antiserum .................................................................... 110
4.1.4.2
Australian PCV antiserum (PCV-PAs) ........................................................ 111
4.1.4.3
Hawaiian monoclonal antibodies.................................................................. 112 PLAN OF INVESTIGATION .................................................................................. 113
4.1.5 4.2
DEVELOPING AN ISEM ASSAY FOR PCV AND PBV............................. 113
4.2.1
PCV DETECTION .............................................................................................. 113
4.2.1.1
Polyclonal PCV antiserum ........................................................................... 113
4.2.1.2
Evaluation of PCV antiserum bleeds............................................................ 114
New Bleed antisera from Table 4.1 .............................................................................. 115 4.2.1.3
Specificity of antisera for PCV..................................................................... 115
4.2.1.4
Summary of PCV detection.......................................................................... 115 PBV DETECTION .............................................................................................. 117
4.2.2 4.2.2.1
Specificity of PCV-PAs bleeds for PBV ...................................................... 117
4.2.2.2
Trapping with badnavirus antisera ............................................................... 117
4.2.2.3
Comparison of SCBV-4Mx and PCV-PAs by decoration ........................... 117
4.2.2.4
Summary of PBV detection.......................................................................... 118
4.2.3
ISEM DETECTION OF PCV AND PBV ............................................................... 119
4.2.3.1
ISEM as a diagnostic test.............................................................................. 119
4.2.3.2
Samples tested using ISEM .......................................................................... 121
4.3
DETECTING PCV USING ELISA ................................................................ 122
4.3.1
BUFFERS AND CONDITIONS ............................................................................... 122
4.3.2
DOUBLE ANTIBODY SANDWICH-ELISA (DAS-ELISA).................................... 125
4.3.3
PLATE TRAPPED ANTIGEN-ELISA (PTA-ELISA)............................................. 127
4.3.3.1 xiv
Comparison of PCV-PAs bleeds .................................................................. 128
Table of Contents
4.3.3.2
Different dilutions of detecting antiserum.................................................... 130
4.3.4
STAPHYLOCOCCUS PROTEIN A-ELISA (SPA-ELISA) ....................................... 131
4.3.5
DASSANAYAKE PCV ELISA ............................................................................ 133
4.4
MONOCLONAL ANTIBODY PRODUCTION ........................................... 135
4.4.1
HYBRIDOMA PRODUCTION ................................................................................ 136
4.4.1.1
Injection of mice........................................................................................... 136
4.4.1.3
Dissection of spleen and fusion with myeloma cells.................................... 139
4.4.1.4
Hybridoma maintenance............................................................................... 139 DETECTING MONOCLONAL ANTIBODIES ............................................................ 139
4.4.2 4.4.2.1
ELISA controls ............................................................................................. 139
4.4.2.2
TAS-ELISA .................................................................................................. 140
4.4.3
CLONING HYBRIDOMAS .................................................................................... 140
4.4.3.1
Cloning of hybridoma cells .......................................................................... 142
4.4.3.2
Screening cloned hybridomas....................................................................... 142
4.4.4
DETAILS OF HYBRIDOMAS PRODUCED ............................................................... 144
4.4.5
DETERMINING THE SOURCE OF HYBRIDOMA CULTURE CONTAMINATION .......... 144
4.4.6
DETERMINING THE SPECIFICITY OF MONOCLONAL ANTIBODIES ........................ 146
4.4.6.1
Decoration of virus particles......................................................................... 147
4.4.6.2
Determining the isotype of MAb VII 2H5 ................................................... 147
4.4.6.3
Determining specificity using coating antibodies ........................................ 147
4.4.6.4
Removing high background ......................................................................... 148
4.4.6.5
Titration of Antibody titre ............................................................................ 148
4.4.6.6
ELISA testing of plant samples .................................................................... 148
4.4.6.7
ELISA testing of a virus purification gradient ............................................. 152
4.5
DISCUSSION.................................................................................................... 153
CHAPTER 5 ANALYSIS OF PCV COAT PROTEIN AND NUCLEIC ACIDS ... ............................................................................................................ 159 5.1
INTRODUCTION ............................................................................................ 159
5.1.1
COAT PROTEIN SIZE.......................................................................................... 159
5.1.2
DSRNA............................................................................................................. 159
5.1.3
NUCLEIC ACID HYBRIDISATION ........................................................................ 161
5.1.4
REVERSE TRANSCRIPTION- POLYMERASE CHAIN REACTION (RT-PCR) ............. 163
5.1.5
PLAN OF INVESTIGATION .................................................................................. 163
5.2
PAGE ANALYSIS OF VIRAL COAT PROTEIN........................................ 164 xv
Table of Contents
5.3
DSRNA
EXTRACTION.................................................................................... 165
5.3.1
GONSALVES (1993) DSRNA EXTRACTION METHOD FOR PCV.......................... 166
5.3.2
REZAIAN ET AL. (1991) EXTRACTION OF DSRNA FROM LEAFROLL-AFFECTED GRAPEVINES
...................................................................................................... 168
5.3.3
VALVERDE ET AL. (1990B) AND DODDS AND BAR-JOSEPH (1983).................... 168
5.3.4
EXTRACTION OF CITRUS TRISTEZA VIRUS DSRNA .............................................. 170
5.3.5
DSRNA EXTRACTION WITHOUT ORGANIC SOLVENTS ........................................ 170
5.3.6
DALE ET AL. (1986) EXTRACTION OF PANGOLA STUNT VIRUS DSRNA ................ 171
5.3.7
DSRNA EXTRACTION USING MICROGRANULAR DEAE CELLULOSE .................. 171
5.4
CLONING OF DSDNA DERIVED FROM HAWAIIAN PCV .................... 174
5.4.1
CLONING FROM REAMPLIFIED DSDNA.............................................................. 175
5.4.1.1
PCV dsDNA reamplification........................................................................ 175
5.4.1.2
DNA digestion with Eco R1......................................................................... 176
5.4.1.3
Ligating PCV cDNA into pBluescript.......................................................... 176
5.4.1.4
Transformation of competent E. coli cells with recombinant phagemid..... 176
5.4.2
ANALYSIS OF CLONES....................................................................................... 177
5.4.3
DIRECT CLONING OF HAWAIIAN CDNA ............................................................ 179
5.5
DETECTION OF PCV BY NUCLEIC ACID HYBRIDISATION.............. 186
5.5.1
DIG LABELLING OF DNA BY PCR ................................................................... 186
5.5.2
DOT BLOTTING TO TEST DIG-LABELLED PROBE SENSITIVITY............................ 187
5.6
DETECTION OF PCV USING RT-PCR....................................................... 189 PRIMER DESIGN ................................................................................................. 189
5.6.1 5.6.1.1
RdRp primer PCR......................................................................................... 190
5.6.1.2
HEL primer PCR .......................................................................................... 191
5.6.2
RT-PCR WITH RDRP PRIMERS.......................................................................... 191
5.6.3
RT-PCR WITH HEL PRIMERS ........................................................................... 192
5.6.4
LEAF SOAK TEMPLATE PREPARATION RT-PCR................................................. 193
5.7
ATTEMPT TO SEQUENCE BETWEEN PUTATIVE REPLICASE AND HELICASE CLONES ....................................................................................... 194 5.7.1 USING RDRP AND HEL PRIMERS ...................................................................... 197 5.7.2 5.8
DEVELOPING NEW PRIMERS .............................................................................. 198 DISCUSSION.................................................................................................... 200
CHAPTER 6 6.1 6.1.1 xvi
ATTEMPTS TO PRODUCE VIRUS-FREE PINEAPPLES..... 205
INTRODUCTION ............................................................................................. 205 HEAT THERAPY ................................................................................................ 205
Table of Contents
6.1.2
HOT WATER TREATMENT ................................................................................. 207
6.1.2.1
Heat treatment of pineapple crowns in India................................................ 207
6.1.2.2
HWT of pineapple crowns in Hawaii ........................................................... 208
6.1.2.3
HWT in Australia ......................................................................................... 209
6.1.2.4
HWT in Sri Lanka ........................................................................................ 209
6.1.3
PLANT TISSUE CULTURE ................................................................................... 210
6.1.3.1
Virus elimination by tissue culture in Australia ........................................... 212
6.1.4
HEAT TREATMENT OF IN VITRO PLANTLETS ...................................................... 212
6.1.5
PLAN OF INVESTIGATION .................................................................................. 214
6.2
VIRUS ELIMINATION BY HOT WATER TREATMENT USING THE METHOD OF HU ET AL. (1995) ………………………………………...214
6.2.1
WATERBATHS AND THERMOCOUPLE ................................................................. 215
6.2.2
PINEAPPLE CROWNS .......................................................................................... 215
6.2.3
THERMOCOUPLE PLACEMENT ........................................................................... 216
6.2.4
HWT AND PLANTING OF CROWNS..................................................................... 216
6.2.5
HWT USING THE METHOD OF HU ET AL. (1995) ................................................ 217
6.3
DEVELOPING AN AUSTRALIAN HWT PROTOCOL ............................. 219
6.3.1
CROWN MORTALITY PROFILE ............................................................................ 219
6.3.2
COMPARISON OF CROWN MORTALITY BETWEEN PINEAPPLE VARIETIES ............. 220
6.3.3
EFFECT OF HWT ON VIRUS PARTICLES IN AUSTRALIAN PINEAPPLE CROWNS .... 220
6.4
VIRUS ELIMINATION BY TISSUE CULTURE ......................................... 226
6.4.1
TISSUE CULTURE MEDIUM AND GROWTH CONDITIONS ...................................... 227
6.4.2
VIRUS INDEXING ............................................................................................... 228
6.4.3
LATERAL BUD CULTURED PLANTLETS ............................................................... 228
6.4.4
CALLUS CULTURED PLANTLETS ....................................................................... 230
6.4.5
MERISTEM TIP CULTURED PLANTLETS .............................................................. 230
6.4.5.1
Source of pineapple crowns for dissection................................................... 230
6.4.5.2
Meristem tip dissection technique ................................................................ 231
6.4.5.3
Size of meristem tips dissected..................................................................... 231
6.4.5.4
Number of plantlets produced ...................................................................... 231
6.4.3.5
Virus indexing of meristem tip cultured plantlets ........................................ 233
6.5
HEAT TREATMENT OF IN VITRO PLANTLETS ..................................... 234
6.5.1
PLANTLETS PRIOR TO HEAT TREATMENT ........................................................... 234
6.5.2
HEAT TREATMENT REGIME ............................................................................... 235
6.5.3
DISSECTION AND ANALYSIS OF HEAT TREATED PLANTLETS............................... 235 xvii
Table of Contents
6.6
DISCUSSION.................................................................................................... 238
CHAPTER 7 7.1
INTRODUCTION ............................................................................................ 245
7.1.1 7.2
TRANSMISSION OF PCV ............................................................ 245
PLAN OF INVESTIGATION................................................................................... 247 SEED TRANSMISSION .................................................................................. 247
7.2.1
1994 SEEDLING CROSSES ................................................................................. 247
7.2.2
1995 SEEDLINGS ............................................................................................... 248
7.3
MECHANICAL TRANSMISSION ................................................................ 249
7.3.1
LEAF SURFACE ABRASION USING CARBORUNDUM ............................................. 250
7.3.1.1
Virus preparations ........................................................................................ 250
7.3.1.2
Inoculation technique ................................................................................... 250
7.3.2
STABBING WITH A SYRINGE NEEDLE ................................................................. 252
7.3.3
SLICING WITH A SCALPEL .................................................................................. 252
7.3.4
INJECTION OF VIRUS INTO PLANT TISSUES ......................................................... 253
7.4
GRAFT TRANSMISSION .............................................................................. 254
7.5
INSECT VECTOR TRANSMISSION ........................................................... 255
7.5.1
MEALYBUG TRANSMISSION .............................................................................. 256
7.5.2
APHID TRANSMISSION ....................................................................................... 257
7.5.3
CONTINUOUS INOCULATION WITH MEALYBUGS AND APHIDS ............................ 257
7.6
DISCUSSION.................................................................................................... 258
CHAPTER 8
DETECTION OF PBV ................................................................... 263
CHAPTER 9
GENERAL CONCLUSIONS ..................................................... 265
BIBLIOGRAPHY....................................................................................................... 269 APPENDICES............................................................................................................. 288
xviii
List of Tables
LIST OF TABLES CHAPTER 1
LITERATURE REVIEW ................................................................. 1
Table 1.1: Major diseases, disorders, pathogens and pests affecting pineapple plants and fruit in Queensland............................................................................. 9 Table 1.4: Tentative species groupings within the Genus Closterovirus .................... 26 Table 1.5: Countries in which “Closterovirus-like” particles have been detected in pineapple ................................................................................................. 32 CHAPTER 3
PURIFICATION OF PCV ............................................................... 57
Table 3.1: Comparison of methods used to store PCV-infected leaf tissue ................ 63 Table 3.2: Comparison of Grinding Methods used to Release Virus Particles from Pineapple Tissues.................................................................................... 77 Table 3.3: Comparison of Published Virus Extraction Buffers for use with PCV-infected Pineapple – Experiment 1 ....................................................................... 79 Table 3.4: A Comparison of Published Virus Extraction Buffers for use with PCVinfected Pineapple – Experiment 2 ......................................................... 80 Table 3.5: Comparison of Salt Solutions for PCV Extraction Buffer ............................ 81 Table 3.6: Effect of pH of Tris-HCl and Potassium Phosphate buffers ability to extract PCV particles .......................................................................................... 82 Table 3.7: Comparison of Salt Concentrations for use in the Extraction of PCV from Pineapple Leaf Tissue. ............................................................................ 83 Table 3.8: Comparison of the Effect of Various Buffer Additives on PCV Extraction 84 Table 3.9: Comparison of Methods to Clarify Pineapple Extracts................................ 86 CHAPTER 4 DETECTION OF PINEAPPLE VIRUSES BY SEROLOGICAL METHODS ........................................................................................................ 105 Table 4.1: Table 4.2: Table 4.3: Table 4.4: Table 4.5: Table 4.6: Table 4.7:
Details of further PCV-PAs bleeds ............................................................ 114 Testing of PCV antisera for the ability to trap PCV and PBV particles .... 115 Numbers of virus particles trapped by badnavirus antisera. ...................... 118 Decoration of PBV and SCBV particles with PCV-PAs and SCBV-4Mx 120 Buffers used in ELISA ............................................................................... 126 Comparison of PCV-PAs bleeds for detecting PCV in PTA-ELISA......... 129 Comparison of PCV-PAs concentration for the detection of PCV using PTAELISA ................................................................................................... 131 Table 4.8: Detection of PCV using SPA-ELISA......................................................... 132 Table 4.9: Comparison of PCV-PAs bleeds used in Dassanayake protocol ............... 134 Table 4.10: Results of Fusions .................................................................................... 145 Table 4.11: Summary of monoclonal antibodies which gave positive screening reactions ................................................................................................ 146 Table 4.12: Specificity of MAb VII 2H5 by TAS-ELISA .......................................... 149 Table 4.13: Comparison of different blocking reagents used in TAS-ELISA ............ 150 Table 4.14: Titration of MAb VII 2H5 working concentration for TAS-ELISA........ 151 Table 4.15: Testing of seedling pineapple plants with MAb VII 2H5 ELISA............ 152 Table 4.16: Density Gradient Separation of MAb VII 2H5 ELISA Positive Proteins 154 xix
List of Tables
CHAPTER 5 ANALYSIS OF PCV COAT PROTEIN AND NUCLEIC ACIDS 159 Table 5.1: Nucleotide sequences of primers used in cloning of Hawaiian PCV......... 175 Table 5.2: cDNA : Phagemid ratios used in ligation of Eco R1-digested PCV cDNA into Eco R1-digested pBluescript II SK(+) phagemid........................ 177 Table 5.3: PCR primers designed from clones #32 (Replicase primers; RdRp) and #43 (Helicase primers; HEL) ....................................................................... 190 Table 5.4: Primers developed to bridge the gap between RdRp and HEL clones....... 199 CHAPTER 6 ATTEMPTS TO PRODUCE VIRUS - FREE PINEAPPLES... 205 Table 6.1: Effect of HWT method of Hu et al. (1995) on the elimination of viruses from fresh and dried Australian pineapple crowns. .............................. 218 Table 6.2: The effect of hot water treatment of dried pineapples on the status of PCV and PBV. ............................................................................................... 225 Table 6.3: Virus status of tissue cultured plantlets...................................................... 232 Table 6.4: Descriptions of tissue cultured plantlets before and after heat treatment... 236 Table 6.4: Descriptions of tissue cultured plantlets before and after heat treatment, continued............................................................................................... 237 CHAPTER 7 TRANSMISSION OF PCV ............................................................ 245 Table 7.1: Plants Inoculated with PCV and PBV using Carborundum. ...................... 251 Table 7.2: Plants inoculated with PCV and PBV by stabbing of tissues..................... 252
xx
List of Figures
LIST OF FIGURES CHAPTER 1
LITERATURE REVIEW ................................................................... 1
Figure 1.1: Pineapple anatomy ........................................................................................ 4 Figure 1.2: Electron micrograph of PCV and PBV particles ........................................ 11 Figure 1.3A: The symptoms of MBW of pineapple on an individual plant.................. 15 Figure 1.3B: The effects of MBW of pineapple on a plantation ................................... 15 CHAPTER 3
PURIFICATION OF PCV ............................................................... 57
Figure 3.1: Final virus preparation using the method of Wakman et al. (1995) containing both PCV and PBV particles................................................. 69 Figure 3.2: PCV preparation using the newly devised Complete Purification Method 95 CHAPTER 4 DETECTION OF PINEAPPLE VIRUSES BY SEROLOGICAL METHODS ........................................................................................................ 105 Figure 4.1: Diagrammatic representation of the area covered when a grid square is counted for comparative ISEM tests..................................................... 116 Figure 4.2: Diagrammatic representation of the four types of ELISA used in this study, (A) double antibody sandwich (DAS-ELISA); (B) plate trapped antigen (PTA-ELISA); (C) Staphylococcus protein A (SPA-ELISA) and (D) triple antibody sandwich (TAS-ELISA). .............................................. 123 Figure 4.3: Electron micrograph of a purified virus preparation injected into mice ... 137 Figure 4.4: Typical plate layout for hybridoma supernatant screening....................... 141 Figure 4.5: Diagram of dilution cloning techniques; (A) “Quick” cloning and (B) Limiting dilution cloning ...................................................................... 143 CHAPTER 5 ANALYSIS OF PCV COAT PROTEIN AND NUCLEIC ACIDS ... ............................................................................................................ 159 Figure 5.1: Comparison of Methods used to extract dsRNA from PCV-infected pineapple leaves. ................................................................................... 166 Figure 5.2: Analysis of viral dsRNA by TBE-PAGE and Silver Staining.................. 172 Figure 5.3: Nucleotide Sequence of Clone #12 Produced from Hawaiian cDNA. ..... 180 Figure 5.4: Amino acid sequence from RdRp clone (PCV-clone #32). ...................... 181 Figure 5.5: Amino acid sequence of HEL clone (PCV-clone #43). ............................ 183 Figure 5.6: Genome maps of BYV and CTV, showing the location of replicase (POL) and helicase (HEL) domains................................................................. 195 CHAPTER 6
ATTEMPTS TO PRODUCE VIRUS - FREE PINEAPPLES... 205
Figure 6.1: Diagram demonstrating the source of tissue cultured plantlets used in this study, (A) Apical meristem; (B) Lateral bud and (C) Callus culture.... 229
xxi
List of Appendices
LIST OF APPENDICES APPENDIX 1: DETAILS OF THE PCV-PAS BLEEDS...................................... 288 APPENDIX 2: INJECTION HISTORIES OF MICE USED IN MONOCLONAL ANTIBODY PRODUCTION .................................................................................... 289 APPENDIX 3: PERMITS FOR THE IMPORTATION OF PCV-CDNA FROM HAWAII ...................................................................................................................... 290
xxii
List of Abbreviations
LIST OF ABBREVIATIONS 1× HAT
tissue culture medium (Table 2.1)
2× HAT
tissue culture medium (Table 2.1)
ACLSV
Apple chlorotic leaf spot virus
AMV
Alfalfa mosaic virus
ANGIS
Australian National Genome Information Service
AP
alkaline phosphatase
ASGV
Apple stem grooving virus
BAP
6-benzylamino-purine
Bp
base pair(s)
BEB
Boscia extraction buffer
BGEB
Barkley and Gillings extraction buffer
BPYV
Beet pseudoyellows virus
BSA
bovine serum albumin
BSV
Banana streak virus
BSV-MN
polyclonal antiserum specific to a Morroccan isolate of BSV
BSV-RW
polyclonal antiserum specific to a Rwandan isolate of BSV
BYV
Beet yellows virus
C
pineapple clone
C-10
tissue culture medium (Table 2.1)
C-15
tissue culture medium (Table 2.1)
ca.
approximately
Cat #
catalogue number
CCMV
Cowpea chlorotic mottle virus
cDNA
complementary deoxyribonucleic acid
CEB
celluclast extraction buffer
CF-180
pineapple cultivar Champaka F-180
CO2
carbon dioxide
ComYMV
Commelina yellow mottle virus
cm
centimetre(s)
CNFV
Carnation necrotic fleck virus
CsCl
caesium chloride xxiii
List of Abbreviations
Cs2SO4
caesium sulfate
CSSV
Cacao swollen shoot virus
CTV
Citrus tristeza virus
CTV-OSP
strain of Citrus tristeza virus
cv.
cultivar
Da
dalton(s)
dATP
deoxyadenosine triphosphate
dCTP
deoxycytosine triphosphate
DAS-ELISA
double antibody sandwich-enzyme linked immunosorbent assay
DBV
Dioscorea bacilliform virus
ddH2O
double distilled, deionised water
DDT
dichloro-diphenyl-trichloroethane
DEAE
diethylaminoethyl
DEH
digoxygenin Easy-Hyb solution
dGTP
deoxyguanosine triphosphate
DIG
digoxygenin
DNA
deoxyribonucleic acid
DNase
deoxyribonuclease
dNTP
deoxynucleotide triphosphates
dsDNA
double stranded deoxyribonucleic acid
dsRNA
double stranded ribonucleic acid
dTTP
deoxytyrosine triphosphate
EB
extraction buffer
ELISA
enzyme linked immunosorbent assay
et al.
and others
g
gram(s)
g
gravity
GAP-F
PCR primer (Table 5.4)
GAP-R
PCR primer (Table 5.4)
GAR-AP
goat anti-rabbit – alkaline phosphatase
GLRaV
grapevine leafroll-associated virus
GLRaV-1
Grapevine leafroll-associated virus-1
GLRaV-2
Grapevine leafroll-associated virus-2
GLRaV-3
Grapevine leafroll-associated virus-3
xxiv
List of Abbreviations
GMDP
N-acetylglucosaminyl-N-acetylmuramyl-L-alanyl-D-isoglutamine
GVA
Grapevine virus A
h
hour(s)
HAT
hot air treatment
Haw MAb
Hawaiian monoclonal antibodies
HCl
hydrogen chloride
HEB
Horlock extraction buffer
HEL
helicase
HEL.1
PCR primer (Table 5.3)
HEL.2
PCR primer (Table 5.3)
HLV
Heracleum latent virus
HV-6
Heracleum virus - 6
HSP70
heat shock protein 70
HWT
hot water treatment
HT
tissue culture medium (Table 2.1)
Ig
immunoglobulin
IgA
immunoglobulin class A
IgG
immunoglobulin class G
IgM
immunoglobulin class M
ISEM
immunosorbent electron microscopy
kbp
kilobase pair(s)
KCl
potassium chloride
kDa
kiloDalton(s)
KEB
Klaassen extraction buffer
kPa
kiloPascal
KRB
Klaassen resuspension buffer
KTSV
Kalanchoe top-spotting virus
l
litre(s)
LB
Luria-Bertoni
LChV
Little cherry virus
LIYV
Lettuce infectious yellows virus
LMV
Lettuce mosiac virus
LS-PCR
leaf soak-polymerase chain reaction
M
Molar xxv
List of Abbreviations
MAb
monoclonal antibody(ies)
MBW
mealybug wilt
MEB
milk extraction buffer
MET
methyl-transferase
min
minute(s)
ml
millilitre (10-3 l)
mM
millimolar (10-3 M)
MS Media
Murashinge and Skoog basal media
n
chromosome pair
N2
nitrogen
NaI
sodium iodide
NaCl
sodium chloride
NaOH
sodium hydroxide
Na2SO3
sodium sulphite
NB
new bleed (Table 4.2)
ng
nanogram(s) (10-9 g)
NH4(SO4)2
ammonium sulphate
nm
nanometre(s) (10-9 m)
PAGE
polyacrylamide gel electrophoresis
Pap-PRO
leader protein
PAb
polyclonal antibody(ies)
PAs
polyclonal antiserum(a)
PaSV
Pangola stunt virus
PBS
phosphate buffered saline
PBS-Tween
phosphate buffered saline, with 2% (v/v) Tween 80
PBV
Pineapple bacilliform virus
PBV1
reverse PBV primer (Thomson et al., 1996; Thomson, 1997)
PBV2
forward PBV primer (Thomson et al., 1996; Thomson, 1997)
PCLSV
pineapple chlorotic streak virus
PCR
polymerase chain reaction
PC
pineapple closterovirus (Hu et al.,1993; Ullman et al.,1992)
PCV
pineapple closteroviruses
PCV-A
pineapple closterovirus serotype A (Wakman, 1994)
PCV-B
pineapple closterovirus serotype B (Wakman, 1994)
xxvi
List of Abbreviations
PCV-IgG
purified IgG from PCV-PAs
PCV-IgG-AP
alkaline phosphatase conjugated PCV-IgG
PCV-PAs
pineapple closterovirus-polyclonal antiserum, bleed 13-01-1993 (Wakman, 1994)
PMWaV
pineapple mealybug wilt-associated virus
PPB
0.07M potassium phosphate buffer, pH 7.0-7.2
POL
RNA-dependent RNA-polymerase
PRSV
Papaya ringspot virus
PTA
phospho-tungstic acid
PTA-ELISA
plate trapped antigen-enzyme linked immunosorbent assay
PWmtV
pineapple wilt (mealybug transmitted virus) (Bar-Joseph et al., 1995)
PWV
pineapple wilt virus (Dassanayake et al., 1994)
PYMoV
Piper yellow mottle virus
QABC
Queensland Agricultural Biotechnology Centre
QDPI
Queensland Department of Primary Industries
RdRp
replicase (RNA-dependent RNA polymerase)
RdRp.1
PCR primer (Table 5.3)
RdRp.2
PCR primer (Table 5.3)
RNA
ribonucleic acid
RNase
ribonuclease
RNase H
ribonuclease H
RRB
Ragetli resuspension buffer
RT
reverse transcription
RTBV
Rice tungro bacilliform virus
RT-PCR
reverse transcription polymerase chain reaction
RTSV
Rice tungro spherical virus
s
seconds
SAM-AP
Sheep anti-mouse – alklaine phosphatase
SCBV
Sugarcane bacilliform virus
SCBV-4Mx
mixture of four polyclonal antisera specific to different SCBV isolates
SCBV-SB
polyclonal antiserum specific to a Selemi, Bali isolate of SCBV
SDS
sodium dodecyl sulfate
SMMV
Sugarcane mild mosaic virus
SOB
medium (Chapter 2.7.1.2) xxvii
List of Abbreviations
SPA-AP
Staphylococcus protein A – alkaline phosphatase
SPA-ELISA
Staphylococcus protein A-enzyme linked immunosorbent assay
SPSVV
Sweet potato sunken vein virus
SSC
buffer used in Southern blotting
ssDNA
single stranded deoxyribonucleic acid
ssRNA
single stranded ribonucleic acid
STE
salt (NaCl), Tris-HCL, EDTA buffer
TAS-ELISA
triple antibody sandwich-enzyme linked immunosorbent assay
TBE
tris-borate-EDTA
TBIA
tissue blot immunoassay
TE
Tris-HCl, EDTA buffer
TEG
Tris-HCl, EDTA, Glucose buffer
TMV
Tobacco mosaic virus
TNAE
total nucleic acid extract
TNAEB
total nucleic acid extraction buffer
TSWV
Tomato spotted wilt virus
USA
United States of America
v/v
volume per volume
WEB
Wakman extraction buffer
WRB
Wakman resuspension buffer
w/v
weight per volume
WYLV
Wheat yellow leaf virus
X-gal
5-bromo-4chloro-3-indolyl-β-D-galactoside
xxviii
List of Symbols
LIST OF SYMBOLS o
C
degrees Celsius
o
N
degrees north
o
S
degrees south
o
W
degrees west
β
beta
γ
gamma
µg
microgram (10-6 g)
µl
microlitre (10-6 l)
µM
micromolar (10-6 M)
xxix
Chapter 1: Literature Review
CHAPTER 1
Literature Review
One of the most significant field diseases of pineapple in the world today is mealybug wilt (MBW).
Two different types of viruses have been described in
pineapple in Australia (Wakman et al., 1995) and Hawaii (Gunasinghe and German, 1989; Hu et al., 1996), Pineapple bacilliform virus (PBV) and pineapple closterovirus (-es) (PCV). These two virus types have been considered possible components of a disease complex responsible for MBW in pineapple. Traditionally associated with mealybugs, the exact cause of MBW remains unclear, and the roles of PBV and PCV, if any, in the disease have not yet been established. This literature review begins with a general description of the pineapple plant, some background to the pineapple industry, followed by a brief overview of pineapple pests and diseases. A short history of MBW disease throughout the world will set the scene for a detailed examination of recent MBW and PCV research, which has centred mainly in Hawaii and Queensland.
A brief summary of the characteristics of
closteroviruses will be followed by a detailed discussion of PCVs. This review is restricted to publications up to and including the year 1998, the last year in which experiments were performed. The only exception to this rule is the inclusion of one more recent publication (Melzer et al., 2001) which deals specifically with closteroviruses in pineapples, and will help to further clarify experimental results.
1.1
THE PINEAPPLE PLANT The common pineapple (Ananas comosus) is a monocarpic herb, which belongs
to the subclass monocotyledons, family Bromeliaceae (Samson, 1980; Py et al., 1987). Most bromeliads are well adapted to low rainfall areas, and are epiphytic on trees or
1
Chapter 1: Literature Review
grow in well-drained soils (Sinclair, 1993). Although some members of the Ananas genus are grown as ornamental plants, production of the pineapple is primarily for its fruit (Py et al., 1987).
1.1.1
Cultivars and Varieties Pineapple cultivars have been widely distributed and frequently renamed (Leal
and Duval, 1997). As a result, many different pineapple cultivars are known by the same name, and many different names have been given to the same cultivar. The more widespread the cultivar, the greater the confusion (Johnson, 1935; Antoni and Leal, 1981; Leal 1990b). This is especially true for cultivars which are used in international production and trade ie: ‘Smooth Cayenne’, ‘Queen’, ‘Red Spanish’ and ‘Singapore Canning’ or ‘Singapore Spanish’. These cultivar classifications have become limiting and confusing, as they consider only a small part of the existing genetic diversity, and many genotypes cannot be classified in these groups. As a result of the frequent mutation / selection process carried out on pineapples since well before the Spanish conquest, most cultivars have diversified into a collection of phenotypically similar varieties (Leal and Duval, 1997). There are five main groups (cultivars) of cultivated pineapple produced in the world today, Cayenne, Spanish, Queen, Pernambuco and Perolera (Py et al., 1987). The most important cultivars are ‘Cayenne’ and ‘Queen’, which form the basis of commercial production (Leal and Duval, 1997). Cayenne varieties, of which Smooth Cayenne is the type member, are the most widely grown cultivars throughout the world, in spite of being highly susceptible to MBW (Carter and Collins, 1947). Smooth Cayenne is the pillar of the world pineapple canning industry, and its favourable characteristics include spineless leaves, high numbers of good quality fruit and resistance to gummosis (Leal and Duval, 1997).
2
Chapter 1: Literature Review
Spanish pineapples have more variable leaf characteristics, as seen by the spiny leaved Red Spanish and smooth leaved Singapore Spanish (Carter and Collins, 1947). Red Spanish or Espanola Roja originated from Venezuela (Leal and Duval, 1997), and is generally considered a more hardy and vigorous variety than Smooth Cayenne. It has been commercially produced in both Florida and the West Indies for this reason (Collins and Carter, 1954). Singapore Spanish is the second most important cultivar for canning, and is grown mainly in south-east Asian countries, especially Malaysia (Leal and Duval, 1997). The Queen group is considered superior as fresh fruit (German et al., 1992), and includes some of the world’s oldest known cultivars (Py et al., 1987). Queen has been cultivated extensively in South Africa and Australia for the fresh fruit market (Leal and Duval, 1997). The other two groups, Pernambuco and Perolera, are composed of whitefleshed varieties which are not suitable for canning or transport as fresh fruit, and so are produced solely for local consumption (Py et al., 1987). Pernambuco (also called Perola) is the main Brazilian cultivar, while Perolera is the local variety in Colombia and Venezuela due to its adaptation to high altitudes (up to 1 500 m). The varieties most commonly planted in Australia in recent years, are Smooth Cayenne clones 8, 10, 13, and 30, Champaka F-180 (Scott, 1995) and the Queen variety Golden (Wakman, 1994). Australian production consists almost entirely of Smooth Cayenne for both canning and fresh fruit markets, with Queen varieties representing only a small fraction of production (personal communication Garth Sanewski, 1997).
1.1.2
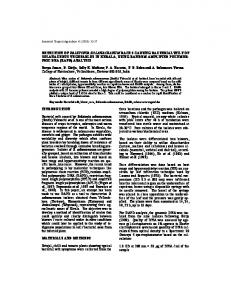
Botany The common pineapple (A. comosus) is a perennial, monocarpic herb, with each
stem flowering only once and dying after fruiting (Figure 1.1). A side shoot, called ratoon growth, then takes over to produce the next fruit. The natural flowering of 3
Chapter 1: Literature Review
Crown
Apical Meristem Central Stele Merged Bracts
Inflorescence Peduncle Slip Sucker Second Ratoon
First Ratoon
Roots
Figure 1.1: Pineapple anatomy
4
Leaves
Chapter 1: Literature Review
pineapple is unreliable, so in cultivation flowering is induced by application of ethylene-containing chemicals. The length of time from planting to fruiting varies between 6-16 months, and the resulting fruit then takes 5-6 months to ripen. Crowns are produced on top of the fruit, and continue to grow until the fruit matures. At harvest time the crowns are removed and used as future planting material. The resistance of the crown to desiccation is the reason for the wide distribution of pineapple throughout the world (German et al., 1992). Vegetative slips found beneath the fruit can also be used as planting material, and are in fact the crowns of small undeveloped fruit (Samson, 1986). Pineapple root buds are located in the axils of leaves to within 1-2 cm of the stem apex. On the lower part of the stem these buds develop into soil roots which are rarely found deeper in the soil than 90 cm. Soil roots may branch, and most of the pineapples water and nutrient absorption occurs through microscopic root hairs, which grow just behind root tips. Leaf buds further up the stem can develop into axillary roots, which are flattened structures up to 50 cm in length, wound around the leaf base, and which absorb water and nutrients in the same manner as soil roots (Sinclair, 1993). The pineapple stem is the central support structure for the plant, and consists of the larger central stele surrounded by a smaller cortex. An apical meristem is present on top of the stem, and is responsible for the formation of leaves, fruit stem, fruit and crown (Sinclair, 1993). One flower forms on the tip of each stem (Samson, 1980).
The peduncle is an
extension of the stem apex, carrying modified leaves and axillary buds, which later form slips, and the actual pineapple fruit (Sinclair, 1993). Pineapple leaves grow sequentially up the stem of the plant from the base, with 13 leaves positioned in five circuits of the base, before one leaf is observed to grow directly above another. Leaves elongate from the base and originate from meristematic leaf buds located along the length of the stem 5
Chapter 1: Literature Review
(Sinclair, 1993). The pineapple fruit is actually a fusion of many individual fleshy fruitlets termed a sorosis, with each fruitlet originating from a flower with both male and female parts (Sinclair, 1993). The edible portion is a combination of many ‘fruitlets’ plus the central stalk and so is correctly termed an inflorescence (Lent, 1998). Pineapples are usually self-sterile and seeds rarely form on the fruit in nature, although crosspollination between varieties is possible, and is commonly used to create new hybrids (Sinclair, 1993). The crown positioned on top of the fruit is simply a continuation of the parent plant’s apical meristem, and is comprised of a short starch filled stem with its own meristem and leaves (Sinclair, 1993). The crown can be used for plant propagation (Samson, 1980). Slips are best described as an imperfect fruit with an abnormally long crown. Arising from axillary buds on the fruit stalk, slips have a curved base and fruit-like knob at the point of attachment, and continue to grow while still attached to the plant. In Queensland, slips usually occur on plants which initiate flowering during winter (Sinclair, 1993). A slip develops from a new bud below the fruit. If the bud develops below the soil line it is called a sucker (Samson, 1980). Suckers develop on plants after flowering, and are the result of flower initiation causing the loss of the apical meristem’s dominance over axillary bud growth (Sinclair, 1993). Most pineapples are produced by vegetative propagation of crowns, slips or suckers. Pineapple is readily propagated by tissue culture, with plants being obtained from meristems in the apex of crowns, slips and axillary buds from crowns and stems (Py et al., 1987). Using tissue culture technology, 100 000 plants can be propagated from a single meristem in less than one year (Drew, 1980). However, there is a relatively high rate of somaclonal variation found in tissue cultured pineapple plantlets, 6
Chapter 1: Literature Review
which may be useful as source of variation for breeding, but can interfere with mass production of plants for commercial use (Py et al., 1987).
1.2
PINEAPPLE PRODUCTION INDUSTRY Pineapples are currently cultivated in all hot, wet, inter-tropical regions, which
are usually close to the equator, in low altitude areas along coastal plains. Pineapples are also grown in some areas that are climatically less suitable, to take advantage of nearby large-scale markets eg: Azores and Canary Islands near Europe; Florida and the Bahamas near the USA and Australia, South Africa and South America to cater to southern hemisphere markets (Py et al., 1987).
Current major areas of pineapple
production include Hawaii, South Africa, South and Central America, south-east Asia and Australia (German et al., 1992).
1.2.1
Pineapple Industry in Australia Pineapple was first introduced to Queensland in the 18th century, probably from
India, and has been grown here successfully ever since (Golden Circle Fact Sheet #1). In 1837 the postmaster of Moreton Bay settlement was the first producer from Brisbane to send pineapples to the Sydney market (Anon, 1904). Smooth Cayenne is the only variety of pineapple grown at commercial levels in Queensland for both the fresh fruit and canning markets. Various Smooth Cayenne clones, introduced from Hawaii, are available in Queensland, including Clone (C)8, C10, C13, C30, and Champaka F-180 (CF-180) (Scott, 1995). Currently, the Australian pineapple industry is based entirely in Queensland along the eastern seaboard from Cooktown to Brisbane (16o to 28o South latitude) (Broadley, 1993). The Queensland pineapple industry is principally centred around fruit processing, through a grower-owned cannery. Total production ranges from 145 000 to 7
Chapter 1: Literature Review
170 000 tonnes per annum, produced on over 400 family farms (Golden Circle Fact Sheet #1). The pineapple industry is one of Queenslands more valuable horticultural crops at farm gate with the gross value of production for the 1997-1998 financial year being $37.3 million. The market for fresh Australian pineapples is much smaller than the processing market, with approximately 35 000 tonnes of fruit grown for domestic and New Zealand markets.
The Australian fresh fruit industry supplies 100% of
domestic consumption (Broadley, 1993). In south-east Queensland, pineapples flower within 12-18 months of planting, with summer crops taking five months to maturity and winter crops up to seven months. Suckers produce a second or “ratoon” crop of pineapples, with the first and second crop usually constituting the commercial yield of the plant. The first ratoon crop is usually harvested after 15-18 months, with the two crop cycle taking up to 3.5 years. Pineapples used for canning have their crowns removed (before transportation), and used as planting material for the next crop. Crowns are the most commonly used planting material in Queensland, although slips, and suckers are also used (Golden Circle Fact Sheet #1).
1.3 PINEAPPLE PESTS, DISEASES AND DISORDERS Pineapple diseases can be categorised into those that affect the fruit, and those that affect the plant itself. The effects of these diseases can vary from reduction in fruit size and weight, to the death of the plant, depending upon the age of the plant when infected (Rohrbach and Schmitt, 1994).
A list of the most significant diseases,
disorders, pathogens and pests affecting Queensland pineapples is given in Table 1.1.
8
Chapter 1: Literature Review
Table 1.1: Major diseases, disorders, pathogens and pests affecting pineapple plants and fruit in Queensland
Syndrome
Common Name
Cause
Disease
Mealybug Wilt
Unknown
Disorder
Blackheart
Cool temperatures during fruit maturation and storage
Root rot
Fungi, including Phytophthora cinnamomi and Pythium spp.
Pathogens
Pests
Fruitlet rot
Fungi including Penicillium funiculosum, Fusarium moniliforme and Bacteria including Erwinia chrysanthemi Mealybugs, including Dysmicoccus brevipes, Psuedococcus longispinus
Root damage
Nematodes, including Meloidegyne spp, Rotylenchus spp, Pratylenchus spp., Helicotylenchus spp. (Evans et al., 1997; Rorbach and Apt, 1993) Most of these problems can be managed through the use of fungicides, nematicides and a variety of farm management practices. In contrast MBW remains widely distributed, especially in the Smooth Cayenne varieties (Broadley, 1993; German et al., 1992). MBW will be discussed in more detail in Chapter 1.4.
1.3.1
Viruses infecting pineapple
Tomato spotted wilt virus Tomato spotted wilt virus (TSWV), inciting yellow spot disease, causes spotting and wilt symptoms in pineapple. TSWV is transmitted by thrips (Thrips tabaci Lind.) to pineapple crowns, while slips and suckers are rarely infected (Broadley, 1993; Schlack, 1990a). Yellow spot is characterised by the formation of small round yellow spots on the upper surface of leaves of young pineapple crowns either while they are 9
Chapter 1: Literature Review
still attached to the fruit, or a few months after planting. The spots eventually fuse to form yellow streaks down the leaves, which progressively turn brown and necrotic. The virus also spreads to the heart of the plant, causing it to bend sideways towards the site of initial infection (Pegg, 1993). TSWV is always transmitted from an external source of infection, and never from pineapple to pineapple. Infection of pineapple plants is always fatal, so that no infection threat exists for forthcoming crops. Although TSWV has a very wide host range, and is often widely distributed, yellow spot of pineapple is extremely rare in Queensland (Broadley, 1993), and occurs only erratically in Hawaii (Schlack, 1990a). Pineapple chlorotic leaf streak virus Pineapple chlorotic leaf streak virus (PCLSV) particles are bacilliform in shape, and are presumed to belong to the family Rhabdoviridae. The only record of PCLSV was from a single pineapple plant, collected from the Tarauca region of Brazil, (Kitajima et al., 1975). Pineapple closterovirus PCV has been found to be widespread in cultivated pineapple, especially in Cayenne varieties, and is found in both MBW-affected and symptomless plants (German et al., 1992; Hu et al., 1996; Wakman et al., 1995). This virus(-es) will be further discussed in Section 1.6. Pineapple bacilliform virus Bacilliform virus particles were first discovered in Australian pineapples as part of a mixed infection with PCV (Wakman, 1994; Wakman et al., 1995) (Figure 1.2). PBV particles are non-enveloped, have modal dimensions of 133 nm × 33 nm and were tentatively assigned to the Badnavirus genus of Caulimoviridae on the basis of a serological relationship with Sugarcane bacilliform virus (SCBV) (Wakman et al., 1995). PBV was subsequently found in Hawaii (Hu et al. 1996). PBV was confirmed 10
Chapter 1: Literature Review
PCV
PBV
100 nm
Figure 1.2:
Electron micrograph of PCV (thread-like) and PBV (bacilliform)
particles
11
Chapter 1: Literature Review
Back page of Figure 1.2
12
Chapter 1: Literature Review
as a distinct badnavirus by Thomson et al. (1996). Thomson (1996) amplified a 448 bp fragment of genomic DNA by polymerase chain reaction (PCR), from the reverse transcriptase (RT) and ribonuclease H (RNase H) domains of PBV. No sequence variation was detected between isolates obtained from two different growing areas in Queensland. A PCR detection system developed from this sequence was specific for PBV and did not detect Banana streak virus (BSV; Thomson et al., 1996). All PCR positives were confirmed by immunosorbent electron microscopy using a polyclonal antiserum specific for PCV and PBV, produced by Wakman et al. (1995). The specificity of the PCR product was confirmed by Southern hybridisation with a digoxygenin-labelled probe (Thomson et al., 1996). A PCR-enzyme linked immunoassay (ELISA) system was developed for use in large-scale screening (Thomson, 1997). PBV was found to be present in all pineapple-growing areas of Australia. PBV was subsequently detected in seedling pineapples, tissue culture plantlets initiated from lateral buds of crowns and in mealybugs taken from PBV-infected plants.
PBV was distributed throughout the
pineapple plant, in crowns, roots, fruit and leaf tissue (Thomson et al., 1996). In attempts to obtain further sequence information, using single primer PCR, Thomson (1997) discovered the first retroelement in pineapple.
Further studies
(Thomson et al., 1998) showed there was no cross hybridisation of retrotransposon and badnavirus probes from pineapple, and no evidence could be found for the integration of this PBV sequence into the pineapple genome.
1.4
Mealybug Wilt of Pineapple MBW of pineapple was first described in Hawaii in the early 1900’s, but is now
the world’s most widely distributed pineapple disease, and one of the most severely damaging (Collins, 1960). Major epidemics have occurred in Hawaii and Florida, and
13
Chapter 1: Literature Review
still happen in Jamaica, Central America, Puerto Rico, Mauritius and Ivory Coast. MBW has also been reported in Australia, Bali, Borneo, East Africa, Fiji, India, Java, Malaysia, the Philippines, South Africa and South America (German et al., 1992). The situations surrounding MBW epidemics are complex, and may involve interactions between mealybugs, ants, virus(-es), mealybug predators and parasites, pineapple plants and possibly other plant species (German et al., 1992). Symptom expression is variable and apparently linked to environmental conditions and mealybug populations (Carter, 1932).
1.4.1
Symptoms MBW is characterised by preliminary leaf tip dieback, reddening along the leaf
length, followed by a progressive change in leaf colour from red to pink (Figure 1.3A). Leaves then flex inwards along their leaf margins, lose rigidity and ultimately collapse entirely (German et al., 1992). The effect of MBW can be devastating, with whole fields of plants killed due to the disease (Figure 1.3B). Prior to above ground symptoms, the roots cease to grow, collapse and become invaded by saprophytic organisms, causing the plant to wilt. Affected plants can be easily removed from the soil. The plant may then go through a recovery phase, during which the centre of the plant grows out with fresh apparently unaffected leaves (Carter, 1935). Apparently healthy, rapidly growing plants have been known to show symptoms earlier and in a more pronounced form than less rapidly growing plants, in a variation of MBW termed “quick wilt” (Collins, 1960). Immature plants that are affected produce either very small fruit or no fruit at all (German et al., 1992). Older, less actively growing plants tend to show symptoms more slowly over a longer period of time (Collins, 1960). Remarkably, even the worst affected plants can appear to recover, with the older symptomatic leaves senescing and younger leaves possessing brown wilted 14
Chapter 1: Literature Review
Figure 1.3A: Symptoms of MBW of pineapple on an individual plant, including leaf reddening, leaf tip dieback, retarded growth and general wilting
Figure 1.3B: The effects of MBW of pineapple on a plantation, arrows indicate areas of affected plants.
15
Chapter 1: Literature Review
Back of Figure 1.3
16
Chapter 1: Literature Review
tips. The new growth appears normal, and such a plant can produce apparently healthy fruit of marketable quality (German et al., 1992). A symptom traditionally associated with MBW disease, but which may be caused by a nutritional deficiency is called “terminal mottle” (Carter, 1963). This symptom is initially similar to that of MBW as symptomless new leaves can develop on affected plants. The oldest symptomatic leaves senesce, the youngest symptomatic leaves grow out, with only wilting at the tips, and the new growth appears normal (Carter, 1935). This symptom played a major role in the mealybug toxin hypothesis, used by Carter to explain the cause of MBW.
1.4.2
History of MBW disease MBW of pineapple was first described by field workers at the Hawaiian Sugar
Planters Association Experiment Station in 1910.
In 1912, Higgins reported that
infection seemed to be limited to a few fields, but by 1920 whole fields were being devastated by wilt. At this time it was noted that wilting began around the edges of fields, and around weedy rock piles and grassed waterways and ditches, and the disease became known as “edge-wilt” (Carter, 1932). This observation clearly indicated that the syndrome was caused by some factor moving into the field (Rohrbach et al., 1988). Illingworth (1931) was the first to suggest that mealybugs were directly involved, and that ants might be a contributing factor; he emphasised the control of mealybugs rather than ants.
Carter (1933) gathered definitive evidence of the relationship between
mealybug feeding and wilt, and subsequently described the initial invisible steps of cessation of root growth, followed by wilting of leaves (Carter 1935; Carter and Collins, 1947) In 1887, Queensland pineapple growers in the Brisbane suburbs of Nundah, Eagle Junction, Nudgee and Zillmere first reported failing plants, possibly due to MBW,
17
Chapter 1: Literature Review
and at that time growers experienced considerable losses. However, “the malady was not general in the district, and cultivations eventually became free of it” (Anon, 1904).
1.4.3
Factors involved in MBW of Pineapple The three factors traditionally associated with MBW disease are wilted plants,
mealybugs and ants. 1.4.3.1
Wilt Wilting is the most obvious symptom of MBW disease, and hence the first to be
observed in the field. Wilting of pineapple plants can be caused by climatic conditions or root damage, usually involving nematodes and / or fungi, or cessation of root growth associated with MBW (Carter 1935; Carter and Collins, 1947). Although MBW does have quite distinctive symptoms, natural senescence and abiotic stresses can also have a strong impact on the vigour of pineapples. This is especially true for winter crops, grown in subtropical areas such as Australia, which can make the recognition of plants affected by MBW difficult by above ground symptoms alone (Gonsalves, 1993). 1.4.3.2
Mealybugs The constant association of mealybugs with the symptoms of MBW disease has
given rise to its current name.
Several species of mealybugs occur on Hawaiian
pineapples, in association with protective ants (Gonsalves, 1993). Mealybugs can be either bisexual or obligately parthenogenic, and give birth to live young (Rohrbach et al., 1988). The first larval instar, known as a crawler, is mobile; and can walk some distance or be dispersed by the wind over longer distances (Jahn and Beardsley, 1991; Beardsley 1959).
The major active period for mealybugs is summer, when their
generation time is shorter. Mealybugs produce a waxy white covering during growth, which helps to prevent desiccation of the colony (Waite, 1993).
18
Chapter 1: Literature Review
There are currently four species of mealybug known to infest pineapple plants. The pink pineapple mealybug, Dysmicoccus brevipes (Cockerel) is found in all pineapple growing areas and its hosts include bromeliads, agave and grasses such as red natal grass (Rhynchelytrum repens), giant paspalum and sugarcane (Saccharum officinarum). D. brevipes are parthenogenic, with no males ever being found. Smooth Cayenne is especially susceptible to D. brevipes, while some varieties such as Red Spanish, Singapore Spanish and some wild relatives used in breeding programs, are resistant (Collins, 1968). D. brevipes was reported on pineapple crops in south east Queensland in 1901, (Williams, 1985), and now occurs in all Queensland growing areas, spreading easily via planting material (Schlack, 1990b). Dysmicoccus neobrevipes (Beardsley), the grey pineapple mealybug, has been found in Hawaii, Mariana Island, Kiribati (Beardsley 1966) and Western Samoa (Williams, 1985). D. neobrevipes reproduces bisexually and is responsible for “green spotting” of pineapple plants (Williams, 1985). Grey pineapple mealybugs are found primarily on the crown of the plant, including the fruit, while pink pineapple mealybugs are confined largely to the lower portions of the plant near or below ground level (Ito, 1938). D. neobrevipes has not been found in Australia (Williams, 1985), despite the record by Carter (1942) that ‘green spotting’ occurs on pineapples in Queensland. A third unnamed Dysmicoccus species has also been suggested, but is not yet taxonomically distinguished from D. brevipes; it is bisexual, produces green spots on pineapple and infests mainly crowns (Rohrbach et al., 1988). The females of this new species are virtually indistinguishable from D. brevipes and are only known to occur in West Africa (Ivory Coast), Madagascar, Dominican Republic, Martinque and tropical America (Nakahara, 1981). The long-tailed mealybug (Pseudococcus longispinus (Targioni-Tozzetti)) can survive well without tending by ants and can cause spotty infestations in fields 19
Chapter 1: Literature Review
where ants are under control. However, P. longispinus has many natural enemies and most populations are eliminated within a few weeks. It is one of the most common mealybugs in Australia with a very wide host range and recorded from all states except the Northern Territory (Williams, 1985). This mealybug is not as commonly associated with MBW as the pink and grey pineapple mealybugs (Rohrbach et al., 1988). 1.4.3.6
Ants Ants are only a problem in pineapple fields when associated with mealybugs as
the ants care-taking behaviour allows mealybugs to thrive and greatly increase the amount of damage done to host plants (Serrano, 1934; Carter, 1935; Nixon, 1951). Ants were thought to aid mealybug infestations of pineapples in several ways including protecting mealybugs from potential predators (Nixon, 1951), removing honey-dew to prevent build-up of sooty mould, and by carrying mealybugs to new areas (Carter, 1932; Phillips, 1934). Previously, ants were thought to move mealybugs from plant to plant, spreading MBW disease (German et al., 1992), so that the control of ants in pineapple fields would appear crucial for the control of MBW (Rohrbach et al., 1988). However, Beardsley et al. (1982) noted that although the percentage of infested pineapples correlated highly to the number of ants in pitfall traps, ants do not appear to play a major role in mealybug dispersal. The main method of mealybug dispersal appears to be the movement of crawlers by walking and by wind (German et al., 1992). Several ant species involved with pineapples have been recorded in Hawaii, while in Queensland the coastal brown ant is most commonly associated with mealybugs in pineapple fields (Broadley, 1993).
1.4.4
The Cause of MBW Two main hypotheses have been developed to explain the aetiology of MBW
disease, the “toxin hypothesis” and the “latent transmissible factor” or "virus" hypothesis. 20
Chapter 1: Literature Review
1.4.4.1
“Toxin Hypothesis” For more than 70 years MBW has been associated with mealybug feeding, and
was assumed by some authors (Carter, 1933, 1935, 1939, 1945, 1948, 1952; Carter and Collins, 1947) to be caused by mealybug toxins injected into the plant during mealybug feeding. An idea supported by the positive correlation between mealybugs and MBW disease in pineapples, especially as symptomatic plants appeared to recover from MBW symptoms following mealybug removal. This hypothesis also involved the existence of ‘positive source plants’, which included plants that had recovered from MBW, or other plants which exhibited symptoms of leaf tip dieback termed ‘terminal mottle’. Mealybugs taken from ‘positive source plants’ could sometimes induce MBW symptoms in previously symptomless pineapple plants, while mealybugs taken from other plants (including agave and grasses) did not induce MBW-symptoms (Carter, 1933, 1935, 1948; Carter and Collins, 1947). 1.4.4.2
“Latent transmissible factor” hypothesis The “latent transmissible factor” hypothesis was first proposed by Ito (1959),
who suggested that pineapple plants that had recovered from MBW and their vegetative progeny were chronically diseased, positive sources of MBW, which were infected with a virus. Ito (1959) explained ‘terminal mottle’ as a leaf dieback symptom of chronically diseased pineapples, and that such symptoms did not occur on healthy plants. Ito (1962) later showed that plants which recovered from MBW exhibited acquired immunity, a phenomenon concomitant with plant virus disease. Thirty years after proposing a mealybug toxin as the cause of MBW, Carter (1963) altered his hypothesis to include a latent transmissible factor (perhaps viral) that caused MBW disease in conjunction with a mealybug salivary toxin. Positive source plants may contain a latent virus and this transmissible factor would aid the mealybug
21
Chapter 1: Literature Review
toxic secretions to induce wilt. No virus was isolated from pineapple tissue until the 1980s (Gunasinghe and German, 1986). It is most likely that “terminal mottle” is a symptom of chronic MBW, but can also be induced, in combination with generally low plant vigour (caused by poor cultural practices and nutritional deficiencies), by nematode damage, drought, and nutrient deficiencies (Rohrbach et al., 1988). 1.4.4.3
A transmissible “virus” from India MBW disease was first reported in India by Singh and Shastry (1974), who
suggested that mealybugs could acquire a “virus” from wilted plants. No conclusive evidence of virus infection was produced, with diagnosis based on feeding experiments using D. brevipes as vectors.
Singh and Shastry (1974), believed the ability of
D. brevipes to transfer MBW symptoms from affected plants to previously symptomless plants was indicative of a mealybug transmitted “virus” present in pineapple. They also suggested that the recovery exhibited by MBW-affected pineapple suckers after hot water treatment (HWT) at 50oC for 1 h, implied the inactivation of virus particles. 1.4.4.4
“Mild strain virus” Hypothesis Earlier publications suggested that apparent ‘resistance’ seen in Smooth
Cayenne cultivars may be due to the “plants inheriting infection from their parents” (Ito, 1959 and 1962).
Ito (1959) suggested that mild strains may be present in some
pineapples in the field, while mealybugs transmitted the severe strain.
Another
possibility is that vegetative propagation would result in selection and retention of asymptomatic planting material infected by mild strains (German et al., 1992). Perhaps some plants could be infected with a severe strain, but be asymptomatic as a result of cross protection with a resident mild strain. In general, not all mild strains protect against all severe strains. Perhaps severe strains exist in alternative hosts and are brought into the field to result in severe MBW outbreaks (German et al., 1992). 22
Chapter 1: Literature Review
1.4.4.5
Which virus is it? Since 1986, when virus particles were first detected in pineapple, the question of
MBW’s causal agent has changed from “Is it a virus?” to “Which virus (or viruses) is it?” The roles, if any, of other factors in MBW disease are yet to be determined, but at this time recent work indicates that more than one factor is involved. Pineapple closteroviruses (PCV) Closteroviruses were first detected in Hawaiian pineapples by Gunasinghe and German (1986), who extracted three dsRNA bands, and thread-like virions from MBWaffected plants. Subsequently, pineapple closteroviruses were also detected in Australia (Wakman et al.,1995; Wakman, 1994). A number of different virus-specific antisera have been prepared, and used in a variety of diagnostic assays, including immunosorbent electron microscopy (ISEM), ELISA and tissue blot immunoassay (TBIA) (Gunasinghe and German, 1987, 1989; Hu et al., 1993, 1996, 1997; Wakman et al.,1995). However, the most frustrating part of all these efforts was that no definite link between the closterovirus-like particles detected in pineapple and MBW disease has been established, even though mealybugs (D. brevipes and D. neobrevipes) have been demonstrated to transmit Hawaiian closteroviruses (Sether and Hu, 1997; Sether et al., 1998). Pineapple closterovirus research is discussed in more detail in Chapter 1.6. Pineapple bacilliform virus (PBV) Although PBV was detected in both pineapple plants and mealybugs by Thomson et al. (1996), no definite link to MBW was established, as PBV was found to be present in all pineapples regardless of symptoms. So far, no PBV-free pineapples have been found, and the effects of this virus on pineapple, if any, remain unknown.
23
Chapter 1: Literature Review
1.4.5
Control of MBW MBW has previously been controlled with chlorinated hydrocarbon pesticides
directed against ants, and roguing of affected plants (Collins, 1960). Most of these pesticides are now illegal due to negative environmental impacts, and effective roguing is difficult as some plants seem to recover from infection, and not all plants develop the same symptoms. The combination of these factors has lead to the re-emergence of MBW as a major problem (Rohrbach et al., 1988). Breeding for Resistance Carter and Collins (1947) were the first to suggest breeding for resistance was the most effective and economical method of controlling MBW.
Several Smooth
Cayenne clones were shown to be MBW resistant, with resistance transmitted to progeny through seed (Carter and Collins, 1947). Perola varieties were also reported to be tolerant to MBW (Leal and Duval, 1997). However, breeding and selection for MBW resistance was not vigorously pursued because it offered only partial resistance and it would have complicated an already complex breeding program (Rohrbach et al., 1988). So 45 years later, there is still no resistant variety available (Gonsalves, 1993). Control of Mealybugs Traditional methods for the control of MBW disease were focused on maintaining mealybug-free fields (Gonsalves, 1993). Direct control of mealybugs was found to be very effective using a variety of chemical sprays, including dichlorodiphenyl-trichloroethane (DDT) (Rohrbach et al., 1988) and organophosphate insecticides, until they became deregistered (Gonsalves, 1993). Several attempts to introduce natural enemies of mealybugs were made, but none had any success without the simultaneous use of ant control measures. The major predators of ants are other ants, and as all ant species nurse and support mealybugs, there is no advantage in having one species over another (Rohrbach et al., 1988). 24
Chapter 1: Literature Review
Control of Ants Originally physical methods were used to restrict ant movements within fields, including ant fences, borders or guard beds and the removal of the weed plants whose seeds provided the ants main food source.
Modern control measures (usually
pesticides) continue to be directed against ants, as when mealybug predators and parasites are present, and ants are under control, MBW is not usually a problem (Rohrbach et al., 1988). 1.4.5.2
Control measures currently used in Australia With the incidence of MBW field infection reported at up to 60% (Glennie
et al., 1980), the control of this disease in Queensland is of obvious importance. The main method of mealybug control is a chemical spray program, mainly diazinon and chlorpyrifos. Key periods for spraying are before fruit harvest to ensure good planting material, at planting and during growth, timed to peak mealybug infestations. A typical spray program for south east Queensland is January, May, September and January (Broadley, 1993). Unfortunately, effective and environmentally safe chemicals with long-term effects are not currently available, increasing the importance of farm management methods (Broadley, 1993). Fields are fumigated and soil well prepared before planting, potential ant nesting sites are removed and fields kept free of weeds. Soil is also thoroughly prepared, to avoid the growth of volunteer plants (from undecomposed pineapple stems), which can be a serious source of wilt. In most fields, affected pineapple plants are the predominant source of MBW problems, therefore good planting material with a low incidence of disease is vital. Any plants showing symptoms are destroyed straight away, as recovered plants can become an invisible source of MBW. Badly affected crops are destroyed immediately (Broadley, 1993).
25
Chapter 1: Literature Review
1.5
CLOSTEROVIRUSES The name closterovirus is derived from the Greek “kloster” (κλωστερ, meaning
spindle or thread), and describes a group of positive-sense single-stranded RNA plant viruses, with flexuous filamentous particles (Bar-Joseph and Hull, 1974; Bar-Joseph and Murant, 1982; Murphy et al., 1995). Closteroviruses were first separated from other filamentous viruses on the basis of their virion’s greater flexibility (the most flexible of the elongated RNA viruses) and characteristic thread-like structure (Dolja et al., 1994).
1.5.1
Taxonomy The family Closteroviridae belongs to the order Nidovirales (Pringle, 1998), and
it includes two genera; Crinivirus representing the bipartite, whitefly-transmitted viruses like Beet pseudoyellows virus (BPYV) and Lettuce infectious yellows virus (LIYV) (Wisler et al., 1998); and Closterovirus comprising monopartite species (Pringle, 1997). Beet yellows virus (BYV) is the type species for the closterovirus genus, which also contains three tentative species groupings based on insect vector (Table 1.4). Table 1.4:
Tentative species groupings within the Genus Closterovirus
Vector
Species Citrus tristeza virus (CTV
(1) Aphid Heracleum virus-6 (HV-6) Grapevine leafroll associated virus-3 (GLRaV3) (2) Mealybug
Pineapple mealybug wilt associated virus (PMWaV) Sugarcane mild mosaic virus (SMMV)
(3) Unknown (Murphy et al., 1995) 26
Grapevine leafroll associated viruses 1,2,4 & 5
Chapter 1: Literature Review
1.5.2
Symptoms Closterovirus infections tend to result in fairly distinct symptoms, which in
herbaceous species include yellowing, veinal necrosis and leafrolling, while in woody species seedling yellows, stem-pitting and dieback are typical (Bar-Joseph et al., 1979; Milne, 1988). Closteroviruses cause systemic infections, but the virions are usually limited to the phloem (Murphy et al., 1995). The anatomical effects of closterovirus infections on host plants consist of necrosis reactions caused by organelle degeneration, and the swelling and accumulation of osmiophilic globules, protein and phytoferritin (Bar-Joseph et al., 1995).
1.5.3
Host range and distribution The host range of different closterovirus species can vary markedly, with BYV
infecting over 100 species in 15 families in experimental inoculation tests (Duffus, 1973). However, the natural host range of most closteroviruses tends to vary from moderate to narrow (Agranovsky, 1996).
Closteroviruses vary greatly in their
geographical distribution and abundance.
BYV, CTV and Grapevine leafroll-
associated viruses (GLRaVs) are distributed worldwide, while most other closteroviruses have been reported to have only limited distribution (Bar-Joseph et al., 1995). Most closteroviruses occur in temperate regions (Murphy et al., 1995).
1.5.4
Particle morphology Closterovirus particles are typically between 1200-2200 nm in length, and
ca. 12 nm in width (Murphy et al., 1995).
Closterovirus particles exhibit distinct
crossbanding (Francki et al., 1991) and have a helical symmetry. Virions have a pitch of 3.4-3.8 nm and possess ca. 10 protein subunits per turn of the helix (Murphy et al., 1995). A central ‘hole’ of 3-4 nm has been observed in both BYV and CTV particles (Dolja et al., 1994). 27
Chapter 1: Literature Review
The pronounced flexibility of closteroviruses is due to an unusually low ratio of RNA mass to the modal length of the virion, ie: 2800-3400 /nm compared to 4000 /nm for potexviruses, carlaviruses and potyviruses, and more than 6600 /nm for Tobacco mosaic virus (TMV). However, the overall RNA content in closteroviruses is the same as in other filamentous virus particles (ie: ca. 5 %), indicating that the packing of RNA is looser than in other elongated viruses (Dolja et al., 1994).
1.5.5
Genome structure Closteroviruses possess a single molecule of linear, positive-sense, single-
stranded RNA, with genome size related to the particle size of each species. The genomes of some closteroviruses have been completely sequenced, including BYV which is 15.5 kb in size (Murphy et al., 1995). Closterovirus genomes are composed of four modules (Figure 5.6). The core module, which is conserved throughout the alphavirus supergroup, includes the key domains of RNA replication, ie putative methyl-transferase (MET), helicase (HEL) and RNA-dependent RNA polymerase (POL) (Dolja et al., 1994). The other three modules are all unique to closteroviruses.
The upstream
accessory module consists of the leader protein (Pap-PRO) and a putative aphid transmission factor. The chaperone module, which is separated from the core by an intergenic spacer contains three open reading frames, which code for a small hydrophobic protein, HSP70 homologue and ca. 60 kDa protein. The proteins encoded by this region may potentiate virus movement, virion assembly and control other aspects of virus reproduction. The fourth module contains genes for the capsid protein and duplicate, and perhaps some additional 3’ open reading frames. Closterovirus genomes also have a 0/+1 configuration leading to a (+1) ribosomal frameshift involved in their translation strategy. This is of particular note as most other plant viruses (with ribosomal frameshifts) have a 0/-1 configuration (Dolja et al., 1994). 28
Chapter 1: Literature Review
1.5.6
Proteins Virions consist of single RNA molecules coated by capsid protein subunits
usually 22-28 kDa, with the exception of GLRaV-3, Grapevine leafroll-associated virus-1 (GLRaV-1) and Little cherry virus (LChV), where the capsid proteins are ca. 40 kDa (Agranovsky, 1996). BYV particles contain two serologically distinct structural proteins; a 22 kDa coat protein which comprises the main part of the particle, and a distinct tail composed of multiple subunits of a minor (24 kDa) coat protein. The tails seem to show a propensity to break off during virus particle preparation and purification (Agranovsky, 1996). It is likely, that all closteroviruses have a similar particle structure, as all group members (for which coat protein information is available) have diverged duplicate copies of their coat protein (Boyko et al., 1992).
1.5.7
Serology Only
limited
serological
relationships
have
been
detected
amongst
closteroviruses. Relationships have been established between BYV, Carnation necrotic fleck virus (CNFV) and more distantly Wheat yellow leaf virus (WYLV; Inouye, 1976). CTV shows a great deal of biological and serological diversity, and monoclonal antibodies have delineated several unique epitopes (Whiteside et al., 1988).
1.5.8
Transmission Seed transmission of closteroviruses is very rare, and mechanical transmission
of a few species is possible with great difficulty. Infected propagating material is the main source of dissemination in vegetatively propagated crops, while insects such as aphids, whiteflies and mealybugs are natural vectors (Murphy et al., 1995). Aphid-transmitted closteroviruses are transmitted semi-persistently, which implies a stricter virus-vector specificity than the non-persistent aphid transmission of 29
Chapter 1: Literature Review
potyviruses (Falk and Duffus, 1988). There are currently four closteroviruses known to be transmitted by mealybugs. GLRaV-3 is transmitted by Pulvinaria vitis (Belli et al., 1994), SMMV is transmitted by Saccharicoccus sacchari (Lockhart et al., 1992), LChV is transmitted by Phenacoccus acerus (Raine et al., 1986) and PMWaV1 and PMWaV2 are transmitted by pink and grey pineapple mealybugs (Sether et al., 1998).
1.5.9
Mixed infections involving closteroviruses
Grapevine leafroll-associated virus-3 (GLRaV-3) Grapevine leafroll disease is one of the most important and widely distributed diseases of grapevine worldwide, with infected vines sensitive to environmental stresses and crop reductions of up to 80% (Bar-Joseph et al., 1995). Typical symptoms of grapevine leafroll include the downward rolling and interveinal chlorosis of lower leaves in mid-summer, followed by leaf laminae of dark fruit varieties turning red, while the major veins remain green. Grapevine leafroll disease is not lethal, but causes erratic bearing, lowered sugar content and delayed fruit ripening (Bar-Joseph et al., 1995). Several closteroviruses have been associated with the disease, which is grafttransmissible.
Data clearly indicate a consistent association between one or more
GLRaVs and leafroll-affected grapevines. GLRaV-3 is serologically unrelated to both GLRaV-1 and Grapevine leafroll-associated virus-2 (GLRaV-2), and has particles 1800-1900 nm in length and 12 nm in width. GLRaV particles are present in highest numbers in symptomatic older leaves, with different symptoms being observed in plants containing different mixes of GLRaV’s (Bar-Joseph et al., 1995). Sugarcane mild mosaic virus (SMMV) SMMV particles are 1500-1600 nm × 12 nm and are mechanically transmissible, as well as being transmitted by the mealybug Saccharicoccus sacchari. Other hosts of
30
Chapter 1: Literature Review
SMMV include rice (Oryza sativa), Sorghum halepense and S. bicolor. SMMV was shown to be serologically unrelated to Grapevine virus A (GVA) and PCV. SMMV is associated with striate mosaic symptoms on leaves, slows growth causing leaves to be abnormally narrow, and is often associated with SCBV (Lockhart et al., 1992).
1.6
PINEAPPLE CLOSTEROVIRUS The presence of viruses in pineapple was first indicated by the extraction of
dsRNA from MBW-affected plants in Hawaii (Gunasinghe and German, 1986). Further examination revealed long flexuous “closterovirus-like” particles (Gunasinghe and German, 1987, 1989), which have subsequently been referred to as pineapple closterovirus (PCV) (German et al., 1992). Closterovirus particles were detected in Australian pineapples and found to be serologically related to PCV from Hawaii (Wakman et al., 1993, 1995). Closterovirus particles serologically unrelated to PCV were also detected in pineapples in Australia (Wakman et al., 1995) and Hawaii (Hu et al., 1996).
In Australia, closterovirus
particles decorated by PCV-specific antiserum were referred to as PCV-A, and particles not decorated by PCV-specific antiserum referred to as PCV-B (Wakman et al., 1995). Morphologically similar “closterovirus-like” particles were identified in both apparently healthy and MBW diseased plants from around the world (Table 1.5). The discovery of PCV (and later PBV) was a major breakthrough in MBW research. Finally, it seemed that the “latent transmissible factor” had been found. However, even though the characterisation of these viruses has been the subject of intense research in recent years, no definite link between the symptoms of MBW disease and PCV (or PBV) infection has yet been established.
31
Chapter 1: Literature Review
Table 1.5: Countries in which “Closterovirus-like” particles have been detected in pineapple
Country Australia Brazil Colombia
Wakman et al., 1995 Wakman et al., 1995; Hu et al., 1996 Hu et al., 1996
Cuba
Borroto et al., 1998
France
Wakman et al., 1995
Guatemala
Hu et al., 1996
India
Hu et al., 1996
Indonesia
Hu et al., 1996
Jamaica
Hu et al., 1996
Malaysia
Wakman et al., 1995
Mexico
Hu et al., 1996
Panama
Hu et al., 1996
Paraguay
Hu et al., 1996
Philippines
Hu et al., 1996
Singapore
Hu et al., 1996
South Africa Sri Lanka Taiwan Thailand USA (Hawaii) Venezuela
1.6.1
Reference
personal communication Gerhard Petersen, Dassanayake et al., 1994 Wakman et al., 1995; Hu et al., 1996 Hu et al., 1996 Gunasinge and German, 1986; Wakman et al., 1995; Hu et al., 1996 Hu et al., 1996
Western Samoa
Hu et al., 1996
Zaire
Hu et al., 1996
Nomenclature Closterovirus-like particles found in pineapples throughout the world have been
given various names at various times. When first discovered in Hawaii, these particles were referred to as “clostero-like pineapple virus” in conference abstracts by Ullman 32
Chapter 1: Literature Review
(1989) and German (1989). In other publications that year, the virus was described as “closterovirus–like particles associated with MBW of pineapple” (Ullman et al.,1989) and tentatively assigned to the group II closteroviruses by Gunasinghe and German (1989). In conference abstracts, Hawaiian workers referred to the virus as pineapple closterovirus, abbreviated as PC (Hu et al.,1993; Ullman et al.,1993) or PCV as in German et al. (1992). Subsequent papers published by Hawaiian researchers have referred to the virus as PCV. Coffin and Coutts (1993) published a short review in which they refer to the pineapple closterovirus of Gunasinghe and German (1989) as “pineapple MBW-associated virus”, with no abbreviation given. In Australia, the virus was initially termed pineapple closterovirus (PCV). This grouping was subdivided by Wakman (1994) with the detection of two serologically different closteroviruses. Closterovirus particles which were decorated by Wakman’s PCV antiserum were called PCV-A and closterovirus particles which were not decorated by this antiserum were termed PCV-B. This nomenclature was continued in Wakman et al. (1995), and in conference abstracts submitted by the group (Thomas et al., 1994; Wakman et al., 1996; Thomas et al., 1996). In Sri Lanka, closterovirus particles found in pineapple were referred to as pineapple wilt virus (PWV), even though these particles were detected using an ELISA system based on Wakman (1994) PCV antiserum (Dassanayake et al.,1994).
Bar-
Joseph et al. (1995) refer to the closterovirus found in Hawaiian pineapples as “pineapple wilt (mealybug transmitted) virus” (PWmtV), and they cite Gunasinghe and German (1989) and Ullman et al. (1991) as references. In 1997 the name used to describe pineapple closteroviruses in Australia was changed to pineapple MBW-associated virus (PMWaV) by Thomson (1997), Horlock et al. (1997) and Thomas et al. (1998).
Results presented later in this thesis will
indicate that the relationship between the PMWaV viruses described by the Hawaiians 33
Chapter 1: Literature Review
and the PCV’s detected by Wakman’s PCV PAs antisera is not clear.
PMWaV2
appears to comprise part of the PCV-A serotype, but not all of it. It is uncertain how many other PMWaV types may be a part of the PCV-A serogroup. So as not to cause confusion closterovirus particles detected in pineapples in this thesis will be referred to as PCV.
1.6.2
Particle morphology PCV particles purified from Hawaiian pineapples, were shown to have a modal
length of 1200 nm × 12 nm, with an open helical structure (German et al., 1992). Unpurified Australian PCV particles had modal dimensions of 1800 nm × 12 nm. Particles extracted from Cuban pineapples affected by MBW, were described as being 1200-1450 nm in length × 12 nm wide, when partially purified, using the method of Gunasinghe and German (1989), and observed in an electron microscope (Borroto et al., 1998). The differences in PCV particle lengths may be explained by the fact that Hawaiian and Cuban measurements were determined from purified particles, increasing the chances of breakage, while Australian particles were measured from leaf sap preparations (Wakman, 1994).
1.6.3
Molecular information PCV is a positive-sense single-stranded RNA plant virus (German et al., 1992).
Hawaiian PCV has a coat protein of 23.8 kDa (German et al., 1992) and gives rise to a reproducible dsRNA banding pattern, with the most consistent band at 8.35 × 10³ kDa (Gunasinghe and German, 1989).
Gonsalves (1993) consistently isolated dsRNA
species of 75% full length) particles per electron microscope grid square (Chapter 4.2.3.1), all particle counts are means ± standard deviation, with n = 4. 79
Chapter 3: Virus Purification
Based on this trial some buffers were used in a second trial to extract virus from pineapple leaf powder, including 0.5 M potassium phosphate pH 8.0, 4% (v/v) Triton X-100, 0.5% (w/v) Na2SO3. As shown in Table 3.4, the most effective buffers were that of Wakman et al. (1995) and the potassium phosphate buffer. All of the buffers trialed yielded virus extracts containing both PCV and PBV particles.
Table 3.4: A Comparison of Published Virus Extraction Buffers for use with PCVinfected Pineapple – Experiment 2
Average Number of PCV Particles*
Virus
Buffer
Reference
PCV
0.5M Tris-HCl pH 8.0, 0.5% (w/v) Na2SO3, 4% (v/v) Triton X-100
Wakman, 1994
142.75
±
23.28
PRSV
0.5M potassium phosphate pH 7.0, 0.01M EDTA, 0.1% (w/v) Na2SO3
Gonsalves and Ishii, 1980
30.75
±
2.85
Zee et al., 1987
50.25
±
7.75
0.5M Tris-HCl, pH 8.0, 0.02 M GLRaV Na2SO3, 4% (w/v) PVP, 0.5% (w/v) bentonite, 5% (v/v)Triton-X 100 BYV
0.1M ammonium acetate pH 7.0, 0.01M EDTA, 0.1% (v/v) 2mercaptoethanol
Kassanis et al. (1977)
2.00
±
1.63
SPSVV
0.5M borate pH 8.0, 0.1M EDTA, 0.5M urea, 0.01M Na2SO3
Cohen et al., 1992
19.75
±
3.43
PCV
0.5M potassium phosphate pH 8.0, 4% Triton X-100, 0.5% (w/v) Na2SO3
This Study (Chapter 3.4.2.7)
176.00
±
17.82
All virus extracts also contained PBV particles. Virus acronyms are listed in Table 3.3. *Number of (>75% full length) particles per electron microscope grid square (Chapter 4.2.3.1), all particle counts are means ± standard deviation, with n = 4. 3.4.2.3
Testing different salt solutions As none of the extraction buffers used for other viruses were found to be more
successful at extracting PCV than that of Wakman et al. (1995), it was decided to trial
80
Chapter 3: Virus Purification
each component of the extraction buffer separately. To achieve this, eight different salt solutions were assessed for their ability to extract PCV particles from pineapple leaf powder. All buffers used were prepared as 0.5 M, pH 8.0, solutions containing 0.5 % (w/v) Na2SO3. The potassium phosphate buffer yielded the highest number of PCV particles of the eight salts used (Table 3.5), and was considerably better than Tris-HCl used by Wakman et al. (1995).
All virus preparations contained similar numbers of PBV
particles (data not shown) and host tissue contamination.
Table 3.5: Comparison of Salt Solutions for PCV Extraction Buffer
Salt Solution*
PCV Particles# 116.5
±
12.5
Tris-HCl
38.5
±
6.5
Borate
91.5
±
6.5
Sodium acetate
88.0
±
5.0
Ammonium acetate
82.0
±
7.0
Sodium citrate
69.5
±
2.5
Glycine
55.5
±
8.5
Carbonate
66.5
±
0.5
Potassium phosphate
All preparations contained PBV particles *All buffers were 0.5 M, pH 8.0 and contained 0.5% (w/v) Na2SO3 # Number of (>75% full length) particles per electron microscope grid square (Chapter 4.2.3.1), all particle counts are means ± standard deviation, with n = 4. 3.4.2.4
Testing the pH of the extraction buffer As many viruses are stable over only a narrow pH range (Matthews, 1991), it is
important to optimise extraction buffer pH. Potassium phosphate and Tris-HCl buffers, prepared as 0.5 M solutions, containing 0.5% (w/v) Na2SO3, at pH 7-9 were used to extract PCV. The highest number of virions was observed at pH 7.5-8 for both buffers, 81
Chapter 3: Virus Purification
with potassium phosphate yielding slightly more particles than Tris-HCl (Table 3.6). Potassium phosphate, pH 8.0 was selected for future use, because although PCV particle numbers were very similar at pH 7.5 and pH 8.0, PCV particles in the higher pH buffer appeared to be in better condition (data not shown).
Table 3.6: Effect of pH of Tris-HCl and Potassium Phosphate buffers ability to extract PCV particles
Buffer
pH
PCV Particles*
Tris-HCl
9.0
144.0
±
11.0
Tris-HCl
8.0
156.0
±
12.0
Potassium phosphate
8.5
44.5
±
5.5
Potassium phosphate
8.0
160.5
±
14.5
Potassium phosphate
7.5
162.0
±
5.0
Potassium phosphate
7.0
114.5
±
2.5
PBV particles were observed in all preparations All buffers were prepared as 0.5 M solutions containing 0.5% (w/v) Na2SO3. * Number of (>75% full length) particles per electron microscope grid square (Chapter 4.2.3.1), all particle counts are means ± standard deviation, with n = 4. 3.4.2.5
Testing the salt concentration of the extraction buffer Potassium phosphate and Tris-HCl buffers of varying concentrations
(0.02-0.5 M) prepared as pH 8.0 solutions, containing 0.5% (w/v) Na2SO3, were used to extract PCV (Table 3.7), using the standard method. Over 10× more PCV particles were found in potassium phosphate solution at 0.5 M than 0.02 M. The Tris-HCl buffer also yielded more PCV particles at higher molarities. In this experiment there was little difference between potassium phosphate and Tris-HCl buffers in the number of PCV particles observed, however virus particles 82
Chapter 3: Virus Purification
from the potassium phosphate extract were slightly longer (data not shown) and more intact than those in Tris-HCl. Therefore 0.5 M potassium phosphate pH 8.0 was chosen as the basis of a new extraction buffer for PCV.
Table 3.7: Comparison of Salt Concentrations for use in the Extraction of PCV from Pineapple Leaf Tissue.
Salt
Concentration (M)
PCV Particles*
0.5
69.0
±
9.0
0.1
48.0
±
6.0
0.02
4.5
±
0.5
0.5
57.0
±
0.0
0.1
47.5
±
3.5
0.02
21.5
±
3.5
Potassium phosphate pH 8, 0.5% (w/v) Na2SO3
Tris-HCl pH 8, 0.5% (w/v) Na2SO3
*Number of (>75% full length) particles per electron microscope grid square (Chapter 4.2.3.1), all particle counts are means ± standard deviation, with n = 4. 3.4.2.6
Testing different additives to the extraction buffer A variety of additives are often included in extraction buffers to increase the
number of virus particles released from tissue, to protect virions from degradation or to reduce the negative effects of plant components. Reducing agents such as Na2SO3 and 2-mercaptoethanol can reduce loss of infectivity due to virus particle contact with the products of plant extract oxidation, and by reducing adsorption of host constituents to the virus (Matthews, 1991). Triton X-100 and other non-ionic detergents assist in the initial clarification by dissociating cellular membranes (which could contaminate or occlude virus particles), solubilizing lipid containing cell membranes, pigments and 83
Chapter 3: Virus Purification
organelles and / or liberating virus particles trapped in host material (Bar-Joseph et al., 1995). A range of extraction buffer additives used in other virus purification protocols, were assessed in 0.5 M potassium phosphate buffer, pH 8 with 0.5% (w/v) Na2SO3 in the standard method to improve virus yield. Triton X-100 was the best additive, as it significantly improved the number of PCV particles (Table 3.8). 2-mercaptoethanol also provided an increase in the number of virus particles, but due to its volatile and hazardous nature it was decided not to include the chemical in routine extractions. However, 2-mercaptoethanol was used as a preservative, if virus preparations were stored overnight in extraction buffer.
Table 3.8: Comparison of the Effect of Various Buffer Additives on PCV Extraction
Buffer
Additive
0.5 M Tris-HCl, pH 8.0, 0.5% (w/v) Na2SO3
None
25.3
±
13.3
None
84.3
±
1.8
4% (v/v) Triton X-100
190.5
±
12.3
0.5% (v/v) 2mercaptoethanol
118.0
±
18.4
0.01 M EDTA
54.3
±
16.7
0.05 M Urea
45.3
±
19.5
4% (w/v) PVP
26.5
±
13.3
0.01 M MgCl2
42.0
±
10.9
0.5 M Potassium phosphate pH 8.0, 0.5% (w/v) Na2SO3.
PCV Particles*
All preparations also contained PBV particles *Number of (>75% full length) particles per electron microscope grid square (Chapter 4.2.3.1), all particle counts are means ± standard deviation, with n = 4. 84
Chapter 3: Virus Purification
3.4.2.7
Summary of extraction buffer trials The initial testing of 12 extraction buffers used in the purification of a variety of
viruses showed that potassium phosphate buffer was marginally more effective than WEB, and at least 4× more effective than any of the others (Tables 3.2 & 3.3). The most efficient buffer for the extraction of PCV from pineapple leaf tissue was 0.5 M potassium phosphate, pH 8.0, containing 4% (v/v) Triton X-100 and 0.5% (w/v) Na2SO3 (Table 3.8). PBV particles were always present in the extracts using any of the buffers trialed.
The only reductions in PBV particle numbers were also
accompanied by similar reductions in PCV particle numbers (data not shown).
3.4.3
Clarification of Pineapple Virus Extracts Crude virus extracts contain a variety of plant cell constituents in the same
general size and / or density range as virus particles.
These constituents include
ribosomes, 19S (fraction I) protein from chloroplasts (which has a tendency to aggregate), phytoferritin, membrane fragments as well as fragments of broken and whole chloroplasts. Other contaminants present in the suspension at this time are unbroken cells, all the smaller soluble proteins of the cell and low-molecular weight solutes (Matthews, 1991). The clarification step is designed to remove as much macromolecular host material as possible, while leaving the virus in solution (Matthews, 1991). Various clarification steps from established virus purification protocols were used to clarify PCV virus preparations. These were produced using the standard method previously described (Chapter 3.4.2.1), scaled up to use 7 g of powdered pineapple leaf tissue and the new Horlock extraction buffer developed in this study (HEB: 0.5 M potassium phosphate, pH 8.0; 4% (v/v) Triton X-100; 0.5% (w/v) Na2SO3).
All final virus
suspensions were diluted to equivalent volumes with WRB prior to virus particle
85
Chapter 3: Virus Purification
counting by ISEM (Chapter 4.2.3.1). Host tissue contamination was usually assessed by eye. The exact technique for each clarification is presented below, and PCV particle counts in Table 3.9. All steps were carried out at 5oC, unless otherwise stated.
Table 3.9: Comparison of Methods to Clarify Pineapple Extracts
Method
PCV Particles*
No clarification
0.5
±
0.4
Sucrose cushion
8.8
±
1.7
PEG precipitation
0.0
±
0.0
Charcoal / bentonite
0.5
±
0.4
Chloroform
0.3
±
0.4
Butanol
3.0
±
1.8
Chloroform : Butanol
0.0
±
0.0
All preparations contained PBV particles. * Number of (>75% full length) particles per electron microscope grid square (Chapter 4.2.3.1), all particle counts are means ± standard deviation, with n = 4. 3.4.3.1
No treatment This method was performed as a point of comparison by which to assess the
other treatments. The filtrate was allowed to stand overnight, and was centrifuged at 11 600 g (microfuge) for 3 min and the supernatant used as the final virus suspension. 3.4.3.2
Sucrose cushion The filtrate was centrifuged for 10 min at 10 000 g (Sorvall SS-34 rotor), and the
supernatant layered over a 20% (w/v) sucrose cushion made in HEB. Sucrose cushions were centrifuged for 3 h at 80 000 g (Beckman 30 Ti rotor). Pellets were resuspended overnight in 500 µl of WRB, and centrifuged at 11 600 g (microfuge) for 3 min with the 86
Chapter 3: Virus Purification
supernatant retained as the final virus suspension. This was by far the most successful method of clarifying PCV particles from pineapple leaf extracts, and was 3-4× more effective than any of the other methods, and 6-12× more effective than no clarification. The purity of this preparation was also significantly higher, with substatntially less host tissue contamination than any of the other methods containing PCV particles. 3.4.3.3
PEG precipitation Plant viruses can be selectively precipitated using PEG, however, some host
DNA is also precipitated. The exact conditions for virus precipitation depend on pH, ionic strength, concentration, size and structure of macromolecules. PEG precipitation can be used with many viruses, even ones with fragile virions, though it can cause problems with filamentous particles, which can become very difficult to resuspend (Matthews, 1991). NaCl (to 0.2 M) and PEG 6000 (to 6% w/v) were added to the filtrate and the suspension stirred gently on ice for 90 min. The mixture was then centrifuged for 20 min at 12 000 g (Sorvall SS-34 rotor), and the pellets resuspended overnight in 7 ml of WRB. Resuspended pellets were centrifuged at 11 600 g (microfuge) for 3 min, and the supernatant retained as the final virus suspension. PEG precipitation worked well in that PCV particles were concentrated from the extraction buffer, however, they were extremely difficult to resuspend. When PEG pellets were observed in the electron microscope (Chapter 2.3.1), PCV particles were found in large clumps, wrapped tightly around one another. Although the final resuspended pellet contained no PCV particles this preparation was very clean, containing almost no host tissue contaminants.
PBV
particles present in the resuspended pellets were in good condition, but not in high numbers. 87
Chapter 3: Virus Purification
3.4.3.4
Charcoal / Bentonite Activated charcoal (2% w/v) was added to the filtrate and the suspension stirred
for 35 min at room temperature, then centrifuged at 8 000 g (Sorvall SS-34 rotor) for 10 min, and the pellet discarded. Bentonite (to 70 mg/ml) was added to the supernatant and stirred for 20 min at room temperature. This mixture was centrifuged at 8 000 g (Sorvall SS-34 rotor) for 10 min, the pellet discarded, and the supernatant retained overnight. The supernatant was centrifuged at 11 600 g (microfuge) for 3 min, and the final supernatant retained as the final virus suspension. Although this method did greatly reduce the amount of contaminating host tissues, it did not yield as many PCV particles as the sucrose cushion, and contained similar virion numbers to that of no clarification. 3.4.3.5
Chloroform Organic solvents precipitate or denature host components after emulsification
with host extracts, and separate into two phases after centrifugation, with virions in the aqueous phase (top), denatured protein at the interface, and lipids and pigments in the lower organic phase. The particles of some viruses are unstable in certain organic solvents. However, chloroform by itself is gentler than chloroform and butanol together (Matthews, 1991). The filtrate was emulsified with an equal volume of chloroform (14 ml) and centrifuged at 8 000 g (Sorvall SS-34 rotor) for 10 min.
The aqueous phase was
retained, and shaken with a further 14 ml of chloroform and centrifuged again at 8 000 g (Sorvall SS-34 rotor) for 10 min. The aqueous phase was stored overnight, and used as the final virus suspension. A few particle pieces were observed in the chloroform clarified preparation, but no full length PCV virions were found.
These fragmented pieces would seem to
indicate that the chloroform had disrupted PCV particles. 88
The level of host
Chapter 3: Virus Purification
contamination was moderate, roughly equivalent to that obtained using a sucrose cushion or butanol. 3.4.3.6
Butanol The filtrate (14 ml) was briefly emulsified with 2.25 ml (ca. 15% v/v) of butanol
and centrifuged at 8 000 g (Sorvall SS-34 rotor) for 10 min. The aqueous phase was retained overnight and used as the final virus suspension. Although this treatment was not as severe as the chloroform clarification, only a few full length PCV particles were observed. This method yielded the second highest number of full length PCV particles after the sucrose cushion, with preparations of the same purity as the chloroform clarification. 3.4.3.7
Chloroform and Butanol The filtrate was shaken with an equal volume (14 ml) of 1:1 chloroform:butanol
and centrifuged at 8 000 g (Sorvall SS-34 rotor) for 10 min. The aqueous phase was retained and shaken with a further 14 ml of chloroform, and centrifuged again at 8 000 g (Sorvall SS-34 rotor) for 10 min. The aqueous phase was stored overnight and used as the final virus suspension. This treatment was just as detrimental to PCV particles as chloroform alone. 3.4.3.8
Summary of clarification methods From the particle numbers extracted by each of these treatments (Table 3.9), it
was obvious that sucrose cushions yielded the highest number of PCV particles. Although other treatments yielded preparations containing much lower amounts of host contamination, these methods were detrimental to PCV particles. Therefore, all further steps attempted in these purification trials used resuspended sucrose cushion pellets as the starting material. It was interesting to note, however, that the use of PEG to precipitate virus particles yielded moderate numbers of PBV particles, and no PCV particles, confirming the findings of Thomson (1997). 89
Chapter 3: Virus Purification
3.4.4
Density gradients The technique used to further concentrate virus particles and eliminate host
contamination is largely dependent upon the stability of the virus, and the purpose of the final preparation. High-speed sedimentation is a physically severe process that may damage some particles, and many virions, particularly rod-shaped ones, and may form pellets that are difficult to resuspend. Other problems associated with high speed centrifugation include very poor recoveries of virions from viruses in very low concentration, due to small pellets dissolving as the rotor comes to rest (McNoughton and Matthews, 1971). Resuspending particles from a pellet can also lead to preferential losses of more slowly sedimenting components. Density gradient centrifugation offers the possibility of purifying such viruses, without pelleting.
Density gradient
centrifugation has been used successfully to separate different virus species from one another, and even to separate particles of different densities from the same virus, eg: Alfalfa mosaic virus (AMV) (Matthews, 1991). As previously mentioned, one of the most significant problems associated with the purification method of Wakman et al. (1995) was a lack of separation of PCV and PBV virus particles. The purpose of these experiments was to assess the ability of different density gradients to separate PBV and PCV particles from each other. 3.4.4.1
Caesium sulphate gradients Two different Cs2SO4 density gradient compositions were used in PCV
purifications. Gradient 1:
The first involved mixing 3 ml of resuspended sucrose cushion pellets
with Cs2SO4, to a final concentration of 25% (w/v), and layering this suspension over a 1 ml cushion of 40% (w/v) Cs2SO4 in WRB. Gradients were adjusted to a final volume of 5 ml (ca. 200 µl was added) with WRB and centrifuged at 100 000 g (Beckman
90
Chapter 3: Virus Purification
SW55 rotor) for 17 h at 5oC. Gradients were fractionated using an ISCO fractionator, with a flow rate of 0.5 ml/min, and absorbance measured at 254 nm. The final density of these gradients ranged from 1.14-1.37 g/cm3.
Virus-containing fractions were
determined by electron microscopy (Chapter 2.3.1), pooled and dialysed exhaustively against WRB at 5oC, and observed again in the electron microscope. Gradient 2:
The second equilibrium gradient consisted of resuspended sucrose
cushion pellets (9 ml) layered over a 4 ml gradient comprised of 2 ml of 0.5 g/ml (w/v) Cs2SO4 in WRB, layered over 2 ml of 1 g/ml (w/v) of Cs2SO4 in WRB, and centrifuged at 150 000 g (Beckman SW55 rotor) for 20 h at 5oC. Gradients were fractionated with an ISCO fractionator, and fractions observed for viruses in the electron microscope. The final density of this gradient ranged from 1.01-1.62 g/cm3.
Virus-containing
fractions were pooled, diluted with WRB and pelleted by ultracentrifugation at 125 000 g (Beckman SW55 rotor) for 90 min at 4oC. Final pellets were resuspended in 50 µl of WRB, and observed by electron microscopy. The two different combinations of Cs2SO4 equilibrium gradients used both yielded moderate numbers of PCV particles in good condition, with low numbers of PBV particles. Although quite effective, neither of these gradients achieved the desired separation of PBV and PCV particles.
The first gradient positioned the expected
density for PCV (1.31 g/cm3) too close to the bottom of the tube, which made recovering this band difficult. In the second gradient the PCV-containing fraction was positioned closer to the centre of the tube, which made recovery easier. 3.4.4.2
Caesium chloride gradients Gradients were prepared by dissolving 2.1 g CsCl in ca. 4.5 ml of resuspended
sucrose cushion pellets (42% w/v), and centrifuging at 200 000 g (Beckman SW55 rotor) for 20 h at 5oC. Gradients were then fractionated in an ISCO fractionator, with a flow rate of 0.5 ml/min and absorbance measured at 254 nm. The final density of these 91
Chapter 3: Virus Purification
gradients was 1.11-1.44 g/cm3. PCV particles were generally found in fractions of 1.301.33 g/cm3. The use of CsCl was not detrimental to PCV or PBV particles, which remained in good condition after 24 hours of exposure (results not shown). This type of gradient produced the highest numbers of PCV particles, and lowest of PBV, of any density gradient attempted. A marked decrease in the amount of host contaminants present in final virus preparations was noticed after the use of this CsCl gradient, which was much quicker and easier to prepare than the Cs2SO4 gradients.
Preparing gradients by
dissolving powdered CsCl directly into the resuspended sucrose cushion pellet suspension allowed a larger volume to be used than was possible with the Cs2SO4 gradients. It is suspected that the larger volume of WRB improved the resuspension of PCV particles, thus increasing the overall yield. Unfortunately, no complete separation of PCV and PBV particles was obtained using this method. The highest concentration of PCV particles was found in fractions 13-14 (1.31 g/cm3), and the highest concentration of PBV particles in fractions 16-17 (1.36 g/cm3), of a 20 fraction gradient.
It was initially thought that perhaps the
gradients had not been centrifuged long enough, resulting in merged distinct virus bands. But when the virus content of individual fractions from two sets of gradients, one spun for 16 h, and one spun for 24 hours, were compared, the virus content of each fraction from both gradients was almost exactly the same (data not shown). 3.4.4.3
Caesium chloride cushion In a separate experiment, a CsCl cushion was used to further clarify virus
preparations before a second round of density gradient centrifugation. Resuspended sucrose cushion pellets were layered over a 3 ml 20% (w/v) CsCl cushion in WRB and centrifuged at 200 000 g (Beckman 75Ti rotor) for 16 h at 5oC.
Pellets were
resuspended in 2-3 ml of WRB for 3.5 h on ice, before separation through a CsCl 92
Chapter 3: Virus Purification
equilibrium gradient as previously described (Chapter 3.4.4.2).
The final virus
suspension was observed in an electron microscope (Chapter 2.3.1). Although PCV particles could be recovered quite well following this treatment, there was no decrease in the amount of host contaminants in the preparation, when compared to preparations produced using only a CsCl density gradient and PCV and PBV particles still remained mixed together. 3.4.4.4
Nycodenz gradients Nycodenz (produced by Nycomed As. Oslo, Norway) is an alternative material
used for preparing density gradients, and had been used with success by Jelkman (1995) in the purification of Cherry virus A. Resuspended sucrose cushion pellets were layered over freshly made Nycodenzgradients prepared by layering 375 µl aliquots of 30, 40, 50 and 60% (w/v) Nycodenz in WRB into centrifuge tubes, and CsCl gradients, prepared as previously described (Chapter 3.4.4.2).
Both types of gradient were centrifuged for 20 h at
150 000 g (Beckman SW55 rotor) at 4oC. Nycodenz gradients did not display any visible bands after ultracentrifugation. Gradients were then fractionated in an ISCO fractionator, with a flow rate of 0.5 ml/min and absorbance measured at 254 nm. Nycodenz absorbs light at this wavelength, and so each fraction was observed in the electron microscope (Chapter 2.3.1) for PCV and PBV particles.
However, when
viewed, these fractions were very dark, possibly due to the high concentration of light absorbing Nycodenz in the suspension, and no particles were observed in any of the fractions. Nycodenz fractions were then pooled into groups, diluted (ca. 10×) in WRB and ultracentrifugated at 200 000 g (Beckman 75Ti rotor) for 90 min at 5oC. Caesium chloride gradients were fractionated as previously described (Chapter 3.4.4.2). Virus-containing fractions were located from the spectrophotometric readout, 93
Chapter 3: Virus Purification
diluted in WRB and centrifuged at 200 000 g (Beckman 75Ti rotor) for 90 min at 5oC. Final virus pellets from both gradient types were each resuspended in 50 µl WRB, and observed by electron microscopy. No virus particles were found in any of the Nycodenz fractions. 3.4.4.5
Summary of density gradients The CsCl density gradient was the most effective gradient in these experiments,
providing the highest number of PCV particles and a marked reduction in the amount of host tissue contamination. However, fractions containing PCV remained contaminated with significant numbers of PBV particles, with the CsCl gradient not able to completely separate the viruses.
Conclusions The optimal purification method for PCV was that of Wakman et al. (1995), with a few modifications. These included increasing the amount of starting tissue, a new extraction buffer, the use of a homogeniser in grinding of tissues and CsCl equilibrium gradients for the final separation of virus particles. This method produced higher numbers of full length, PCV particles and a markedly reduced amount of host tissue contamination in final virus preparations (Figure 3.2).
This technique also
increased the concentration and purity of PCV particles. Pineapple leaf tissue (400 g) used as starting material contained 1-2 particles / grid square, and the final virus preparation (600 µl) contained 75-100 particles / grid square without trapping.
3.5 OPTIMISED VIRUS PURIFICATION METHODS The complete purification protocol developed from these experiments is detailed below, along with protocols adopted for the production of leaf sap extracts and partially purified preparations.
94
Chapter 3: Virus Purification
100 nm
Figure 3.2:
PCV preparation using the newly devised Complete Purification
Method
95
Chapter 3: Virus Purification
Back of figure 3.2
96
Chapter 3: Virus Purification
3.5.1
Leaf sap extract method White basal leaf tissue (0.1 g) was ground in 1 ml of PPB (Chapter 2.3.2), with
acid-washed sand in a mortar and pestle. This extract was then centrifuged at 11 600 g (microfuge) for 3 min, and the supernatant used as ‘leaf sap extract’. Leaf sap extracts were used in ISEM, ELISA and inoculation of host plants. Leaf sap extracts were stored at 5oC for no longer than five days, and were not suitable for storage at temperatures of -20oC or -70oC. PCV particle concentrations were very low in leaf sap extracts and sufficient numbers of particles did not remain intact after the freezing and thawing process to enable detection. Although these preparations did not store well, this method was quick and easy to use in the testing of large numbers of samples by ISEM (Chapter 2.3.2 & 4.2.3.1).
3.5.2
Partial purification method Partially purified virus preparations consisted of resuspended sucrose cushion
pellets, prepared in the same manner as described in the complete purification method presented below (Chapter 3.5.3). PCV and PBV particle numbers were significantly improved by partial purification, with only minor particle damage occurring. Although these preparations still contained large amounts of plant tissue, this method provided a concentration of particles sufficient for use in procedures such as ISEM decoration tests, total nucleic acid extractions, PAGE analysis and screening of hybridoma supernatants. Partially purified virus extracts were always either used directly, placed on ice for no longer than 24 h or immediately stored at -70oC.
3.5.3
Complete purification method Pineapple leaf tissue to be used in purifications was first tested by ISEM for
virus particle content. Leaves from plants with high concentrations of PCV were 97
Chapter 3: Virus Purification
selected for purifications, and only white and very light green basal leaf tissue was used. Leaves were sliced with a scalpel into thin strips, 2-3 mm across, frozen in liquid nitrogen and blended to a fine powder in a Waring blender, for either immediate use or storage at -70oC. Leaf powder was thawed in 80 g lots by mixing with 160 ml of cold (5oC) HEB, at room temperature. Once thawed, mixtures were stirred for 1-2 h at 5oC, and ground in a mortar and pestle with acid-washed sand before filtering through four layers of cheesecloth. The pulp was then reground with another 160 ml of HEB in a mortar and pestle, or blended with a homogeniser for three 1 min bursts on ice. The reground pulp was then filtered through four layers of cheesecloth and the fibres discarded. Filtrates were combined, and centrifuged at 7000 g (Sorvall HS-4 rotor) for 15 min, and the supernatants layered over 15 ml of 20% (w/v) sucrose cushion in HEB and centrifuged for 90 min at 150 000 g (Beckman 45Ti rotor). Pellets were resuspended in a total of 3 ml of WRB, and stirred very gently overnight (16-24 h) at 5oC. Four or five lots of 80 g tissue samples were separately processed on the first day of the purification procedure, and all of the resuspended pellets mixed together, overnight at 5oC. The resuspended sucrose cushion pellets were centrifuged for 10 min at 8 000 g (Sorvall SS-34 rotor), and the supernatant applied to CsCl (42% w/v) equilibrium density gradients. Gradients were spun at 150 000 g (Beckman SW55 rotor) for 2022 h, before fractionating with an ISCO fractionator, using a flow rate of 0.5 ml/min, and absorbance was measured at 254 nm. Virus-containing fractions were located from the spectrophotometric readout, and were observed in the electron microscope by negative staining (Chapter 2.3.1). The virus-containing fractions were diluted in at least seven volumes of WRB, and pelleted at 200 000 g (Beckman 75Ti rotor) for 90 min at 4oC. Final pellets were resuspended by soaking in 50 µl of WRB (or PBS, if particles were to be used in animal 98
Chapter 3: Virus Purification
injections) for up to 2 h, before gently resuspending with a glass rod. Resuspended pellets were clarified by centrifugation at 11 600 g (microfuge) for 3 min, and supernatants used as purified virus. This method gave the highest concentration of PCV and lowest concentration of PBV particles of any of the methods presented (Figure 3.2). PCV particles were at a consistent concentration of 10-12 full length particles per field of view, with a range of 2-5 smaller pieces, and PBV particles were at the most 3-6 particles per field of view. Purified virus preparations were significantly cleaner than partially purified preparations, and contained very little plant tissue (when observed in the electron microscope), especially, if leaf tissue had been stored at -70oC overnight (16 h) or longer prior to the purification process. The majority of PCV particles were found to have a buoyant density of 1.31g/cm3 in CsCl, however some PBV particles were also found at this density, even though the buoyant density of PBV in CsCl was found to be 1.36g/cm3 (Thomson, 1997). Purified virus extracts were always used immediately, or stored at -70oC and thawed immediately prior to use.
3.6
DISCUSSION Similar to many other closteroviruses (Bar-Joseph et al., 1995), PCV remains
difficult to purify. The purification of PCV from infected pineapple leaf tissue was dependent upon several factors, the most important of which was good starting material. The buffer and grinding technique used to extract PCV particles, as well as the method of extract clarification, also played an important role in increasing the yield of purifications. The initial selection of pineapple leaf material used in purifications was found to
99
Chapter 3: Virus Purification
be essential, as virus particle content could vary quite considerably from plant to plant, especially between field plants. As noted previously by Gonsalves (1993), Hu et al. (1993) and Wakman et al. (1995) the titre of PCV was found to vary markedly between plants, and high virus concentrations are not necessarily indicated by MBW-symptoms, making ISEM testing of field leaf material prior to purification vital. Glasshouse-maintained pineapple plants were the best source of virus-infected leaf tissue found in this study, with plants retaining high titres of PCV particles for several years. The reason for glasshouse pineapples maintaining consistently high virus titres while that of field grown plants fluctuated quite markedly from plant to plant is not fully understood. Perhaps the cultural conditions in the glasshouse produced plants with a more suitable metabolism for virus replication. Maintenance of high virus titres in these glasshouse pineapples allowed pineapple leaf tissue of essentially the same virus titre to be used in successive purification trials. Starting material from the same plants also allowed the same mixture of closteroviruses (and badnaviruses) to be used in purification tests. Stored pineapple leaf tissue, containing high titres of PCV particles, provided the next best starting material for virus purification. Of the four methods attempted, the freezing of tissue at -70oC was determined to be the most effective for virus purification and long term storage.
This temperature maintained virus particles in excellent
condition, and the freeze / thaw process also significantly reduced the amount of host tissue contamination.
This finding supports the work of Wakman (1994) who
demonstrated that powdered leaf tissue retained high levels of PCV particles when stored at or below –70oC. Storing leaf tissue at 5oC was suitable only for the short term, and was most suited for ISEM samples. Freeze drying of leaf tissue was an effective method of long term storage for large numbers of samples. The only detrimental form of storage was freezing at -20oC, which quickly 100
Chapter 3: Virus Purification
degraded both PCV and PBV particles. It is interesting to note that Gonsalves (1993) routinely used tissue stored at -20oC for dsRNA extractions. However, the extraction of dsRNA does not rely on the maintenance of intact virions. Initial purification trials centred around small changes to the method of Wakman (1994) and Wakman et al., (1995), including the use of a homogeniser to assist in the release of virus particles, cellulase enzyme digestion and a CsCl density gradient. The use of a homogeniser greatly increased the release of virus particles from pineapple leaf tissue, yielding uniform extracts in a much shorter period of time. Contrary to the findings of Gunasinghe and German (1989), however, enzyme digestion of pineapple leaf tissue did not increase the yield of virus particles. CelluclastTM incubations greatly reduced the number of PCV particles, although the exact cause remains unclear. The low pH (6) required for enzyme activity and an extended incubation at room temperature are most likely responsible. Unlike most other closteroviruses (Bar-Joseph et al., 1995), PCV particles were found to be stable in CsCl without fixation, and gradients used in an initial test yielded moderate numbers (roughly equivalent to those of Cs2SO4) of PCV particles in good condition. Several purification techniques, for other closteroviruses were not useful in the purification of PCV. The use of milk as initial extraction buffer as in the protocol of Ragetli et al. (1982) yielded pineapple leaf extracts containing well-separated full length PCV particles, while particles extracted in WEB contained PCV particles clumped together in small knots.
However, the number of PCV particles in WEB was
significantly higher (nearly 2×) than that found in milk-containing extraction buffers. The idea of using milk as part of an extraction buffer may be worth further investigation, as milk protein has been shown to preserve unstable viruses when stored in dehydrated states (Grivell et al., 1971).
Ragetli et al. (1982) used milk as a
protective medium for the extraction of LChV, with milk proteins preserving the 101
Chapter 3: Virus Purification
structural integrity of particles, preventing the formation of viscous, gel-like extracts by mucoids and reducing the harmful effects of polyphenol oxidases. From the limited attempts in this work, milk did seem to reduce the aggregation of PCV particles, and increase the integrity of intact virions. The effect of milk on particle breakage was not determined. The systematic testing of extraction buffers, clarification techniques and density gradients, eventually produced a purification protocol similar to that of Wakman (1994) and Wakman et al., (1995). Alterations included the change of extraction buffer from Tris-HCl to potassium phosphate, although the concentration, pH and additives used remained the same, and the use of CsCl instead of Cs2SO4 in density gradients. Several other modifications increased the overall yield of PCV particles by allowing more pineapple tissue to be processed in each extraction. The use of a homogeniser made the initial leaf tissue extraction quicker (and more consistent), allowing more sucrose cushions to be processed. The preparation of density gradients by dissolving CsCl directly into resuspended sucrose cushion pellets, allowed resuspension to occur in a larger volume of WRB, which may have increased the number of particles. In contrast to most closterovirus purifications, high speed ultracentrifugation was the most successful clarification technique used with sucrose cushions providing the highest number of PCV particles. Usually closteroviruses are very difficult to resuspend from pellets (Bar-Joseph et al., 1995).
Certainly resuspension of PCV
particles from precipitated pellets (PEG, NaCl and (NH4)2SO4) was not possible. In fact PEG precipitation was used by Thomson (1997) to remove PCV particles from preparations which contained moderate numbers of PBV particles.
The other
alternative, is simply that the other clarification methods attempted (eg: solvents, PEG, activated charcoal) were especially detrimental to PCV, rather than ultracentrifugation being especially good. 102
Chapter 3: Virus Purification
Even after testing each step of the purification separately, the method of Wakman (1994) with minor adjustments yielded the highest numbers of PCV particles. Unfortunately, although PBV particle numbers obtained by this procedure were lower than those produced by the method of Wakman (1994), there were always PBV particles present in each final virus suspension. In theory, the separation of PCV and PBV would seem to be relatively simple as closterovirus particles have a buoyant density of 1.31 g/cm3 in CsCl (Buchen-Osmond et al., 1988) and PBV at 1.36 g/cm3 (Thomson, 1997), but in practice this was not the case. Another major limitation in PCV purity is that of contamination with host proteins, as all methods that effectively removed host protein also removed PCV particles. The main problem associated with PCV purifications remains low particle numbers in final preparations, which are a reflection of the low particle numbers in starting material. Plants containing higher concentrations of PCV particles may be produced by the transmission of PCV to new host species. A higher concentration of PCV particles in plants might also be reached by using pineapples that have been recently infected. However at the time when these experiments were performed the only material available for purification was chronically infected vegetative progeny of infected plants. As the highest virus titre is often achieved in plants a few weeks after inoculation, the ability to transfer PCV to PCV-free pineapples may increase the quality of starting material. Even though PCV transmission by mealybugs has been recently demonstrated to occur only at relatively low frequency (Sether et al., 1998), this may provide a suitable source of such material. A method of partial purification was developed from the initial steps of the purification procedure, and was used in the development of ELISA, monoclonal antibody screening and as starting material for PCR. In conclusion, a significant improvement in the total number of PCV particles 103
Chapter 3: Virus Purification
purified was achieved by increasing the amount of tissue processed during the extraction, without increasing the ratio of host tissue contamination to virions. However, the presence of significant numbers of PBV particles in final virus preparations was not adequately resolved.
104
Chapter 4: Serological Detection
CHAPTER 4
Detection of Pineapple Viruses by Serological Methods
4.1
INTRODUCTION
4.1.1
Antibodies The main function of the immune system is to protect animals from invading
foreign organisms and macromolecules. Antibodies play a vital role in this system by binding to surface features (epitopes) on these foreign molecules in a highly specific manner, and marking them for disposal by the body. Antibodies are produced by lymphocytes (antibody-secreting cells), with only a single antibody type specific to a single epitope produced by each lymphocyte. In practice, most antigens (molecules that can bind to an antibody) contain a number of epitopes, and so a range of different antibodies, each produced by a different clonal line of lymphocytes, are produced in response to the antigen. Polyclonal antibodies (PAs) is the term used to describe this pool of different antibodies. If a single lymphocyte cell line is isolated, cloned and propagated, a single antibody type (monoclonal antibodies, MAb) is produced. Animals are injected with virus preparations to instigate an immune response. The properties of antisera are determined by the genetic composition of the animal injected, and the purity, intactness, antigenicity and concentration of the antigen. Increasing the dose of antigen may increase the antibody titre, but may also increase the titre of non-specific antibodies (Crowther, 1995).
105
Chapter 4: Serological Techniques
4.1.1.1
Monoclonal antibodies (MAb) MAb are secreted from hybridoma cells formed from the fusion of lymphocytes
(from an immunised animal) with specially mutated myeloma cells. Myeloma cells have all the cellular machinery needed for the secretion of antibodies, but do not produce functional antibodies (Harlow and Lane, 1988). Myeloma cells are tumour cells specially selected for their ability to proliferate indefinitely in cell culture. Lymphocytes are not able to be cultured for long periods, and so are fused with myelomas cells to allow the combination of the spleen cell’s ability to produce antibodies to only one antigen, and the myeloma cell’s ability to proliferate indefinitely in cell culture. MAb are harvested from the supernatant of hybrid cells in tissue culture. Individual lymphocytes (spleen cells) of immunised animals produce a single antibody type specific to a single epitope, regardless of the number of antigens they are exposed to during their lifetime. This enables the production of individual cell lines that secrete antibodies specific to a single antigen ie: determinant (or epitope), even when only impure preparations of antigens are available for use in immunising an animal. MAb have several advantages including increased specificity, smaller immunisation doses and an almost limitless supply of standard antibody preparations can be produced.
The major disadvantage of MAb is their potential for extreme
specificity as even very slight changes in the epitope may make it unrecognisable to the antibody, with some MAb being assay specific, working extremely well in one system and not at all in others. MAb are also much more expensive and time consuming to produce than PAs. 4.1.1.2
Polyclonal antisera (PAs) PAs are composed of many different antibody specificities, and can be thought
of as a mixture of many MAb. Whereas MAb are produced by lymphocyte hybrids in tissue culture, polyclonal antibodies (PAb) are harvested from the whole blood of 106
Chapter 4: Serological Detection
immunised animals, and as such represent a finite resource. Problems associated with PAs production include the need for high purity antigen preparations for immunisation, and also depending on the size of the animal injected (eg: rabbit, goat or sheep), a relatively large amount of antigen is needed. In general, the heterogeneous nature of antibodies present in PAs allows a more comprehensive study of the overall similarity between virus particle antigens (Matthews, 1993). Other advantages of PAs include lower production costs and simpler production techniques compared to MAb (Harlow and Lane, 1988).
4.1.2
Use of antibodies in serological assays IgG is the most abundant antibody type found in PAs and is produced at a
quicker and longer lasting level than any other antibody type when animals are immunised repeatedly with the same antigen (Harlow and Lane, 1988). However, whole antiserum also contains a large proportion of proteins which do not participate in the assay reaction, with specific antibodies generally accounting for only 1-5% of the total protein (Crowther, 1995). Therefore, purified IgG is often used for trapping of virus particles especially in ELISA and TBIA reactions (Harlow and Lane, 1988). The antigen-antibody bond plays an important role in serological tests, especially ISEM and ELISA, which rely on a high level of affinity for the successful detection of antigen. Affinity is the measure of the strength of the binding of an antigen to an antibody.
The antigen-antibody complex is held together by multiple non-
covalent bonds, and is in equilibrium with the free antigen and antibody components. Therefore, small changes in the antigen’s structure can profoundly affect the strength of these bonds (Harlow and Lane, 1988).
107
Chapter 4: Serological Techniques
4.1.3
Using antibodies to detect viruses Antibodies have been used widely to detect and identify viruses in plants. Early
techniques such as precipitin tests and Ouchterlony gel diffusion relied upon the formation of a visible complex by the binding of antibodies to antigen.
Most
serological assays today make use of solid phase support, such as polystyrene, polyvinyl, nitrocellulose or electron microscopy grids (Martin, 1998).
The big
advantage of using solid supports is that they reduce the need for optimal reagent concentrations (Ball, 1990), are more sensitive and use less antibodies than gel diffusion assays (Clark and Adams, 1977; Derrick, 1990; Makkouk et al., 1993).
Electron
microscopy and enzyme-linked assays also have a range of other benefits making them more or less useful for a variety of tasks, as discussed below. 4.1.3.1
Electron microscopy A direct method of using specific antibodies to detect viruses is by observing
virus particle - antibody complexes with an electron microscope. Antibodies are used in this process in two ways. The first is to trap, and hold, virus particles onto the electron microscope grid, enabling virus particles to be concentrated from a virus extract, before staining and viewing in an electron microscope. This trapping technique was developed by Derrick (1972, 1973), and is termed immunosorbent electron microscopy (ISEM). ISEM is most commonly used to detect viruses in crude sap extracts. If mixtures of antisera specific for different viruses are used it is possible to detect more than one virus at the same time, in the one sample. Antibodies are also used to coat virus particles already trapped on grids, a process which is called decoration and which can be used to determine the specificity of the antibodies (Yanagida and Ahmad-Zadeh, 1970).
Virus particles to which the
antiserum is specific become indistinct in appearance due to the coating of the particles with antibodies, while virus particles to which the antiserum is not specific retain their 108
Chapter 4: Serological Detection
normal sharp-edged appearance.
Decoration is useful for examining relationships
between viruses, and identification of mixed infections, especially when viruses have similar morphologies.
Gold labelling of decorated virus particles enhances the
confidence of virus identification, as the gold particles are uniform and easily recognised (Martin, 1998). The ability of some antibodies to trap and decorate particles from other viruses (usually from the same genus), has been used as a means of determining serological relatedness between viruses. Conversely, the specificity of some antibodies (especially MAb) to bind to only one epitope, has enabled the differentiation and detection of many viruses and virus strains (Martin, 1998). The main disadvantage of ISEM remains the expense and limited availability of electron microscopes. 4.1.3.2
Enzyme-linked assays Enzyme linked immunosorbent assay (ELISA) and tissue blot immunoassay
(TBIA) are currently the most widely used serological methods for the detection of plant viruses. Neither technique has changed significantly since their inception, except for the application of MAb.
These assays are carried out on solid supports (ie:
polystyrene, polyvinyl, nitrocellulose or filter paper), with each component applied successively.
The addition of an enzyme label to the detecting antibody allows
detection by enzymatic hydrolysis of a substrate, resulting in either a colour change or light emission (Martin, 1998). The ability to quantitatively measure this substrate reaction and the relatively high level of sensitivity are the real advantages to using these types of technique. Enzyme linked immunosorbent assay (ELISA) ELISA is a useful diagnostic tool as substances are passively adsorbed (which allows a great deal of flexibility in assay design) to solid surfaces, such as 96-well polystyrene plates, allowing the use of small volumes and large numbers of samples to 109
Chapter 4: Serological Techniques
be processed rapidly. As the first reactant in the ELISA is attached to a solid-phase, the separation of bound and free reagents is easily made by a simple washing procedure. The result of ELISA is a colour reaction, which can be assessed by eye, or by the use of spectrophotometric analysis, allowing statistical analyses to be performed. ELISA is quick, accurate and allows the semi-quantitative determination of an antigen in unknown samples, giving a comparison of samples within a single test. The main advantages of ELISA as a diagnostic test are its high sample handling capacity, relative sensitivity, and ease of performance and reading. Tissue blot immunoassay (TBIA) TBIA is approximately as sensitive as ELISA with the advantage of very simple sample preparation, with small amounts of sap spotted, or the cut edge of plant leaves, stems or petioles pressed onto a solid support (filter paper or nitrocellulose) (Makkouk et al., 1993). The blotting of tissue pieces directly onto the support has the added advantage of showing the distribution of the virus within the cut surface (Holt, 1992). TBIA also allows the solid support to be taken into the field, and blotting performed on site, as no specialised equipment is necessary (Martin, 1998).
4.1.4
PCV antisera Several different antisera have been produced to closterovirus-like particles
extracted from pineapple tissue in both Hawaii and Queensland. 4.1.4.1
Hawaiian polyclonal antiserum The first PCV-specific polyclonal (rabbit) antiserum was produced in Hawaii,
and successfully detected PCV in microprecipitin and decoration tests. No serological relationship was detected between PCV and GVA using these techniques. A platetrapped antigen ELISA protocol was developed, and initially appeared to be useful for large scale screening, showing widespread PCV infection in Hawaiian pineapple fields (Ullman et al., 1989). In later studies, this ELISA system was found to be lacking in 110
Chapter 4: Serological Detection
sensitivity, resulting in false negative results (Hu et al., 1995). 4.1.4.2
Australian PCV antiserum (PCV-PAs) Wakman (1994; Wakman et al., 1995) produced a rabbit PAs with antibodies
specific to both PCV and PBV particles. Multiple (18) intramuscular injections were given to a rabbit over a period of almost two years, during which time many bleeds were taken (Wakman, 1994). Hereafter, Wakman’s PCV antiserum (bleed 13-01-1993) is referred to as PCV-PAs, unless another bleed date is specified. The bleeds of PCVPAs used in this work are listed in Appendix 1. Wakman used PCV-PAs as the basis for an ISEM assay, which increased the efficiency of PCV and PBV detection by electron microscopy enormously when compared to electron microscope examination without trapping. However, this assay was not 100% reliable in detecting virus particles after a single test. Using ISEM, Wakman (1994) found PCV to be distributed throughout Australian pineapple plants, and demonstrated serological relationships between PCV particles from Australia, Brazil, France, Hawaii, Malaysia, South Africa and Taiwan. An ELISA protocol developed using PCV-PAs was not able to reliably distinguish between PCV-infected field pineapples from PCV-free seedling pineapples. This was most likely caused by the high host reaction and low PCV-specific titre shown by this antiserum (Wakman, 1994).
Dassanayake et al. (1994) reported a strong
correlation between MBW symptoms and ELISA positive results, in Sri Lankan pineapple plants, using PCV-PAs. However, given broad specificity (including both PCV and PBV particles and some plant proteins) of this antiserum, these results need to be more closely examined. However, PCV-PAs was specific enough for Wakman (1994; Wakman et al., 1995) to discern two serologically distinct types of “closterovirus-like” particle in Australian pineapples. PCV particles decorated by PCV-PAs were assigned to the 111
Chapter 4: Serological Techniques
PCV-A serogroup, and undecorated particles to the PCV-B serogroup (Wakman et al., 1995). 4.1.4.3
Hawaiian monoclonal antibodies A PCV-specific monoclonal antibody was produced in Hawaii using Australian
PCV-PAs as trapping antibody in the ELISA screening assay (Hu et al., 1996). Hu et al.(1996) then used PCV-PAs as polyclonal coating antibodies, and Hawaiian monoclonal detecting antibodies in a triple antibody sandwich ELISA, to show that PCV was widespread in Hawaiian and overseas pineapples.
This ELISA initially
showed promising results, but was later determined to be lacking in sensitivity, and required partially purified leaf, or root tissue samples for accurate results (Hu et al., 1997). Hawaiian MAb (Haw MAb) were used successfully to detect PCV particles in ISEM.
Two different serotypes of closterovirus-like particles were detected in
pineapple plants with and without MBW symptoms, using Haw MAb in ISEM. No PCV particles were detected in seedling pineapples. PCV particles were also detected in pink pineapple mealybugs (Dysmicoccus brevipes) collected from MBW-affected pineapples, but not from pink pineapple mealybugs raised on squash (Hu et al., 1996). Hawaiian monoclonal antibodies were also used to show two serologically distinct closteroviruses also existed in Hawaiian pineapples (Hu et al., 1996). In a later publication, Hu et al. (1997) reported Haw MAb was suitable for use in TBIA, using nitrocellulose membranes dotted with leaf tissue samples.
The
Hawaiian PCV-specific monoclonal antibody is being used to detect PCV in a TBIA, which involves the blotting of leaf tissue onto nitrocellulose, and the subsequent detection of virus in a method similar to that of ELISA. This technique has been used to screen over 20 000 Hawaiian pineapple plants (Hu et al., 1997) and a range of samples from other countries (John Hu, personal communication). 112
Chapter 4: Serological Detection
4.1.5
Plan of Investigation To develop a specific, sensitive, high through-put diagnostic assay for PCV (and
possibly PBV), using (A)
PCV-PAs and badnavirus PAs (in ISEM and / or ELISA) or by
(B)
Producing MAb to PCV (and possibly PBV).
4.2
DEVELOPING AN ISEM ASSAY FOR PCV
AND PBV Wakman (1994; Wakman et al., 1995) used PCV-PAs to trap and decorate closterovirus-like particles in pineapple. This test was not always effective at detecting virus, after a single testing, with some samples requiring two or more tests before both PCV and PBV were detected.
Therefore a selection of antisera was screened to
determine if a different combination of trapping antisera would improve the success rate of virus detection.
Aims To determine the most effective trapping antiserum for the detection of PCV and PBV particles. To develop a sensitive, specific ISEM assay for the routine detection of PCV and PBV.
Experimental Design and Results 4.2.1
PCV Detection
4.2.1.1
Polyclonal PCV antiserum A polyclonal antiserum specific to both PCV and PBV (PCV-PAs) was
produced by Wakman (1994; Wakman et al., 1995). This antiserum was produced by 113
Chapter 4: Serological Techniques
the injection of a rabbit with 18 partially purified virus preparations, during the course of which eight bleeds were taken (Appendix 1), and analysed by decoration tests for specificity (Wakman, 1994). A further two bleeds (Chapter 2.5.1.2) of PCV-PAs (NB I and NB II) were produced, by injecting the same rabbit used by Wakman (1994) with fresh purified virus preparations. After the first injection a test bleed (NB I) was taken to determine the PCV-specific PAb titre of the animals blood. The titre of NB I was significantly lower than that of PCV-PAs, and so a second injection was performed and a second bleed (NB II) prepared. Decoration tests (Chapter 2.3.3) were used to compare the PCV-specific titre of the two new bleeds and PCV-PAs (Table 4.1).
Table 4.1: Details of further PCV-PAs bleeds
Polyclonal Antiserum Bleed
Decoration of PCV at dilution of 1/100
1/1000
1/3000
New Bleed I (03-08-1995)
+++
++
-
-
-
New Bleed II (28-08-1995)
+++
+++
+++
++
-
PCV-PAs (13-01-1993)
+++
+++
+++
++
+
+ = light decoration
4.2.1.2
++ = moderate decoration
1/10000 1/15000
+++ = heavy decoration
Evaluation of PCV antiserum bleeds Five bleeds of PCV-PAs (23-11-1992, 13-01-1993, 10-02-1993, NB I and
NB II) were diluted to 1/1000 in sterile water, and tested for their ability to trap PCV and PBV virus particles from leaf sap extracts (Chapter 3.5.1) using ISEM (Chapter 2.3.2). Particle numbers for each virus were determined (Table 4.2) by counting the number of particles present along the border of one electron microscope grid square (Figure 4.1). The highest number of PCV and PBV particles was detected with PCVPAs (13-01-1993). 114
Chapter 4: Serological Detection
Table 4.2: Testing of PCV antisera for the ability to trap PCV and PBV particles
Antiserum
Average Number of Virus particles* PCV
PBV
Normal serum (7-1990)
1.0
±
1.0
1.0
±
0.5
PCV-PAs (NB I; 3-08-1995)
4.0
±
11.0
16.5
±
1.5
PCV-PAs (NB II; 18-08-1995)
69.0
±
2.0
26.5
±
1.5
PCV-PAs (23-11-1992)
30.0
±
1.0
16.5
±
1.5
PCV-PAs (13-01-1993)
81.0
±
6.0
28.0
±
3.0
PCV-PAs (10-02-1993)
58.5
±
2.5
21.5
±
1.5
Wakman antisera from Appendix 1 New Bleed antisera from Table 4.1 Trapping was performed as described in Chapter 2.3.2 *Virus particles present along the border of one electron microscope grid square (Chapter 4.2.3.1), four grids were counted for each antiserum 4.2.1.3
Specificity of antisera for PCV A range of closterovirus-specific antisera was used to test for decoration of PCV
particles (Chapter 2.3.3), from partially purified (Chapter 3.5.2) field plants grown in Moggill. PCV particles were trapped using PCV-PAs, and tested with antisera specific for CTV-OSP, HV-6, Heracleum latent virus (HLV) and Haw MAb. PCV-PAs was the only antiserum to decorate PCV particles from Moggill field plants. 4.2.1.4
Summary of PCV detection
PCV-PAs (13-01-1993) was shown to be the most effective antiserum for the trapping of PCV particles in ISEM, as determined by the counting of particle numbers per grid square. PCV-PAs was also determined to be the most effective in decorating PCV particles, while Haw MAb, CTV-OSP, HLV and HV-6 antisera did not decorate
115
Chapter 4: Serological Techniques
10 µm
Figure 4.1:
Diagrammatic representation of the area covered (
square is counted for comparative ISEM tests
116
) when a grid
Chapter 4: Serological Detection
Australian PCV isolates. After this test was performed, HLV was reclassified initially as a trichovirus (Martelli et al., 1994) and subsequently a vitivirus (Saldarelli et al., 1998) and so no cross-reactivity would be expected to occur between HLV-specific antiserum and PCV.
4.2.2
PBV Detection
4.2.2.1
Specificity of PCV-PAs bleeds for PBV PCV-PAs was demonstrated by Wakman (1994) to have antibodies specific to
PBV. PCV-PAs bleeds were assessed for their ability to trap PBV particles (Table 4.2). PCV-PAS (13-01-1993) and PCV-PAs NB II were shown to be the most effective PAs for the trapping of PBV particles in ISEM. 4.2.2.2
Trapping with badnavirus antisera A range of ten badnavirus antisera were tested for their ability to trap PBV
particles in ISEM (Chapter 2.3.2), and the number of PBV particles per grid square was determined.
PCV-PAs was included as a standard against which to compare the
effectiveness of the other antisera. SCBV-4Mx trapped the largest number of PBV particles (ca. 50× >PCV-PAs), followed (in order) by PAs specific to Kalanchoe topspotting virus (KTSV), BSV-Morrocco (BSV-MN), SCBV-Selemi, Bali (SCBV-SB) and Dioscorea bacilliform virus (DBV) (Table 4.3). 4.2.2.3
Comparison of SCBV-4Mx and PCV-PAs by decoration Some degree of serological relatedness was determined by the number of PBV
particles trapped by the different badnavirus antisera with a clear affinity for PBV particles being shown by SCBV-4Mx. The decoration dilution end point of SCBV-4Mx and PCV-PAs for PBV particles was determined using partially purified PBV particles (Chapter 3.5.2). In ISEM decoration tests (Chapter 2.3.3) with PBV, SCBV and their respective antisera, homologous decorations were stronger than heterologous ones (Table 4.4). 117
Chapter 4: Serological Techniques
Table 4.3: Numbers of virus particles trapped by badnavirus antisera.
Antiserum to
Provided by
Number of Virus Particles* PBV
PCV
Sugarcane bacilliform virus-4Mx (SCBV-4Mx)
B.E. Lockhart
144.5 ± 5.5
8.0 ± 0.0
Sugarcane bacilliform virus-Selemi, Bali isolate (SCBV-SB)
B.E. Lockhart
20.0 ± 3.0
1.0 ± 0.0
Banana streak virus-Rwanda isolate (BSV-RW)
B.E. Lockhart
7.5 ± 3.5
1.0 ± 1.0
Banana streak virus-Moroccan isolate (BSV-MN)
B.E. Lockhart
30.0 ± 2.0
1.0 ± 1.0
Commelina yellow mottle virus (ComYMV)
B.E. Lockhart
13.5 ± 3.5
1.0 ± 0.0
Kalanchoe top-spotting virus (KTSV)
B.E. Lockhart
62.5 ± 1.5
2.0 ± 1.0
Rice tungro bacilliform virus (RTBV)
H. Hibino
1.0 ± 0.7
2.0 ± 1.2
Cacao swollen shoot virus (CSSV)
H.J. Vetten
2.0 ± 0.7
4.7 ± 0.4
Dioscorea bacilliform virus (DBV)
A. Brunt
21.0 ± 3.0
2.0 ± 1.0
Piper yellow mottle virus (PYMoV)
P. Jones
1.3 ± 0.4
2.0 ± 0.7
Pineapple closterovirus (PCV-PAs 13-01-1993) (Table 4.2)
W.Wakman
1.5 ± 1.5
106.0 ± 3.0
-
1.3 ± 1.1
2.0 ± 1.4
Normal serum
*Number of (>75% full length) particles per electron microscope grid square (Chapter 4.2.3.1), all particle counts are means ± standard deviation, with n = 4. 4.2.2.4
Summary of PBV detection Even though PBV particles were more heavily decorated by PCV-PAs than by
SCBV-4Mx (Table 4.4), SCBV-4Mx was significantly better at trapping PBV particles in ISEM (Table 4.3).
The reason for this remains unclear, but maybe related to
badnavirus-specific antibodies in SCBV-4Mx having a stronger affinity for PBV
118
Chapter 4: Serological Detection
particles than those present in PCV-PAs. Alternatively, the antigen(s) on PBV’s surface to which SCBV-4Mx PAb are specific may be present in lower numbers than the antigens to which PCV-PAs are specific.
4.2.3
ISEM detection of PCV and PBV A combination of the antisera which trapped the highest number of PCV and
PBV particles, PCV-PAs and SCBV-4Mx, were used in the development of a routine ISEM test. 4.2.3.1
ISEM as a diagnostic test A system was designed to use ISEM as a semi-quantitative diagnostic test to rate
the relative numbers of virus particles present in samples. A standard preparation, or leaf sap extract (Chapter 3.5.1) was made, and virus particles trapped onto grids and negatively stained (Chapter 2.3.2). Grid squares selected for counting were uniform in shape and size, and checked for even coverage of trapping antisera, (PCV-PAs; SCBV4Mx), leaf sap extract and stain. The numbers of PCV and PBV particles around the border of a single grid square edge were counted (Figure 4.1), with two grid squares from each of two grids being counted. If no particles were found in the first 2-3 grid squares observed, then a timer was set, and the entire grid searched at random for 10 min. If no particles were observed in a sample after two different grids of the same sample had been searched, then the sample was considered to be potentially virus-free, and a new leaf sap extract was prepared and observed. If after two samplings, no virus particles were detected, the individual tissue sample was considered to be virus-free. If the plant tested negative for both viruses after four sets of tissue samples were analysed over a period of not less than 18 months, then the plant was considered to be virus-free.
119
Chapter 4: Serological Techniques
Table 4.4: Decoration of PBV and SCBV particles with PCV-PAs and SCBV-4Mx
Virus SCBV
Decorating Antiserum Dilution PCV PAs
1/100
++
1/300
+
1/1000
0
1/3000
0
1/100
++
1/300
++
1/1000
++
1/3000
+
Normal
1/100
0
serum
1/300
0
1/1000
0
1/3000
0
1/100
+++
1/300
++
1/1000
+
1/3000
+
1/100
+++
1/300
+++
1/1000
++
1/3000
0
Normal
1/100
0
serum
1/300
0
1/1000
0
1/3000
0
SCBV
PBV
PCV PAs
SCBV
0 = normal serum control + = light decoration 120
Average Level of Decoration Of Virus Particles
++ = moderate decoration +++ = heavy decoration
Chapter 4: Serological Detection
Having outlined this process, in practise, 95% of plants that were eventually determined to be infected with either PBV or PCV tested positive for both viruses after the first sample was tested, and 99% after the second (data not shown). 4.2.3.2
Samples tested using ISEM During this study, ISEM was used to test for PCV and PBV in many different
samples, including field plants, seedling pineapples, bromeliads, tissue cultured plantlets (Chapter 6), crowns prior to tissue culture dissection (Chapter 6), crowns before and after heat treatment (Chapter 6), plants used in transmission studies (Chapter 7), as well as in the comparison of purification trial preparations (Chapter 3). The only pineapple plants which consistently tested negative were seedlings. One group of 8 seedling plants was tested every 4-6 months over a 4 year period and always tested negative. Pineapple leaf tissue samples obtained from north Queensland, the Glasshouse Mountains (south east Queensland), Sri Lanka and Irian Jaya were also tested using ISEM, with both PCV and PBV detected in all of these areas.
Conclusions ISEM was an effective, though laborious, method of testing for both PBV and PCV particles using PCV-PAs and SCBV-4Mx antisera. Counting the number of virus particles present in a single lap of an electron microscope grid square was determined to be a suitable method for use in the comparison of various antisera ability to trap virus particles. This test was not always 100% effective in the detection of virus particles. All positive results were certain, but false negatives were possible, especially if only single tests were performed. As a result of this, an exhaustive testing system was developed in order to ensure that plants testing negative for viruses by ISEM were in fact virus-free.
121
Chapter 4: Serological Techniques
ISEM also provided a semi-quantitative test for comparing the virus particle content of samples within a single test.
4.3
DETECTING PCV USING ELISA ELISA consists of a series of steps where an antigen is bound to a solid phase
support, detected by an antibody, and the amount of detecting antibody (conjugated to an enzyme) bound determined by substrate hydrolysis. Each of these steps can be performed in a variety of ways, which has lead to the development of a flexible system which can be easily changed to suit the available ingredients. Dassanayake et al. (1994) used PCV-PAs in ELISA to detect closterovirus-like particles (PWV) from pineapple in Sri Lanka. This protocol was found to detect closterovirus-like particles in MBW-affected pineapples, with symptomless pineapple plants testing free of virus in Sri Lanka (Dassanayake et al., 1994). The effectiveness of this method at detecting Australian PCV isolates was assessed in this study. Four formats of ELISA were used in this study, three to detect PCV in tissue samples, and one to screen hybridoma supernatants for MAb specific to PCV. Double antibody sandwich (DAS-ELISA), plate trapped antigen (PTA-ELISA), Staphylococcus protein A (SPA-ELISA) and triple antibody sandwich (TAS-ELISA) formats are diagrammatically represented in Figure 4.2.
Aim To develop a specific, sensitive diagnostic test for the detection of PCV using PCV-PAs in any of several formats of ELISA.
Experimental Design and Results 4.3.1
Buffers and Conditions
All of the tests in this section were performed using the standard conditions 122
Chapter 4: Serological Detection
Figure 4.2:
(A) DAS-ELISA
(B) PTA-ELISA
(C) SPA-ELISA
(D) TAS-ELISA
Virus particle
Conjugated Enzyme
Trapping antibody
Conjugated antibody
Detecting antibody
Staphylococcus protein A
Diagrammatic representation of the four types of ELISA used in this
study, (A) double antibody sandwich (DAS-ELISA); (B) plate trapped antigen (PTA-ELISA); (C) Staphylococcus protein A (SPA-ELISA) and (D) triple antibody sandwich (TAS-ELISA).
123
Chapter 4: Serological Techniques
Back of figure 4.2
124
Chapter 4: Serological Detection
described by Clark and Adams (1977), and buffers listed in Table 4.5. Unless otherwise stated, all ELISA’s were carried out with a reaction volume of 50 µl. All incubations were performed in humid chambers at room temperature, and wells washed 3× 3 min each with PBS-Tween between each step.
After the enzyme-conjugate
incubation step, substrate solution was added to wells, and all plates were read after 1 and 3 or 4 h incubations at room temperature, and an overnight incubation at 4oC, in a Dynatech MR7000 plate reader at 410 nm.
4.3.2
Double antibody sandwich-ELISA (DAS-ELISA) DAS-ELISA involves the coating of wells with virus-specific antibodies, the
addition of virus-containing extracts, followed by the detection of trapped virus particles with a detecting antibody conjugate (Figure 4.2A).
The sensitivity of
DAS-ELISA depends upon the number of antibody molecules which become bound to the plate during the coating step, the overall stability of the coating antibody-virus antigen bond and the specificity of the detecting antibody-virus antigen bond (Harlow and Lane, 1988). The main advantage of DAS-ELISA is that the same antibody can be used to trap and detect virus particles.
Trapping virus particles allows the virions to be
specifically selected and concentrated from samples with low levels of virus (antigen). However, not all antibodies are suitable for use in DAS-ELISA, for example IgM molecules are not as efficient at attaching to solid supports as IgG. Also, all detecting antibodies must be enzyme-conjugated. Attaching an enzyme can alter the antibody’s specificity and affinity by changing the molecule’s shape.
Depending upon the
specificity of the covalent bonds involved in the antigen-antibody reaction, even small changes in structure can significantly reduce the binding capacity of antibodies.
125
Chapter 4: Serological Techniques
Table 4.5: Buffers used in ELISA
Buffer
Composition
Carbonate coating buffer
0.05 M carbonate buffer, pH 9.6
Tris-extraction buffer
0.5 M Tris-HCl, pH 8.4, 4% (v/v) Triton X-100, 0.5% (w/v) Na2SO3
Phosphate-extraction buffer
0.07 M potassium phosphate buffer, pH 7-7.2
PBS-Tween
1.5 mM KH2PO4, 140 mM NaCl, 8 mM Na2HPO4, 2.7 mM KCl, pH 7.4-7.5, 0.5% (v/v) Tween-20
Substrate buffer
10% (v/v) diethanolamine, pH 9.6
Substrate solution
1 mg/ml of p-nitrophenyl phosphate in substrate buffer
DAS-ELISA using PCV-PAs to detect PCV plant sap extracts was considered to be unreliable by Wakman (1994), who obtained inconsistent results, with high background readings from PCV-free seedling pineapples. However, Wakman only made limited attempts using DAS-ELISA, and it was thought that further investigation was warranted. DAS-ELISA was attempted using the IgG preparations (PCV-IgG) and enzymeconjugates (PCV-IgG-AP 10-03-1994) prepared from PCV-PAs by Wakman (1994). Wells were coated with PCV-IgG diluted to 1.6 µg/ml, 1µg/ml, 0.5 µg/ml and 0.16 µg/ml in carbonate coating buffer for 2 h.
Pineapple extracts were made by
grinding 0.1 g of basal leaf tissue in liquid N2, and thawing the powder in 1 ml of Trisextraction buffer. Extracts were centrifuged at 12 000 g for 3 min, the supernatant 126
Chapter 4: Serological Detection
added to wells, and the plate incubated overnight at 4oC. PCV-IgG-AP (10-03-1994) was used at a dilution of 1/1000 in PBS-Tween, and the plate incubated for 4 h. Even after 24 h of substrate incubation, spectrophotometric readings of only 0.001-0.008 were recorded in all wells, regardless of the PCV content of the extracts used. In subsequent testing (ISEM), PCV was detected in all field pineapple plant extracts, while seedling pineapple extracts were PCV-free. When another aliquot of PCV-IgG-AP (10-04-1994) was diluted 1/1000 with PBS-Tween and added to a fresh aliquot of substrate solution, a strong yellow colour was observed by eye after 1 h of incubation, indicating that the enzyme was still active.
As the leaf sap extracts
contained PCV, and PCV-IgG-AP (10-04-1994) was still able to hydrolyse the substrate solution, the obvious explanation for the lack of colour in the wells was simply that no virions had been bound to the wells, or that the antibody conjugate had been unable to detect (bind to) virus particles. New preparations of PCV-IgG (1996) (Chapter 2.5.3) and PCV-IgG-AP (1996) (Chapter 2.5.4) were prepared from PCV-PAs, and used in DAS-ELISA with PCVcontaining and PCV-free pineapple extracts (prepared as previously described). Once again no colour was detected in any of the wells.
4.3.3
Plate trapped antigen-ELISA (PTA-ELISA) As the name suggests, PTA-ELISA omits the coating of antibodies onto the
wells before the addition of plant extracts, and instead adheres virus particles directly to the plastic of the wells (Figure 4.2B). This has the advantage of allowing the use of crude antiserum in the detecting step of the procedure, so that IgG and enzymeconjugates need not be prepared. However, “crude” samples can be detected poorly, with only low levels of antigen (virus) attaching to the wells, due to competition for binding sites on the plastic with other molecules including plant proteins.
The
effectiveness of PTA-ELISA is determined by the amount of antigen bound to the wells, 127
Chapter 4: Serological Techniques
the affinity of antibody for antigen (virus) and the strength of the detecting antibodyantibody enzyme conjugate bond. 4.3.3.1
Comparison of PCV-PAs bleeds Six bleeds of PCV-PAs (listed in Table 4.6) were used in PTA-ELISA in order
to determine which was the most suitable to use for the detection of PCV from partially purified preparations. At the time of this experiment, NBI and NBII had not yet been produced. Partially purified preparations (Chapter 3.5.2) of PCV and PBV-infected pineapple, PCV-free seedling pineapple and virus-free bromeliad plants (stored at -70oC), were mixed 1:1 with 2× carbonate coating buffer in ELISA plate wells and incubated for 2 h.
The PCV content of all plant extracts was assessed by ISEM
(Chapter 2.3.2) prior to use. The detecting antiserum used in half of the wells was cross-absorbed with PCVfree seedling pineapple leaf sap.
PCV-free sap extract was diluted 1:30 with the
detecting antiserum solution, before addition to the plate. PCV-PAs (1/1000 in PBSTween) was added and the plate incubated overnight at 4oC. Goat anti-rabbit alkaline phosphatase (GAR-AP) enzyme conjugate (Sigma, Cat #: A 3687) was diluted as directed, 1/30 000 with PBS-Tween and added to each well for 3 h. The highest level of detection was obtained from PCV-PAs (13-01-1993), which yielded ELISA values for the PCV-infected sample 10× higher than for the PCV-free sample, when detecting PCV-PAs was cross-absorbed with seedling leaf sap (Table 4.6). The results obtained using cross-absorbed antisera also appeared to show a small but consistent difference (ca. 10×) between PCV-infected samples and PCV-free seedling pineapples, using PCV-PAs (13-01-1993).
128
Table 4.6: Comparison of PCV-PAs bleeds for detecting PCV in PTA-ELISA PCV-PAs* (bleed date)
Cross-absorbed PCV-PAs
PCV-PAs
Buffer
Seedling
PCV
Buffer
Seedling
PCV
07-06-1992
0.002
0.000 0.001
0.023 0.019
0.003
0.079 0.103
0.119 0.134
17-09-1992
0.002
0.003 0.000
0.024 0.030
0.002
0.197 0.257
0.262 0.347
23-11-1992
0.001
0.001 0.005
0.075 0.069
0.002
0.454 0.407
0.402 0.640
13-01-1993
0.003
0.007 0.010
0.115 0.108
0.001
0.144 0.660
0.488 0.850
10-02-1993
0.005
0.003 0.003
0.097 0.083
0.001
0.451 0.394
0.628 0.612
22-02-1993
0.000
0.001 0.001
0.050 0.046
0.001
0.093 0.151
0.154 0.172
Substrate only readings were averaged from eight wells, and = 0.000 Readings from sample wells were averaged from two wells All readings taken 4 h after addition of substrate PCV-status of all samples confirmed by ISEM (Chapter 2.3.2) *All antisera were used at 1 µg/ml
129
Chapter 4: Serological Techniques
No significant difference was observed between PCV-containing and PCV-free samples, when non-absorbed unaltered PCV-PAs was used.
The ELISA values
obtained using cross-absorbed antisera were consistently lower (4-10×) than the values observed in wells which were not cross-absorbed. ELISA values from cross-absorbed wells were also much more consistent within replicates, than wells which were not cross-absorbed. Based on these results it was decided to further explore the apparent success of PTA-ELISA in differentiating PCV-infected from PCV-free pineapple preparations. 4.3.3.2
Different dilutions of detecting antiserum As the spectrophotometric values obtained from the previous PTA-ELISA were
quite low, it was decided to compare several higher concentrations of detecting PCVPAs to determine if this improved the distinction between PCV-infected and PCV-free pineapple samples. Four concentrations (10 µg/ml, 3.3 µg/ml, 1.6 µg/ml and 1 µg/ml) of detecting antiserum, cross-absorbed with PCV-free seedling pineapple sap were used in PTA-ELISA. Increasing the concentration of detecting PCV antiserum did increase the ELISA values obtained (Table 4.7).
However, in this test there was no clear distinction
between ELISA values for PCV-infected and PCV-free extracts.
Even when the
detecting antiserum was used at 1 µg/ml (the concentration previously used), no significant difference between PCV-containing and PCV-free samples was observed. This reaction also produced much higher background reactions than the previous assay, with “buffer only” wells giving readings ca. 25× higher (at 1 µg/ml) than in the previous assay. When this protocol was repeated using larger numbers of samples, at no time was any clear, consistent distinction between PCV-containing and PCV-free (as determined by ISEM) extracts observed (data not shown).
130
Chapter 4: Serological Detection
Table 4.7: Comparison of PCV-PAs concentration for the detection of PCV using PTA-ELISA
Detecting PCV-PAs * Sample 10 µg/ml
3.3 µg/ml
1.6 µg/ml
1 µg/ml
Buffer
0.239 ± 0.005
0.063 ± 0.030
0.039 ± 0.000
0.048 ± 0.002
Seedling
0.302 ± 0.061
0.113 ± 0.054
0.063 ± 0.017
0.097 ± 0.025
PCV/PBV
0.331 ± 0.050
0.164 ± 0.009
0.129 ± 0.002
0.127 ± 0.019
Substrate only readings were averaged from eight wells, and = 0.000 Readings from sample wells were averaged from two wells All readings taken 4 h after addition of substrate Seedling pineapples determined to be PCV-free by ISEM, and virus containing samples were also confirmed by ISEM (Chapter 2.3.2) *All antisera used were crossabsorbed with seedling pineapple leaf sap
4.3.4
Staphylococcus protein A-ELISA (SPA-ELISA) SPA-ELISA involves the adhesion of antibodies to a layer of Staphylococcus
protein A coated onto the wells (Figure 4.2C). SPA-ELISA allows the use of crude antiserum, negating the need for purified IgG, and uses a commercially available conjugate so that detecting antibodies need not be enzyme conjugated. It generally provides greater sensitivity than PTA-ELISA. Wells were coated with 1 µg/ml SPA (Sigma Cat #P 9650) in carbonate coating buffer for 2 h.
PCV-PAs IgG (1996) diluted to 10 µg/ml, 3 µg/ml, 1 µg/ml and
0.3 µg/ml in PBS-Tween was added to each well, and the plate incubated for 2 h. Leaf sap extract was added to each well, and the plate incubated overnight at 4oC. PCV-PAs was diluted 1/1000 in PBS-Tween and cross-absorbed with a 1/30 dilution of PCV-free pineapple seedling leaf sap extract added to each well, and the plate incubated for 2 h.
131
Chapter 4: Serological Techniques
SPA- conjugate (SPA-AP) diluted 1/1000 with PBS-Tween was added to each well, and the plate incubated for 2 h. No significant difference was observed between PCV-infected and PCV-free seedling samples, regardless of the concentration of PCV-IgG (1996) coating antibodies (Table 4.8). Conversely, in a control experiment all three concentrations of Lettuce mosaic virus (LMV) antisera used in the same SPA-ELISA, displayed a clear difference between LMV-infected Chenopodium quinoa leaf extracts and healthy C. quinoa leaf extracts (Table 4.8).
Table 4.8:
Detection of PCV using SPA-ELISA
Sample
Coating Antibodies 3.3 µg/ml
1 µg/ml
0.3 µg/ml
0.007 ± 0.001
0.007 ± 0.000
0.007 ± 0.000
0.004 ± 0.000
0.004 ± 0.000
0.004 ± 0.000
0.555 ± 0.005
0.542 ± 0.002
0.603 ± 0.009
Buffer (PCV)
0.245 ± 0.007
0.217 ± 0.007
0.216 ± 0.006
Seedling #1
0.129 ± 0.054
0.091 ± 0.075
0.131 ± 0.015
Seedling #2
0.162 ± 0.030
0.159 ± 0.022
0.168 ± 0.003
Seedling #3
0.158 ± 0.005
0.136 ± 0.003
0.139 ± 0.006
PCV #1
0.113 ± 0.006
0.093 ± 0.006
0.076 ± 0.002
PCV #2
0.076 ± 0.014
0.068 ± 0.006
0.071 ± 0.006
PCV #3
0.161 ± 0.002
0.187 ± 0.001
0.173 ± 0.005
PCV #4
0.046 ± 0.010
0.043 ± 0.003
0.038 ± 0.000
PCV #5
0.046 ± 0.007
0.054 ± 0.007
0.040 ± 0.002
Buffer (LMV) Healthy C. quinoa LMV-infected C. quinoa
Substrate only readings were averaged from eight wells, and = 0.000 Readings from sample wells were averaged from two wells All readings taken 4 h after addition of substrate Seedling pineapples determined to be PCV-free by ISEM, and virus containing samples were also confirmed by ISEM (Chapter 2.3.2) All antisera used were cross-absorbed with seedling pineapple leaf sap 132
Chapter 4: Serological Detection
4.3.5
Dassanayake PCV ELISA An ELISA system developed by Dassanayake et al. (1994), using PCV-PAs was
reported to distinguish between MBW-affected pineapple plants and symptomless plants in Sri Lanka.
The three bleeds of PCV-PAs which produced the highest
spectrophotometric readings in PTA-ELISA (Table 4.6) were used to repeat the ELISA format of Dassanayake et al. (1994). Wells were coated with 100 µl of sample extracts (0.1 g of basal leaf tissue ground in 1 ml of carbonate coating buffer, and centrifuged for 3 min at 12 000 g), and the plate incubated at 4oC for 18 h. Blocking reagent (100 µl of 1% (w/v) skim milk powder in carbonate coating buffer) was added to each well, and the plate incubated for 1 h. PCV-PAs bleeds were diluted to 0.25 µg/ml in PBS-Tween, and used as detecting antibody with 100 µl added to each well for 6 h. SPA-AP (100 µl) diluted 1/1000 in PBS -Tween, was added to each well and the plate incubated for 6 h. No significant difference was observed between PCV-infected pineapple, PCVfree seedling pineapple and virus-free bromeliad plant extracts when analysed using Dassanayake’s ELISA method (Table 4.9).
Conclusions The two DAS-ELISA’s performed in this study did not work at all. As no positive control was available there is no way of knowing whether experimental conditions were suitable for any ELISA to work. Therefore these results did not give a true indication of the effectiveness of PCV-IgG and PCV-IgG-AP in DAS-ELISA. Although initially promising, PTA-ELISA was later shown to be unable to distinguish between PCV-free and PCV-infected pineapple samples. This was most likely caused by the low levels of PCV-specific antibodies in the antiserum, which 133
Chapter 4: Serological Techniques
contains antibodies specific for PCV, PBV and pineapple protein. Even after crossabsorption of PCV-PAs with PCV-free pineapple seedling sap, the proportion of antibodies specific for pineapple proteins were too high for the effective detection of PCV. Using higher concentrations of PCV-free pineapple sap to cross-absorb PCV-PAs may reduce background reactions, but were not attempted in this study.
Table 4.9:
Sample
Comparison of PCV-PAs bleeds used in Dassanayake protocol
PCV-PAs Coating Antibodies (23-11-1992)
(13-01-1993)
(10-02-1993)
Buffer
0.029 ± 0.022
0.107 ± 0.026
0.062 ± 0.007
Seedling #1
0.318 ± 0.010
0.364 ± 0.045
0.053 ± 0.008
Seedling #3
0.419 ± 0.012
0.521 ± 0.052
0.085 ± 0.014
Seedling #4
0.422 ± 0.009
0.519 ± 0.044
0.108 ± 0.011
Seedling #5
0.484 ± 0.011
0.542 ± 0.041
0.110 ± 0.011
PCV #5
0.277 ± 0.014
0.355 ± 0.038
0.040 ± 0.012
PCV #9
0.096 ± 0.030
0.058 ± 0.020
0.139 ± 0.002
PCV #12
0.247 ± 0.005
0.390 ± 0.060
0.034 ± 0.017
PCV #13
0.263 ± 0.046
0.362 ± 0.027
0.041 ± 0.019
PCV #14
0.348 ± 0.015
0.482 ± 0.040
0.062 ± 0.011
Substrate only readings were averaged from eight wells, and = 0.000 Readings from sample wells were averaged from two wells All readings taken 2 h after addition of substrate Seedling pineapples determined to be PCV-free by ISEM, and virus containing samples were also confirmed by ISEM (Chapter 2.3.2) SPA-ELISA also failed to distinguish between PCV-infected and PCV-free pineapple samples (as defined in Chapter 4.2.3).
The low titre of PCV-specific
antibodies, and the contamination of PCV-PAs with antibodies specific to antigens
134
Chapter 4: Serological Detection
other than PCV, even after cross-absorption with PCV-free pineapple sap, contributed significantly to the failure of SPA-ELISA to reliably detect PCV particles. The ELISA protocol of Dassanayake et al. (1994) was attempted using Australian isolates of PCV and three bleeds of PCV-PAs. However, no significant distinction between PCV-free seedling and PCV-infected pineapple samples was produced. This failure may be due in part to differences between Australian and Sri Lankan isolates of PCV, or more likely the unreliable nature of PCV-PAs in ELISA. Perhaps indicating that Dassanayake et al. (1994) may have experienced the same misleading results, initially obtained using PTA-ELISA in this study.
4.4
MONOCLONAL ANTIBODY PRODUCTION PCV-PAs was found to be unsuitable for use in the specific detection of PCV by
ELISA (Wakman, 1994; Chapter 4.3).
The production of a second PAs was not
undertaken, as although purification techniques had improved since the production of PCV-PAs, virus preparations were still contaminated with significant numbers of PBV particles, and diverse pineapple proteins, and were not considered suitable for good PAs production. Conversely, virus-specific MAb can be produced from virus preparations of low purity, containing many different antigens (Harlow and Lane, 1988). The production of antibodies specific to a single antigen from mixed antigen preparations, is made possible by the immune systems ability for a single cell to only produce a single antibody. MAb are produced by hybridomas formed from the fusion of spleen cells (lymphocytes) from an inoculated animal with myeloma cells.
Single antibody
producing hybridomas are separated out during the cloning process, giving rise to
135
Chapter 4: Serological Techniques
individual cell lines producing an antibody with specificity for one epitope. Each of these MAb is then screened for their specificity to the desired antigen (virus).
Aim To produce monoclonal antibodies specific to either PCV or PBV.
Experimental Design and Results 4.4.1
Hybridoma production Mice were selected for the production of monoclonal antibodies due to their
small body size (requiring smaller amounts of antigen for injections) and availability of compatible mouse myeloma cells (from line P3-X63Ag8 first described by Köhler and Milstein, 1975). 4.4.1.1
Injection of mice Mice were injected with purified virus preparations (Chapter 3.5.3) containing
both PBV and PCV particles.
Virus-infected tissue came from C10 and CF-180
pineapple leaves collected from the Harris Farm in Moggill and C10, C30 and CF-180 pineapple crowns from the Glasshouse Mountains. Virus preparations were observed by electron microscopy (Chapter 2.3.1) to determine virus particle numbers and purity of each preparation. A 5 µl aliquot of virus from each injection was stored at -70oC. In subsequent analysis by ISEM (Chapter 2.3.2), injected virus preparations were found to contain 7-8 PCV particles and 2-3 PBV particles per field of view, with host tissue contamination. A typical preparation is shown in Figure 4.3. Each mouse was injected three to four times prior to fusion. All injections were delivered to the peritoneal cavity. The first two injections were combined with an immuno-stimulant, Gerbu adjuvant (Chapter 2.6.2.3) to promote antibody formation. All subsequent (final) injections contained virus only. The exact injection history of each mouse is presented in Appendix 2. 136
Chapter 4: Serological Detection
100 nm
Figure 4.3:
Electron micrograph of a purified virus preparation injected into
mice
137
Chapter 4: Serological Techniques
Back of figure 4.3
138
Chapter 4: Serological Detection
4.4.1.3
Dissection of spleen and fusion with myeloma cells Five days after the final injection, the mouse was euthanased, the spleen
removed and teased apart to release as many lymphocytes as possible. The fusion was performed by adding the warm PEG fusogen to a cell suspension containing two myeloma cells to every lymphocyte. Hybridomas were plated out into 96-well plates containing 2× HAT medium and either macrophage feeder cells (Chapter 2.6.4) or OPI Media Supplement (Hybri-MaxR Sigma Alderich, Cat #: O 5003). For complete details of the fusion technique refer to Chapter 2.6.5. 4.4.1.4
Hybridoma maintenance Once hybridomas had been produced, they were left untouched at 37oC (in a
CO2 incubator) for 3 days, after which a quick scan of each plate was made by eye, to check for gross contamination. After 5-7 days the cells were observed under a light microscope for contamination, and fed with HAT medium. From the tenth day after fusion, colonies were observed every day, and supernatants from all colonies of suitable size (30-60% confluent) were screened for MAb specific to PCV and PBV using the screening assay described below. Hybridomas were fed with HAT medium for at least 2 weeks following fusion, and then HT medium for the following 2 weeks, and finally after at least 4 weeks of continuous culture cells were fed with C-15 medium.
4.4.2
Detecting monoclonal antibodies ELISA was selected to screen hybridoma supernatants for PCV or PBV-specific
MAb, due its ability to test large numbers of samples efficiently. 4.4.2.1
ELISA controls No PCV- or PBV-specific MAb were available for use as positive controls in the
ELISA used to screen hybridoma supernatants. This problem was alleviated to some extent by using a range of other controls. Extraction buffer, and tissue culture media only wells were included to test for ingredients that may interfere with the ELISA 139
Chapter 4: Serological Techniques
reaction. Bromeliad tissue was used as virus-free tissue to detect host plant proteinspecific MAb. Initially, PCV-IgG (1996) was used with GAR-AP as a control, to ensure that suitable conditions for a successful ELISA reaction were used, until a MAb specific for virus-free bromeliad became available. 4.4.2.2
TAS-ELISA Hybridoma supernatants were screened for virus-specific MAb using a triple
antibody sandwich-ELISA (TAS-ELISA; Figure 4.2D). All steps were carried out as previously described (Chapter 4.3.1) unless otherwise stated. A typical plate layout used for supernatant screening is shown in Figure 4.4. A mixture of two IgG preparations, similar to those used in ISEM (Chapter 2.3.2) was used to trap PCV and PBV particles during ELISA screening, namely PCVIgG (1996) and BSV Broadspectrum IgG (B.E.L. Lockhart).
The latter became
available after the ISEM screening of other badnavirus PAs (Table 4.3) and was found to be intermediate between SCBV-4Mx and BSV-SB in effectiveness (data not shown). Plates were coated with 10 µg/ml of PCV-IgG (1996) and 5 µg/ml of BSV Broadspectrum IgG and incubated for 2 h. Partially purified preparations (Chapter 3.5.2) of PCV and PBV-infected pineapples and virus-free bromeliad plants (stored at -70oC, and thawed immediately before use) were added overnight at 4oC. Hybridoma supernatants were diluted 1:1 with 5% (w/v) skim milk powder in PBS-Tween and incubated for 2 h. MAb were detected using sheep anti-mouse alkaline phosphatase (SAM-AP) enzyme conjugate for 3 h at 37oC.
4.4.3
Cloning hybridomas Hybridoma colonies were twice cloned at limiting dilution to ensure that all of
the cells in the colony were derived from a single cell
140
PBV/PCV Extract
Virus-free Bromeliad
1
2
3
4
5
6
7
8
9
10
11
12
A
Buffer
Buffer
E
E
M
M
Buffer
Buffer
E
E
M
M
B
HAT
HAT
F
F
N
N
HAT
HAT
F
F
N
N
C
PCV IgG-AP
PCV IgG-AP
G
G
O
O
PCV IgG-AP
PCV IgG-AP
G
G
O
O
D
MAb V 3H5
MAb V 3H5
H
H
P
P
MAb V 3H5
MAb V 3H5
H
H
P
P
E
A*
A*
I
I
Q
Q
A
A
I
I
Q
Q
F
B
B
J
J
R
R
B
B
J
J
R
R
G
C
C
K
K
S
S
C
C
K
K
S
S
H
D
D
L
L
T
T
D
D
L
L
T
T
*The same letter represents the same hybridoma supernatant. Figure 4.4:
Typical plate layout for hybridoma supernatant screening
141
Chapter 4: Serological Techniques
4.4.3.1
Cloning of hybridoma cells Once hybridoma supernatants had been screened and determined to contain
MAb of interest, the colony was cloned by one of two methods (described below) and some of the cells stored under liquid N2 (using the same method as for myeloma cells). The choice of the initial cloning method was usually based on time constraints. If possible limiting dilution cloning was performed, but if time was short ‘quick’ cloning was performed. Eventually however, all colonies of interest were cloned by limiting dilution twice. ‘Quick’ cloning Wells containing colonies that were 60-75% confluent, were cloned directly from the well into another 96-well plate. Cells (100 µl) were scraped from the bottom of the well using a transfer pipette, and placed in the top left hand corner well of a 96-well plate containing 100 µl of medium (HAT, HT or C-15 depending upon the colonies age when cloned). Cells were diluted (1:1) from this well by transferring half of the contents of the well into the next well, and mixing gently. Serial dilution of cells continued down the first column with a single pipette, and then across the rows of wells with a multi-channel pipette (Figure 4.5A). Limiting dilution cloning Cells from wells that were 40-60% confluent were transferred to a sterile 1.5 ml centrifuge tube, and the number of cells counted using a haemocytometer. Once the number and concentration of cells was determined, cells were plated out at concentrations of 1, 10 and 100 cells per well (Figure 4.5B). 4.4.3.2
Screening cloned hybridomas After 2-3 days cloning plates were observed, and wells containing single
colonies (most likely formed from single cells) were marked. Single cell colonies were
142
Chapter 4: Serological Detection
1
2
3
4
5
6
7
8
9
10
11
12
A B C D E F G H (A) “Quick” cloning 100 cells/well 1
2
3
10 cells/well 4
5
6
7
1 cells/well 8
9
10
11
12
A B C D E F G H (B) Limiting dilution cloning Figure 4.5:
Diagram of dilution cloning techniques; (A) “Quick” cloning and (B)
Limiting dilution cloning
143
Chapter 4: Serological Techniques
screened for MAb production once they had reached a suitable size (usually 25-30% confluent). Two to three positive screening colonies were then cloned by limiting dilution a second time. Once a colony had been limiting dilution cloned twice, cells were transferred into 24-well plates, and eventually to flasks to grow up sufficient quantities of supernatant for other tests. At each stage of cloning, cells were stored under liquid nitrogen.
4.4.4
Details of hybridomas produced Seven fusions were performed and five of these (II, IV, V, VI, and VII) resulted
in hybridomas. Fusion I was contaminated with no hybridomas screened. Fusion IV also experienced problems with contamination, and only a small number of the total hybridomas could be screened. The source of contamination was isolated soon after this fusion (Chapter 4.4.5), and Fusions V-VII were contamination-free. The first two fusions were performed using macrophage feeder cells, (Chapter 2.6.4) and in subsequent fusions OPI Media Supplement was used. A total of 1 462 hybridomas were produced and screened for PCV or PBVspecific MAb production (Table 4.10).
One MAb produced in Fusion VII
(MAb VII 2H5) gave a strong positive reaction to virus containing extracts, and a negative reaction with bromeliad extracts. Details of all positive screening colonies are presented in Table 4.11, and include three weak positives which initially looked promising, but gave spurious results after cloning. Several positives to both virus and bromeliad extracts, and also, a strong positive to bromeliad (V 3H5; Table 4.11) tissue only were detected.
4.4.5
Determining the source of hybridoma culture contamination The first two fusions (I and II) and several sets of myeloma cultures, were
infected with a contaminating organism, the identity and source of which was uncertain.
144
Chapter 4: Serological Detection
No mycoplasmas were detected in media, media ingredients or cell cultures from Fusion I, when tested using the Mycoplasma Detection Kit, Enzyme Immunoassay, (Boehringer-Mannheim, Cat # 1296 744).
Table 4.10:
Results of Fusions
Fusion
Total Number of Colonies Screened
Comments
I*
0
Contaminated
II*
216
Very small number of hybridomas produced
IV^
49
Contaminated
V^
593
One positive screening colony
VI^
142
Mouse had tumorous growth
VII^
462
Eight positive screening colonies
* Using macrophage feeder cells ^ Using OPI media supplement After observing contaminated myeloma flask cultures under a light microscope, what appeared to be bacterial cells were noticed growing over the top of myeloma cells. In order to help determine the source of infection, the contaminant was analysed by the Australian Collection of Microorganisms, at the University of Queensland. The bacterial contaminant was identified as being a mixed infection of Clavibacter michiganense subsp. michiganense and Curtobacterium luteum (personal communication Mrs Susan Ben Dekhil). However, as stocks of Curtobacterium species were kept in the same liquid N2 Dewar as the myeloma cell stocks, this organism was thought to be the cause of the problem.
Subsequent testing of all media, media 145
Chapter 4: Serological Techniques
ingredients and frozen myeloma cell stocks showed the myeloma cells to be the source of contamination. A new stock of myeloma cells was obtained from another source (Bronwyn Venus, Animal Research Institute, Queensland Department of Primary Industries, Yeerongpilly), and no further contamination problems were experienced.
Table 4.11: Summary of monoclonal antibodies which gave positive screening reactions
Monoclonal antibody
Reaction in Screening Assay against#
Comments
PCV /PBV
Bromeliad
V 3H5
Strong positive
Strong positive
Used as a positive control for screening assay
VII 2H5
Strong positive
Negative
Not specific to PBV or PCV after detailed tests
VII 5D3
Weak positive*
Negative
Gave spurious results after initial cloning
VII 8C5
Weak positive*
Negative
Gave spurious results after initial cloning
VII 6B6
Weak positive*
Negative
Gave spurious results after initial cloning
VII 2A8
Strong positive
Strong positive
Used as a positive control for screening assay
VII 8H1
Weak positive
Weak positive
discarded
VII 2C4
Weak positive
Weak positive
discarded
VII 4B12
Negative
Weak positive
discarded
*These MAb produced inconsistent results after cloning, and so were discarded.
4.4.6
Determining the specificity of monoclonal antibodies After testing positive in the screening assay and undergoing two rounds of
limiting dilution cloning, MAb were put through the following sequence of tests to determine their specificity. In the interests of brevity, the results of each test are given only for MAb VII 2H5, which was the most promising, and consequently the most 146
Chapter 4: Serological Detection
stringently tested of all the MAb produced. 4.4.6.1
Decoration of virus particles PCV and PBV particles were not decorated (Chapter 2.3.3) with MAb VII 2H5
from either straight supernatants, or supernatants concentrated 10× by (NH4)2SO4 precipitation. The dark staining spheres of gold conjugated antibodies are much more easily observed under the electron microscope than antibodies alone, and allow the visualisation of lightly decorated virus particles.
However, neither PCV nor PBV
particles were decorated with a 10× concentrated MAb VII 2H5 suspension and goat anti-mouse IgG gold conjugate (Sigma Bio Sciences, Cat #: G-7527) (Chapter 2.3.4). 4.4.6.2
Determining the isotype of MAb VII 2H5 MAb VII 2H5 was determined to be an IgM molecule using an Ig isotyping kit
(Sigma Immuno Chemicals, Cat #: M-6032, M-5532, M-5657, M-5782, M-5907 and M-6157 respectively).
This result seemed to partially explain the difficulties in
decoration tests, as IgM molecules do not usually produce heavy decoration on particles (Harlow and Lane, 1988). This also explained the negative result of the gold labelling test because the gold-labelled antibodies were specific to mouse IgG. 4.4.6.3
Determining specificity using coating antibodies An attempt to determine whether MAb VII 2H5 was specific to PBV or PCV
was made using TAS-ELISA. The ELISA method was the same as the screening assay, and used different combinations of coating antibodies to determine the antigen specificity of MAb VII 2H5. PCV-IgG (1996) (10 µg/ml in carbonate coating buffer) and BSV Broadspectrum IgG (5 µg/ml in carbonate coating buffer) were used singly and in combination to coat separate sets of wells. Leaf sap extracts (Chapter 2.3.1) and partially purified preparations (Chapter 2.3.2) of PCV and PBV-infected pineapples, PCV-free seedling pineapples (containing PBV) and virus-free bromeliads were used as
147
Chapter 4: Serological Techniques
antigen. MAb VII 2H5 supernatant was used diluted 1:1 with 5% (w/v) skim milk powder in PBS-Tween, and detected using SAM-AP diluted 1/2000 in PBS-Tween. This assay showed quite clearly that MAb VII 2H5 was only detecting antigen trapped by PCV-IgG (1996), as wells containing only BSV Broadspectrum IgG coating antibodies did not give positive readings (Table 4.12). These results indicate that MAb VII 2H5 was specific to an antigen trapped by PCV-PAs, which may have been PCV. 4.4.6.4
Removing high background High background ELISA values, which were approximately half of the lowest
PCV-infected sample readings, were obtained with PCV-free (ISEM) seedling pineapples. The blocking agents skim milk and heparin were used to try and lower background reactions, however, no significant difference was observed between wells containing either reagent or wells without blocking (Table 4.13). 4.4.6.5
Titration of Antibody titre A working concentration for the use of MAb VII 2H5 to detect PCV in
TAS-ELISA was determined by testing a series of supernatant concentrations ranging from 1 to 1/512 diluted in 5% (w/v) skim milk powder in PBS-Tween (Table 4.14). Supernatant dilutions 1:8 and 1:16 gave suitable reactions after the substrate solution had been incubated at room temperature for 1 h, and so it was decided that a 1:10 dilution was suitable for routine use. 4.4.6.6
ELISA testing of plant samples The first definite indication that MAb VII 2H5 might not be specific to either
PCV or PBV was seen when large numbers of samples were tested in TAS-ELISA. Leaf sap extracts (Chapter 3.5.1) and partially purified preparations (Chapter 3.5.2) of PBV-infected, PCV-free seedling pineapples, PCV and PBV-infected field pineapples and PCV and PBV-free bromeliad were used in ELISA and ISEM tests.
148
Table 4.12: Specificity of MAb VII 2H5 by TAS-ELISA
Coating IgG
Detecting Antibody
Plant Extracts
PCV / BSV Bromeliad
PCV
PCV/PBV
Bromeliad
BSV PCV/PBV
Bromeliad
PCV/PBV
Media only
0.010
0.011
0.029
0.011
0.006
0.06
0.011
0.007
0.008
0.007
0.009
0.006
PCV IgG-AP
0.031
0.028
0.296
0.248
0.030
0.027
0.275
0.236
0.016
0.013
0.011
0.013
HT MAb
0.353
0.384
0.084
0.058
0.316
0.312
0.024
0.021
0.135
0.158
0.287
0.283
VII 2H5
0.010
0.011
0.147
0.120
0.010
0.009
0.136
0.123
0.026
0.025
0.012
0.013
VII 2H5
0.017
0.017
0.140
0.120
0.014
0.013
0.116
0.128
0.030
0.027
0.016
0.015
VII 2H5
0.012
0.011
0.136
0.112
0.008
0.010
0.112
0.122
0.024
0.019
0.013
0.010
Substrate only readings were averaged from 12 wells, and = 0.000 Readings from sample wells were averaged from two wells All readings taken 3 h after addition of substrate PCV status of all plant extracts was confirmed by ISEM (Chapter 2.2.2) HT MAb = monoclonal antibody which reacts to both virus and bromeliad preparations
149
Chapter 4: Serological Detection
Table 4.13:
Comparison of different blocking reagents used in TAS-ELISA
Sample
No blocking
Skim Milk
Heparin
Buffer
0.007 ± 0.000
0.004 ± 0.002
0.005 ± 0.001
Bromeliad
0.005 ± 0.000
0.008 ± 0.004
0.007 ± 0.002
Seedling #6
0.068 ± 0.004
0.054 ± 0.007
0.039 ± 0.003
Seedling #8
0.082 ± 0.006
0.064 ± 0.007
0.044 ± 0.001
Seedling #9
0.100 ± 0.006
0.080 ± 0.002
0.053 ± 0.004
PCV #5
0.138 ± 0.004
0.113 ± 0.007
0.078 ± 0.007
PCV #8
0.139 ± 0.001
0.123 ± 0.008
0.084 ± 0.003
PCV #10
0.162 ± 0.002
0.141 ± 0.000
0.092 ± 0.003
Virus particles were trapped using PCV-PAs, detected with MAb VII 2H5 and sheep anti-mouse alkaline phosphatase conjugate Substrate only readings were averaged from eight wells, and = 0.000 Readings from sample wells are means ± standard deviation, with n = 2. All readings taken 1 h after addition of substrate PCV # samples are PCV infected, Seedling # samples are PCV free PCV-status of all samples confirmed by ISEM (Chapter 2.3.2) Initial ELISAs using MAb VII 2H5 produced results indicating that seedling plants (PCV-free, but PBV-infected) had high background reactions when compared to bromeliad samples, but were significantly lower (ca. 3×) than PCV-infected pineapple samples (data not shown). These results were consistent for a period of several months (over winter). With the onset of warmer weather (Spring), ELISA values obtained from seedling pineapple extracts became indistinguishable from PCV-infected field pineapples.
In spring partially purified preparations (Chapter 3.5.2) of PCV-free
pineapple seedlings and PCV-infected field pineapples produced similar ELISA values
150
Chapter 4: Serological Detection
(Table 4.15). However, when leaf sap extracts (Chapter 3.5.1) were used, PCV-free samples produced ELISA values ca. 2× higher than PCV-infected samples (Table 4.15). Bromeliad extracts prepared in either manner consistently produced very low absorbance values.
Table 4.14:
Titration of MAb VII 2H5 working concentration for TAS-ELISA
Detecting Antibody
ELISA Value
1*
0.298 ± 0.001
1:2*
0.326 ± 0.006
1:4*
0.332 ± 0.005
1:8*
0.271 ± 0.001
1:16*
0.235 ± 0.004
1:32*
0.187 ± 0.001
1:64*
0.149 ± 0.009
1:128*
0.093 ± 0.001
1:256*
0.066 ± 0.008
1:512*
0.057 ± 0.018
Buffer
0.022 ± 0.007
PCV IgG-AP
2.829 ± 0.115
Substrate only readings were averaged from eight wells, and = 0.000 Readings from sample wells were averaged from two wells All readings taken 1 h after addition of substrate Virus samples also confirmed by ISEM (Chapter 2.3.2) * Dilution of monoclonal antibody in PBS-Tween
151
Chapter 4: Serological Detection
4.4.6.7
ELISA testing of a virus purification gradient It was decided to determine whether the antigen to which MAb VII 2H5 was
specific, and PCV and PBV particles, could be separated by density gradient purification.
Table 4.15:
Testing of seedling pineapple plants with MAb VII 2H5 ELISA
Partially Purified Extract
Leaf Sap Extract
Sample
ELISA Values
Sample
ELISA Values
Buffer
0.005 ± 0.000
Buffer
0.005 ± 0.000
Bromeliad
0.006 ± 0.001
Bromeliad
0.006 ± 0.001
PCV #1
0.343 ± 0.005
PCV #4
0.438 ± 0.005
PCV #2
0.286 ± 0.005
PCV #5
0.290 ± 0.000
PCV #3
0.398 ± 0.019
PCV #6
0.306 ± 0.004
Seedling A
0.240 ± 0.005
Seedling I
0.646 ± 0.002
Seedling B
0.328 ± 0.008
Seedling J
0.650 ± 0.007
Seedling C
0.312 ± 0.005
Seedling K
0.616 ± 0.000
Seedling D
0.332 ± 0.013
Seedling L
0.584 ± 0.015
Seedling E
0.315 ± 0.002
Seedling M
0.714 ± 0.010
Seedling F
0.294 ± 0.009
Seedling N
0.633 ± 0.018
Seedling G
0.272 ± 0.007
Seedling O
0.616 ± 0.007
Seedling H
0.237 ± 0.008
Seedling P
0.770 ± 0.015
Substrate only readings were averaged from eight wells, and = 0.000 Readings from sample wells were averaged from two wells All readings taken 1 h after addition of substrate PCV # samples are PCV infected, Seedling # samples are PCV free PCV-status of samples was confirmed by ISEM (Chapter 2.3.2) CsCl gradients (Chapter 3.4.4.2) of partially purified PCV-infected pineapple, PCV-free seedling pineapple, virus-free bromeliad and extraction buffer were compared
152
Chapter 4: Serological Detection
by ISEM (Chapter 4.2.3.1) for PCV content, and TAS-ELISA using MAb VII 2H5. All extracts were observed for virus by ISEM (Chapter 2.3.2) before the running of CsCl gradients, and each fraction of bromeliad, seedling and PCV gradients after fractionation. The highest PCV particle concentration was found in fractions 6 and 7 (CsCl density of ca. 1.31g/cm3), while the highest ELISA values were found in fraction 5 (Table 4.16).
This is further accentuated by the fact that no PCV particles were
observed in fraction 5 of the seedling lane, in which the ELISA value was similar to that of fraction 6 in the virus gradient, where PCV particles were easily observed. Indicating that the antigen to which MAb VII 2H5 was specific, was not present on PCV particles.
Conclusions No PCV or PBV-specific MAb were produced in this study. Although initially quite promising, MAb VII 2H5 was eventually determined to be specific to an antigen not present on either PCV or PBV particles. This conclusion was confirmed after MAb VII 2H5 failed to decorate PCV or PBV particles in decoration and gold labelling tests. The definitive test for MAb VII 2H5 specificity was the CsCl gradient ELISA. The examination of density gradients by ISEM and ELISA, showed the antigen to which MAB VII 2H5 was specific not to be present in the same fraction as PCV particles.
4.5
DISCUSSION ISEM was the only consistently reliable form of routine diagnostic test for both
PBV and PCV particles developed in this study. The procedure of Wakman (1994; Wakman et al., 1995) was improved by the addition of SCBV-4Mx to PAs for trapping particles, which increased the detection of PBV particles. While trialing various PAs 153
Table 4.16: Fraction
Density Gradient Separation of MAb VII 2H5 ELISA Positive Proteins Blank
Bromeliad
Seedling
Dens.
ELISA
Dens.
ELISA
ISEM
1
1.180
0.012
1.146
0.025
-
2
1.218
0.022
1.152
0.024
3
1.217
0.036
1.183
4
1.247
0.026
5
1.275
6
Dens.
ELISA
ISEM
Dens.
ELISA
ISEM
-
1.178
0.030
-
1.146
0.027
-
0.021
-
1.170
0.037
-
1.171
0.030
-
1.224
0.018
-
1.208
0.063
-
1.203
0.181
-
0.008
1.266
0.036
-
1.251
0.138
-
1.240
0.345
+
1.280
0.018
1.322
0.025
-
1.288
0.028
-
1.280
0.105
++++
7
1.307
0.023
1.381
0.030
-
1.332
0.031
-
1.326
0.068
+++
8
1.337
0.026
1.438
0.020
-
1.373
0.042
-
1.392
0.044
++
9
1.390
0.023
1.490
0.026
-
1.436
0.029
-
1.440
0.049
-
10
1.439
0.024
1.536
0.034
-
1.493
0.030
-
1.490
0.028
-
Substrate only readings were averaged from eight wells, and = 0.000 Readings from sample wells were averaged from two wells All readings taken 3 h after addition of substrate + = 4-5 full length particles per field of view under ×40 000 TEM Density at which PCV particles are expected ie: ca. 0.131 (1.31 gcm-3)
154
PCV / PBV
Chapter 4: Serological Detection
for specificity to PCV and PBV, no serological relationship was found between two PAs specific for closteroviruses (CTV-OSP, and HV-6) and one PAs specific for a vitivirus (HLV) and PCV particles.
An interesting serological relationship was
demonstrated between SCBV-4Mx, PCV-PAs and PBV particles in ISEM trapping and decoration experiments. SCBV-4Mx was more successful at trapping PBV particles than PCV-PAs, but PCV-PAs showed a higher dilution end point for decoration of particles. This would seem to suggest that the Ig present in SCBV-4Mx have a higher affinity for PBV particles (ie: stronger covalent bonds), while PCV-PAs has a larger number of PAb specific to PBV particles. Alternatively, SCBV PAs may have a higher homologous titre of PBV-specific PAb, but these PAb only react with some of the epitopes on the PBV particle. SCBV-4Mx might trap fairly effectively because there are so many antibodies, even though they only bind to limited sites on the PBV particle. However, the limited binding sites may mean SCBV-4Mx produces less visible decoration compared to PCV-PAs, which would react to all the epitopes on PBV. The problem of false negatives experienced by Wakman (1994) was alleviated to some extent by the development of an exhaustive testing process for PCV and PBV in pineapple samples. This process involved the testing of plants by several samplings before recognising them as PCV-free. The lack of sensitivity of ISEM may be due in part to the low particle numbers present in infected plants, with both closteroviruses (Bar-Joseph et al., 1995) and badnaviruses (Lockhart and Olszewski, 1994) usually found in very low concentrations in infected plants. The nature of ISEM assays also means that only small amounts of plant tissue can be analysed and virus particles may be missed, especially if the virus is unevenly distributed in the plant (Matthews, 1991). However, when the somewhat exhaustive process described above was followed I am confident that any samples which consistently tested negative, were in fact free of both PCV and PBV particles. 155
Chapter 4: Serological Detection
Although different types of ELISA have been shown to be able to compensate for certain deficiencies in the assays ingredients (Crowther, 1995), the effectiveness of any serological detection system relies heavily on the quality of the antiserum used. In this case the main problem associated with detecting PCV by ELISA stems from the low specific titre of PCV-PAs for PCV (Wakman, 1994). This lack of specificity was most likely caused by the large number (18) of injections of low purity virus preparations used to produce PCV-PAs. The impurities in injected preparations resulted in the production of numerous antibodies to pineapple proteins, and of course PBV particles. PCV-PAs was shown not to be suitable for use as a detecting antiserum in SPA-ELISA, while PTA-ELISA with PCV-PAs was inconclusive. BSV Broadspectrum IgG was determined to be better for use in ELISA (B.E.L. Lockhart), based on its superior trapping ability (compared to SCBV-4Mx) in ISEM tests. PCV-PAs was used in conjunction with BSV Broadspectrum IgG to trap PCV and PBV particles in TASELISA screening tests of hybridoma supernatants for PCV or PBV-specific MAb. No MAb specific to PCV or PBV were produced in this study. One factor which may have influenced this outcome is the small numbers of virus particles present in injected preparations. However, MAb have been produced to low titred antigens by other workers (Harlow and Lane, 1988). The ability to produce specific antibodies to single antigens was a factor influencing the decision to produce MAb in this study, as the author was unable to produced PCV particle preparations free of PBV. Alternatively, low immunogenicity of PCV virus particles may have had an influence on the development of antibodies. Although this would seem unlikely as MAb have been produced to many other closteroviruses (Bar-Joseph et al., 1995), including PCV (Hu et al., 1996), with Hawaiian scientists producing several PCV–specific MAb of varying specificity and sensitivity. The ability of the TAS-ELISA format used in this study as a MAb screening assay to successfully trap PCV and PBV particles is 156
Chapter 4: Serological Detection
uncertain, and may have contributed to the low number of MAb detected. However, given that the TAS-ELISA format using the same PCV PAs worked well for Hawaiian scientists, this would seem to be only part of the problem. Another option is that the adjuvant was not effective, due to the active ingredient (in Gerbu) not obtaining the required very specific synergistic environment in the mouse injected. Gerbu needs Zn ions in the form of a proline complex in order to ensure rapid development of high titres on a consistent basis (Gerbu Biotecknik, 1995). This option seems quite likely, as the same batch of Gerbu adjuvant was used in attempts to produce a PAs to abaca mosaic virus and banana mild mosaic virus with limited success (John Thomas, personal communication). In general, the serological detection of PCV has had a chequered past, with Hawaiian scientists developing ELISA systems based on PAb and MAb that initially appeared suitable, but were later found to lack sensitivity (Ullman et al., 1989; Hu et al., 1993). This lack of sensitivity in antiserum-based tests could be due, at least in part, to low virus titres in plants. Low PCV concentration would seem to contribute doubly to difficulties in detection by serological methods, with pure preparations difficult to produce in sufficient amounts (Chapter 3) to create specific antibodies, and low virus titres hard to detect without sensitive antiserum. Future serological tests will need to address both of these problems. The current assay of Hu et al. (1997) would seem to have solved these problems by using Haw MAb, which are not sensitive enough for use in ELISA, in a TBIA system. The increased sensitivity of this assay is most likely related to the increased binding capacity of nitrocellulose, which can bind ca. 1000× more protein than polystyrene (from which standard ELISA plates are made) (Crowther, 1995). The TBIA system used in Hawaii was published after the completion of my experiments, and so was not attempted in this study. 157
Chapter 4: Serological Detection
158
Chapter 5: Nucleic Acid Analysis
CHAPTER 5
ANALYSIS OF PCV COAT
PROTEIN AND NUCLEIC ACIDS 5.1
INTRODUCTION Nucleic acid analysis by molecular methods has become one of the most
effective and efficient ways of characterising plant viruses. Once even limited virusspecific sequence is obtained the opportunities for virus detection, through PCR and nucleic acid hybridisation, as well as taxonomic classification are immense. Further characterisation of viruses can be achieved by comparing coat protein sizes and dsRNA banding patterns as well as genome sequences.
5.1.1
Coat Protein Size Virus coat protein size is usually characteristic for particular virus genera. The
characteristic coat protein size for most closteroviruses is 22-24 kDa, except for Cucumber chlorotic spot virus (28 kDa), sweet potato sunken vein virus (34 kDa) and GLRaV’s (36-43 kDa).
The size range shown by closterovirus coat proteins is
comparatively wide, and suggests that additional genome variation exists which may eventually lead to further subdivisions of the group (Bar-Joseph et al., 1995).
5.1.2
dsRNA dsRNA represents either the replicative form, or the genome of an RNA virus
and it can be an important group-specific indicator of the presence of RNA viruses in bacteria, fungi and plants (Dodds, 1993; Franklin, 1966). Its size, and the number of species present, can provide information on the likely size and genome organisation of the virus-like agent infecting the host. Isolation and purification of the dsRNA may allow it to be cloned for use as a specific diagnostic molecular probe without the need 159
Chapter 5: Nucleic Acid Analysis
for purifying the virus (Jelkmann et al., 1989).
Sequence analysis of the clones
provides information on the taxonomic position of a virus-like agent associated with the dsRNA (Murphy et al., 1995) and can lead to identification of the virus. Plants infected with closteroviruses generally contain a variety of dsRNA species which form a broadly similar pattern, with regard to the number and spacing of bands, in PAGE (Dodds and Bar-Joseph, 1983). Closteroviruses can be distinguished from one another on the basis of the exact dsRNA banding pattern, and with viruses such as CTV, different strains of the same virus can be separated based on dsRNA bands (Bar-Joseph et al., 1995). The dsRNA banding pattern described by Gonsalves (1993) for Hawaiian PCV consists of three bands