marker occlusion and minimal detectable pattern size. Keywords and phrases Marker identification, computer vision. Digital Object Identifier 10.4230/OASIcs.
Detection and Identification Techniques for Markers Used in Computer Vision Johannes Köhler1 , Alain Pagani1 , and Didier Stricker1 1
Department of Augmented Vision German Research Center for Artificial Intelligence GmbH Trippstadter Str. 122, 67663 Kaiserslautern, Germany {Johannes.Koehler, Alain.Pagani, Didier.Stricker}@DFKI.de
Abstract This paper summarizes and compares techniques for detecting and identifying markers in the context of computer vision. Existing approaches use correlation, digital, or topological methods for marker identification. The comparison points out that all marker processing algorithms, which employ sophisticated digital codes are more robust and reliable. Existing bit representation schemes for these codes and marker designs are compared with each other. We illustrate in this context, why the marker processing algorithm introduced in [11] is the best performer regarding marker occlusion and minimal detectable pattern size. Keywords and phrases Marker identification, computer vision Digital Object Identifier 10.4230/OASIcs.VLUDS.2010.36
1
Introduction
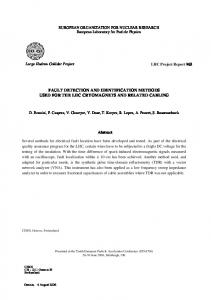
A marker system consists of a set of patterns that can be detected by a computer equipped with a camera and an appropriate detection algorithm. Markers placed in the environment provide easily detectable visual cues for indoor tracking [13], robot navigation [20], augmented reality ([8], [9], [23], [4] among others) and, in general, all applications where the relative pose between a camera and an object is required. The maximum distance between marker and camera that still allows a successful detection should be as large as possible in the computer vision context. This differentiates and distinguishes “vision” markers (figure 1) from those that have the purpose of information transport only. Examples for the latter types are MaxiCode used by the U.S. postal service or QuickResponse [24], their high information density makes them detectable at close distance only. They are not suitable for computer vision and will not be covered in this paper. Algorithms that detect only single markers (i.e. they have the smallest possible marker library size) as well as techniques that demand special hardware other than a conventional camera are also not considered.
Figure 1 Markers that are used in computer vision ([13], [9] [5], [11]).
Marker trackers used in computer vision mostly use either square or circular tags. These geometric primitives are well-detectable in images and usually serve as an initial hint for the © J. Köhler, A. Pagani and D. Stricker; licensed under Creative Commons License NC-ND Visualization of Large and Unstructured Data Sets– IRTG Workshop, 2010. Editors: Ariane Middel, Inga Scheler, Hans Hagen; pp. 36–44 OpenAccess Series in Informatics Schloss Dagstuhl – Leibniz-Zentrum für Informatik, Dagstuhl Publishing, Germany
Johannes Köhler, Alain Pagani, and Didier Stricker
37
presence of a marker. Topology based fiducial systems as reacTIVision ([1], [3] or [15]) are the only ones that diverge from this scheme. Their markers have an irregular shape and are in case of reacTIVision tailored for the use in multitouch-surface application. The precise camera pose cannot be derived from them. Both square- and circular markers have individual advantages: The contents of a square can be accessed uniformly using only homography and the camera pose computed from the vertices is unique in most cases [21]. In case of circular markers, the camera pose for accessing the marker content can be computed from the whole contour surrounding the marker, instead of only the 4 vertices. This makes the detection more robust for occlusion. It, however, demands the intrinsic data of the camera to be known and always yields a pose ambiguity when only a single marker is used ([11], [2]). According to [19], square tags carry a larger symbolic data payload than a circular tag of the same size, whereas circular tags offer better location and pose accuracy. The latter could be confirmed in [10]. Various marker identification techniques exist that are applied to the detected geometric primitives to extract the markers. Most approaches either measure the degree of correlation of a pattern found inside an image with known patterns or use digital methods, e.g. read a binary code from the marker. The code stores a non redundant ID for identification. A third identification approach extracts markers from the image topology. It can be said in general that correlation and topology based trackers perform least robust ([10], [4]). All approaches influence the marker design. Several parameters for measuring the performance and robustness of a marker detection algorithm have been introduced. The camera pose dependent bin, or “bit bucket” size, is one criterion for detectability of digital code based markers. It was theoretically analyzed for square and circular markers in [19]. Another detectability measure is the detection rate as function of the tag size in an image, applicable to all types of markers. Robustness can be measured by the false positive, false negative and inter marker confusion rates [4]. Marker processing can in general be grouped into candidate detection and identification. Candidate detection finds e.g. geometric primitives that constitute a marker. The identification then separates true markers from false candidates. The remainder of this paper is thus grouped into 3 sections: Section 2 lists basic, initial detection approaches. Section 3 discusses existing identification approaches and their influence on the marker appearance. Available performance analyses are presented and compared in section 4. The paper concludes with a short summary and an outlook on future work.
2
Marker Candidate Detection
The detection of a potential marker is usually accomplished by detecting perspective distortions of the geometric primitives they are composed of. These are quadrilaterals in the case of squares and ellipses in case of circles. These primitives are extracted from contours that were found using either image binarization by thresholding or edge detection. There are algorithms that detect primitives only as a whole and algorithms capable of detecting defective shapes. The latter are important in case of occlusion. The interested reader is directed to [4] for quad detection and [10] for ellipse detection. In case of topological identification methods (section 3.4), the markers are independent of the geometry, thus no candidate detection is necessary. The marker is detected and identified at the same time by searching a subgraph in a topological region adjacency graph.
VLUDS’10
38
Detection and Identification Techniques for Markers Used in Computer Vision
3
Marker Identification
After the detection of geometric primitives in the image it is still unclear, if they originated from a marker. Regardless of the application of the marker tracking system, there are most certainly more primitives that do not represent a marker and should not yield a positive detection. The marker therefore needs certain features to distinguish it from its surroundings and to serve as additional detection features. The identification can either be based on correlation, on a digital code or on characteristic topology. Various designs exist for the approaches that determine how information is encoded on the marker. Moreover a uniform access method for the marker contents is necessary for correlation and code based identification.
3.1
Uniform Content Access
Each marker type has a 2D reference layout Mref that contains information on where to find the marker contents (e.g., code bins or detection features). In order to access a hypothetical marker Mhyp (i.e., a detected geometric primitive) that is perceived in an image, a mapping f : Mref 7→ Mhyp is necessary, that correctly maps reference features to (potentially) observed features. For square markers, f is most commonly the homography computed from the vertices. For circular markers the camera pose relative to the marker can be computed from its contour ([2], [10]). Together with the camera intrinsic data matrix K, it can be used to access the marker content: Mhyp = KP Mref . The marker orientation is unknown up to this point and needs to be derived from special features on the marker. This holds true for squares that naturally induces 4 possible orientations, and circles that have no natural orientation indicators. Possible solutions are: Graphical indicators: They serve as anchors and are used e.g. in CyberCode [17], TriCode [12] and Intersense [13] (figure 2). Fixating correlation: Mostly usable for square markers; the correlation towards a template is computed for all possible orientations, the orientation yielding the highest correlation is assumed to be correct and fixes the orientation. Used e.g. in ARToolkit. Fixating codes: Mostly usable for square markers; A code is placed on the marker that only decodes correctly at the correct orientation and fixates it. This technique was introduced in [4]. Mixtures The mixture of graphical orientation features generates a set of possible orientations and enables the use of either correlation measurement or digital codes for estimating the orientation on circular markers [11]. Rotational invariance: When the rotation of a tag is not of importance, rotational invariant detection methods can be used. The possible simplest example is the use of circular markers with a circular information encoding pattern like concentric circles [7] or fourier tags [20]. More advanced is the use of cyclic codes, that, with a special layout, can be read at arbitrary orientations [18]. In this way rotationally invariant markers can be extended with error correction. Graphical orientation features work well, but are, in general, not robust towards partial occlusion of the tag. The same holds true for correlation based methods. When the orientation can be determined, the contents of the marker can be uniformly read.
Johannes Köhler, Alain Pagani, and Didier Stricker
39
Figure 2 Various graphical orientation features used in existing marker systems
3.2
Identification Based on Correlation
In the case of correlation based marker identification, the marker is subdivided into grid cells that are correlated with reference grids. The correlation coefficient then indicates the “markerness” of an observation. Since this is a threshold decision, one can expect a high false positive detection rate of correlation based trackers [4]. The most popular and potentially most wide spread tracker which uses correlation based marker assignment is ARToolkit [8]. Since correlation does not require binary values, arbitrary images could be used on the marker. Thus, no consistent design can be provided. According to [16] the use of 2D direct cosine transform basis functions for marker pattern generation produces a higher reliability.
3.3
Identification Based on Digital Codes
In the case of digital code based marker identification, binary digits are read from the marker content that contain an ID. Error correction and detection as well as other digital methods can be applied to them. The marker appearance depends on the method of how the code is represented. The following methods exist (figure 3): Code Bins: The marker is subdivided into bins that store black/ white values which represent 1/0. This is the most commonly used method. Fourier Encoding: Code words are represented by evenly spaced, low-frequency signal bursts and visually represented in spatial domain using a fourier transform. This technique is used in [20]. TriCodes: This encoding technique uses isosceles triangles which point in 1 of 8 directions. Each triangle thus encodes 3 bits. The technique is used in [12].
Figure 3 Bit representations; From left to right: Bins, TriCode, Fourier
Possible ways of constructing codes for digital markers are: Raw codes: The unprotected digital ID is placed on the marker ([13], [25]). Only the presence of orientation features ensures “markerness”, thus a high false positive rate can be expected. Error detecting codes: A redundant part for error detection is computed from the marker ID and added to the marker. “Markerness” of a shape is checked by correct decoding. CRC codes are used in current marker systems ([4], [23], [11], [22]).
VLUDS’10
40
Detection and Identification Techniques for Markers Used in Computer Vision
Error correcting codes: A redundant part for error correction is computed from the marker ID and added to the marker. The codes used are usually not precisely stated ([22], [4], [17]), according to their description they could be categorized as BCH codes. Reed Solomon codes were used for error correction and CRC codes for error detection in [10] and [11]. It was shown that the exploitation of additional error detecting capabilities of Reed Solomon codes can be used together with an appropriate minimal CRC generator polynomial to shorten the code used on markers.
3.4
Identification Based on Topology
Topology based identification relies on topological region adjacency. Images are thresholded and a region adjacency graph is computed, that reflects containment relationships. The graph is analyzed for patterns which resulted from a marker (figure 4 (left)). It is notable, that this type of identification is independent of the tag geometry up to a certain extend and thus does not need an a priori detection of geometric primitives. Distortions of the tags still yield a positive detection (figure 4 (right)), unless they change the topology. Topology based extraction algorithms are on the other hand not capable of handling occlusions and could yield a comparatively high false positive detection rate, if the topologic structure is not complex enough [15]. Systems employing these type of markers are [3], [1], [14] and [15].
Figure 4 left: Topology graph for two exemplary markers, right: Deformed, detectable marker
4
Performance Analyses
There are currently no comparative studies of all existing marker processing systems, mostly due to the fact of their unavailability. To our knowledge ARToolkit, ARToolkitPlus and reacTIVision are currently freely available, the distribution of ARTag has been stopped. Available results and analyses for current marker processing algorithms are compared in the following section. A detailed list of metrics and evaluation criteria that can be applied to evaluate marker detection algorithms is found in [6]: False positive rate, inter-marker confusion rate, false negative rate, minimal marker size, vertex jitter characteristics, marker library size, immunity to lighting conditions, immunity to occlusion, perspective support, immunity photometric calibration and the speed performance. Table 1 shows known results for a set of existing marker systems. A subset of the previous characteristics were chosen according to the availability of data. These results show that the library sizes vary greatly, ranging from 17 to up to 262144 markers. It is however questionable, if that many markers are needed in any field of application. Instead, it is more reasonable to decrease the library size. In the case of digital markers, all bits that are then unoccupied can be used to add redundancy for error correction or can be removed to improve the tag readability. No meaningful library size can be provided for correlation based trackers, since training of new patterns enables a continuous enlargement
Johannes Köhler, Alain Pagani, and Didier Stricker
# Tags
Red
Occl
FP
41
MC
MS
ARToolkit [8] NP 0% 0% 0.5-4.4%+ N/A* 25-65 ARTag [4] 2002 70.2% 5% 0% 0.0039% 20 ARToolkit+ [23] 4096 66.6% N/A* 0% N/A N/A Intersense [13] 215 0% 0% N/A* N/A* 16* [11] 255 75% 25% 0% 0.153% 17.36 TriCode [12] 218 25% 0% N/A* N/A N/A* reacTIVision [1] 89 0% N/A > 0% N/A N/A Nishino [15] 17 0% N/A 0% N/A 40 Constanza [3] N/A 0% N/A* 0-16% N/A* N/A Table 1 #Tags: Tag amount in the library; Red: Redundancy in the identification pattern; Occl: Amount of possible data part occlusion; FP: False positive detection rate; MC: Marker confusion rate; MS: Minimum detectable tag size in pixel. “NP”: not possible for the marker type; “N/A”: no data available; “N/A*”: no precise data available, but facts that allow a comparative estimation. red: Correlation based-; blue: digital method based-; green: topology based identification.
of the library, which certainly will rise the false positive detection rate and marker confusion rate though. Redundancy is only present in the case of digital markers. The corresponding “Red” value in table 1 reflects the amount of redundant bits and measures the information density. The occlusion value (“Occl”) illustrates, to what extend the redundant data is used for error correction. It is only measured for the data part of the marker, not for its border and results from the amount of correctable bits in the case of a digital marker. Constanza’s [3] topology based markers can also be detected under partial occlusion, which is achieved by adding a topology error tolerance, that does not permit a precise determination of the coverable area. It also raises the false positive detection and marker confusion rates (refer to [3] for more details). The use of error correcting codes in case of ARToolkitPlus is mentioned in [23], but a CRC code is reported for error correction. Since CRC codes however only detect errors, it is not clear to what extend ARToolkitPlus is able to correct errors. The false positive detection rate is computed from available analyses that applied marker detection algorithms to images not containing a marker. It reflects the amount of frames where a marker was detected. Algorithms employing digital codes never reported a marker. The same holds for Nishino’s topology based algorithm [15]. ARToolkit’s false positive detection rate strongly depends on the correlation threshold (confidence factor, c.f.) used. This is reflected by the large interval (0.5-4.4%) which was computed from the results published in [4]. Only a single reference pattern was used for the experiment, [12] confirmed that the false positive detection rate dramatically increases when more patterns are used. The false positive rate for the Intersense algorithm [13] can be assumed to be larger than 0% because the marker orientation feature is the only factor for ensuring “markerness” (section 3.1). This feature might be found often by accident. The theoretical marker confusion rate is only available for ARTag [11]. In both cases it represents the risk of marker confusion caused by error correction. The values have a pure combinatorial nature and do not necessarily represent rates applicable in practice, since the factors that cause errors (occlusion, errors in f (section 3.1)) can hardly be captured by theory. Refer to [10] and [4] for more details. The confusion rate in practice for the algorithms marked with N/A* can be expected to be high, since they do not use protection
VLUDS’10
42
Detection and Identification Techniques for Markers Used in Computer Vision
mechanisms. In the case of ARToolkit, this depends on the amount of markers [12] and the type of patterns used [16]. In the case of topology based methods, the complexity of the tag structure influences the confusion rate [15]. An error tolerance, as used in Constanza’s markers [3], that raises the false positive detection rate might also likely raise the confusion rate. Detectable tag sizes vary from 17-65 pixels. The value 16, in the case of Intersense, is of theoretical nature and was not verified with experiments. [11] performs best with a minimal detectable tag size of 17 pixels, followed by ARTag. The second number represents the minimal tag size in case of defects (36 pixels). ARToolkit’s minimal pattern size depends on the correlation threshold (c.f.). If a high tolerance is used, the tag size decreases but the false positive rate increases. With a strict tolerance, the tag size is comparatively large. The same holds for Nishino’s algorithm [15].
4.1
Design of Digital Markers
A thorough comparative study on the design consequences of digital markers can be found in [19]. The authors of that paper use their machine vision framework, Cantag, for a theoretical evaluation of tag readability and a comparison of square and circular tag shapes. They furthermore conclude that square tags carry a larger symbolic data payload than a circular tag of the same size, whereas circular tags offer better location and pose accuracy. The pose accuracy aspect can be confirmed for the algorithm proposed in [10]. Using bilinear interpolation code bins down to a size of 3 pixels could be successfully read, which is close to the theoretical limit of 1 pixel. For the TriCode bit encoding scheme, one can expect the tag readability to be worse than this because the successful recognition of a triangle demands a larger shape.
5
Conclusion
In this paper an overview of existing marker systems was presented. The generalized detection steps were presented and current methods were arranged in this context. Among the known techniques, digital method based marker processing algorithms have been shown to be most reliable. Their performance and behavior in the presence of errors is predictable and can be quantified precisely. In numerous experiments they never gave rise to false positive detection or inter marker confusion and detectable tag sizes are small. The traditional bin encoding scheme is used for bit representation on most digital markers. Too few results were published for alternatives (TriCode, Fourier encoding) to compare the approaches in a fair way. It can however be said that the information density is currently lower for fourier tags due to the spatial pattern distribution. The same holds for TriCodes, since the triangles encode 3 bits, but the white space in between is wasted. In contrast to this, the correlation based ARToolkit is possibly the most widespread marker tracker due to its availability. It, however, suffers from high false positive and marker confusion rates. The same holds for most topology based methods. Minimization of the marker code together with a pose computation from the whole marker contour make the circular marker processing algorithm proposed in [11] the top performer for occlusion and detectable tag size. The number of tags it offers is sufficient for a large field of applications. It is currently developed further to support erasure channel decoding for handling larger occlusions up to 50%. This will drastically increase the combinatorial marker confusion rate. Thus a more meaningful metric needs to be developed, that better adapts to the practical occurrence of error patterns.
Johannes Köhler, Alain Pagani, and Didier Stricker
43
References 1
2 3 4 5
6 7
8 9
10 11
12 13
14
15
16 17 18
Ross Bencina and Martin Kaltenbrunner. The design and evolution of fiducials for the reactivision system. In Proc. 3rd International Conference on Generative Systems in the Electronic Arts, 2005. Qian Chen, Haiyuan Wu, and Toshikazu Wada. Camera calibration with two arbitrary coplanar circles. In ECCV (3), 521–532, 2004. Enrico Costanza and J. Robinson. A region adjacency tree approach to the detection and design of fiducials. In VVG, pages 63–69, 2003. Mark Fiala. Artag revision 1. a fiducial marker system using digital techniques. Technical report, National Research Council of Canada, 2004. Mark Fiala. Artag, a fiducial marker system using digital techniques. In CVPR ’05: Proceedings of the 2005 IEEE Computer Society Conference on Computer Vision and Pattern Recognition (CVPR’05) 2:590–596. IEEE Computer Society, 2005. Mark Fiala. Designing highly reliable fiducial markers. IEEE Transactions on Pattern Analysis and Machine Intelligence, 99(RapidPosts), 2009. Lance B. Gatrell, William A. Hoff, and Cheryl W. Sklair. Robust image features: concentric contrasting circles and their image extraction. In Cooperative Intelligent Robotics in Space II, pages 235–244, 1992. Hirokazu Kato and Mark Bilinghurst. ARToolkit User Manual. Human Interface Technology Lab, University of Washington, 2000. Hirokazu Kato and Mark Billinghurst. Marker tracking and hmd calibration for a videobased augmented reality conferencing system. In Proceedings of the 2nd International Workshop on Augmented Reality (IWAR 99), San Francisco, USA, October 1999. Johannes Koehler. Robust detection and identification of circular markers for estimation of the camera pose in real time. Master’s thesis, Technische Universität Kaiserslautern, 2009. Johannes Koehler, Alain Pagani, and Didier Stricker. Robust detection and identification of partially occluded circular markers. In Proceedings of the 3rd International Conference on Computer Vision, Imaging and Computer Graphics Theory and Applications, pages 387–392, 2010. Jonathan Mooser, Suya You, and Ulrich Neumann. Tricodes: A barcode-like fiducial design for augmented reality media. In ICME, pages 1301–1304. IEEE, 2006. Leonid Naimark and Eric Foxlin. Circular data matrix fiducial system and robust image processing for a wearable vision-inertial self-tracker. In ISMAR ’02: Proceedings of the 1st International Symposium on Mixed and Augmented Reality, page 27. IEEE Computer Society, 2002. Hiroki Nishino. A split-marker tracking method based on topological region adjacency & geometrical information for interactive card games. In SIGGRAPH ASIA ’09: ACM SIGGRAPH ASIA 2009 Posters, New York, NY, USA, 2009. ACM. Hiroki Nishino. A 6dof fiducial tracking method based on topological region adjacency and angle information for tangible interaction. In TEI ’10: Proceedings of the fourth international conference on Tangible, embedded, and embodied interaction, pages 253–256, New York, NY, USA, 2010. ACM. Charles B. Owen, Fan Xiao, and Paul Middlin. What is the best fiducial. In The First IEEE International Augmented Reality Toolkit Workshop, 2002. Jun Rekimoto and Yuji Ayatsuka. Cybercode: designing augmented reality environments with visual tags. In Designing Augmented Reality Environments, 2000. Andrew C. Rice, Christopher B. Cain, and John K. Fawcett. Dependable coding of fiducial tags. In Hitomi Murakami, Hideyuki Nakashima, Hideyuki Tokuda, and Michiaki Yasumura, editors, UCS, 3598:259–274 of Lecture Notes in Computer Science. Springer, 2004.
VLUDS’10
44
Detection and Identification Techniques for Markers Used in Computer Vision
19
20
21 22
23 24 25
Andrew C. Rice, Robert K. Harle, and Alastair R. Beresford. Analysing fundamental properties of marker-based vision system designs. Pervasive and Mobile Computing, 2(4):453– 471, November 2006. Junaed Sattar, Eric Bourque, Philippe Giguere, and Gregory Dudek. Fourier tags: Smoothly degradable fiducial markers for use in human-robot interaction. Computer and Robot Vision, Canadian Conference, 0:165–174, 2007. Gerald Schweighofer and Axel Pinz. Robust pose estimation from a planar target. IEEE Transactions on Pattern Analysis and Machine Intelligence, 28:2024–2030, 2006. Daniel Wagner, Tobias Langlotz, and Dieter Schmalstieg. Robust and unobtrusive marker tracking on mobile phones. In ISMAR ’08: Proceedings of the 7th IEEE/ACM International Symposium on Mixed and Augmented Reality, pages 121–124, Washington, DC, USA, 2008. IEEE Computer Society. Daniel Wagner and Dieter Schmalstieg. Artoolkitplus for pose tracking on mobile devices. In Proceedings of 12th Computer Vision Winter Workshop (CVWW’07), 2007. Denso Wave. Quick response specification. http://www.denso-wave.com/qrcode/indexe.html, 1994. Xiang Zhang, Yakuo Genc, and Nassir Navab. Mobile computing and industrial augmented reality for real-time data access. Technical report, Siemens Corporate Research, Imaging and Visualization Department, 755 College Road East, Princeton, NJ 08540, USA, 2001.