This article has been accepted for publication in a future issue of this journal, but has not been fully edited. Content may change prior to final publication.
Detection of Anatomic Structures in Human Retinal Imagery Kenneth W. Tobin, Senior Member IEEE, Edward Chaum, V. Priya Govindasamy, Member IEEE, Thomas P. Karnowski, Member IEEE
Abstract— The widespread availability of electronic imaging devices throughout the medical community is leading to a growing body of research on image processing and analysis to diagnose retinal disease such as diabetic retinopathy (DR). Productive computer-based screening of large, at-risk populations at low cost requires robust, automated image analysis. In this paper we present results for the automatic detection of the optic nerve and localization of the macula using digital red-free fundus photography. Our method relies on the accurate segmentation of the vasculature of the retina followed by the determination of spatial features describing the density, average thickness, and average orientation of the vasculature in relation to the position of the optic nerve. Localization of the macula follows using knowledge of the optic nerve location to detect the horizontal raphe of the retina using a geometric model of the vasculature. We report 90.4% detection performance for the optic nerve and 92.5% localization performance for the macula for red-free fundus images representing a population of 345 images corresponding to 269 patients with 18 different pathologies associated with DR and other common retinal diseases such as age-related macular degeneration. Index Terms— diabetic retinopathy, red-free fundus imagery, vascular segmentation, optic nerve detection, macula localization, feature analysis, Bayesian classifier
I. INTRODUCTION
T
HE World Health Organization estimates that 135 million people have diabetes mellitus worldwide and that the number of people with diabetes will increase to 300 million by the year 2025 [1]. More than 18 million Manuscript received February 7, 2006. These studies were supported in part by grants from Oak Ridge National Laboratory, the National Eye Institute, (EY01765), the United States Army Medical and Material Command, Telemedicine and Advanced Technology Research Center (W81XWH-05-1-0409), by an unrestricted UTHSC Departmental grant from Research to Prevent Blindness, New York, NY, and by The Plough Foundation, Memphis, TN. K.W. Tobin leads the Image Science and Machine Vision Group at the Oak Ridge National Laboratory, Oak Ridge, Tennessee, 37831-6075, USA (phone: 865.574-8521; e-mail:
[email protected]). E. Chaum is the Plough Foundation Professor of Retinal Diseases at the University of Tennessee Health Science Center, Hamilton Eye Institute, Memphis, TN 38163, USA (e-mail:
[email protected]). V. Govindasamy is with the Image Science and Machine Vision Group at the Oak Ridge National Laboratory, Oak Ridge, Tennessee, 37831-6075, USA (e-mail:
[email protected]). T. Karnowski is with the Image Science and Machine Vision Group at the Oak Ridge National Laboratory, Oak Ridge, Tennessee, 37831-6075, USA (email:
[email protected]).
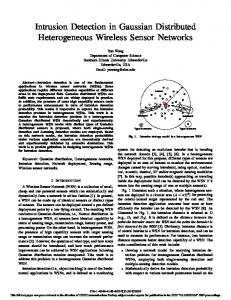
Americans currently have diabetes and the number of adults with the disease is projected to more than double by the year 2050 [2]. An additional 16 million adults between the ages of 40-74 have pre-diabetes and are at high risk for developing diabetes. Visual disability and blindness have a profound socioeconomic impact upon the diabetic population and diabetic retinopathy (DR) is the leading cause of new blindness in working-age adults in the industrialized world [2]. The prevalence rates for DR and vision-threatening DR in adults over age 40 is 40.3% and 8.2%, respectively [3]. It is estimated that as much as $167 million dollars and 71,00085,000 sight-years could be saved annually in the U.S. alone with improved screening methods just for DR [4]. There is a significant need to develop inexpensive, broadbased screening programs for DR to reduce the economic and social consequences of vision loss from this disease. Treatment for DR is available; the challenge lies in finding a cost-effective approach with high sensitivity and specificity that can be applied to large populations in a timely manner to identify those who are at risk in the early stages of the disease. Computer assisted diagnostics using image analysis has the potential to provide a low-cost method using widely distributed systems. Advances in the imaging of ocular anatomy and pathology can economically provide the digital data required to diagnose and quantify specific diseases using computer-based analysis. More research is required in robust image analysis and automation to achieve productive screening of large populations. In this paper, we describe a method for detecting critical structures in the human retina, specifically the optic nerve, vascular arcades and the macula region containing the fovea. Detection of these anatomic structures is fundamental to the subsequent characterization of the normal or disease states that may exist in the retina. Examples of visual pathology in retinal imagery for the type of data used in this study are shown in Fig. 1. Established retinal reading centers such as the Joslin Vision Network (Boston, MA), and Inoveon Corp. (Oklahoma City, OK) have shown that digital photography is an excellent tool for identifying DR when performed by experienced, certified readers [5, 6]. The use of digital retinal imagery to analyze DR has been reported in numerous studies (see e.g., [3, 7]). While the retinal reading centers show the utility of digital photography for identifying DR, achieving broad-based, high-
Copyright (c) 2007 IEEE. Personal use of this material is permitted. However, permission to use this material for any other purposes must be obtained from the IEEE by sending a request to
[email protected].
This article has been accepted for publication in a future issue of this journal, but has not been fully edited. Content may change prior to final publication.
TMI-2007-0129.R1 throughput, and low-cost screening requires moving beyond the current requirements of a certified human reader.
Fig. 1. Example of a red-free fundus image in (a) showing "hard" and "soft" drusen associated with age-related macular degeneration, and in (b) showing a focal macular chorioretinitis, an inflammatory choroidal lesion.
Automated image analysis algorithms have demonstrated the ability to detect anatomic features and detect features of retinopathy such as lesions using color and monochromatic retinal images [8]. A comprehensive review of these and other digital retina analysis topics are described in [9, 10]. . In many approaches, the first step in automated digital analysis of retinal disease is the systematic and reliable location of important anatomic structures in the eye. For example, it has been noted that the abundance of drusen (a lesion characteristic of age-related macular degeneration) in proximity to the fovea can be correlated with the risk and degree of vision loss [11]. Key elements of automated digital analysis may include the ability to normalize large populations of images to accommodate acceptable variations in illumination and contrast from fundus cameras used for data acquisition [12]. A common approach is to detect and segment the vascular structure [13-16] to exploit the geometric relationship that exists between the vasculature and the position of the optic nerve in the retina [17-19]. Other recently reported methods used to locate the optic nerve in an automated fashion include location regression [20], pixel classification and graph search algorithms [21, 22]. Approaches to digital image analysis of the retina have included techniques such as dynamic contours [23], scotoma mapping [24] and model-based approaches [25]. More recently, detection of the retinal vessels and macula have been reported using a probabilistic segmentation [26] and point-
2
distribution models [27]. The literature is sparse regarding methods for localizing the macula region, primarily due to the lack of visual structure in red-free and color fundus imagery (see e.g., Fig. 1) [24]. The macula region is generally darker than the surrounding retinal tissue, due to the higher density of carotenoid pigments in the retina and pigment granules in the retinal pigment epithelial (RPE) layer beneath the retina, but exhibits non-specific structure and varies greatly across individuals due to variations in the levels of pigment associated with factors such as ethnicity, age, diet, and disease states. Macula detection in the retina has been limited to methods that use ancillary imagery, e.g., Argon-blue imaging to highlight pigmentation [24], manually assisted methods [28], and techniques that attempt to locate the darker pigmented regions associated with the macula and fovea center [25, 29, 30]. Gagnon, et al. [30] locates dark pigment regions to identify the potential foveola (i.e., the macula center). This approach is problematic for retinal pathology that dramatically affects the physical structure of the macular region, e.g., hemorrhages, edema, pigmentary changes, etc., and therefore does not provide the robustness we need for DR screening. Through this paper we contribute two novel methods for localizing retinal structure. The first is a probabilistic approach using a Bayesian probability function for determining the likelihood of an image location being associated with the optic nerve. This is achieved by using statistical features of the vasculature, e.g., the vascular density, thickness, and orientation for each image pixel, with a multivariate normal density model for the conditional density function and a prior probability [31]. The second is a method for locating the approximate center of the macula based on empirical geometric relationships between the structure of the vascular arcade and the location of the optic nerve. Both of these methods work together to automatically place a coordinate system on the retina that will be used in future research to describe the relationship between retinal lesions, edema, and hemorrhages, relative to the optic disc and macula positions. Accurate detection of the optic nerve and macular region is critical to any automated diagnosis method that is based on the statistical characterization of vision-threatening lesions in the retina. II. APPROACH We have developed a method that takes advantage of a number of visual attributes of the vascular tree in a probabilistic framework. Our goal is to accommodate a number of disease states, from mild to severe retinopathy, that result in large variations in the morphology of the visible retina. Fig. 2 presents an overview of our method for ON detection. In (a) the original red-free fundus image undergoes analysis to provide a segmentation of the vessels as shown in (b). Note also in (a) that we have a prior probability estimate for the location of the ON along with other statistical data that comes from training. Training and prior probability data
This article has been accepted for publication in a future issue of this journal, but has not been fully edited. Content may change prior to final publication.
TMI-2007-0129.R1 consists of a small subset of fundus images that have had the ON and macula center manually selected. The prior probability describes the likely location of the center of the ON for all patients (i.e., both right and left eyes) in the training set and is representative of the ON location across the larger population of fundus imagery used in the study.
3
determined, the center of the macula is estimated to reside along this path at a distance of 2.5⋅ON diameters from the central ON coordinate [25]. These processes of vascular segmentation, feature generation, ON detection, geometric modeling, and macula localization are detailed in Section III, Methods. The results of our experimental analysis for a large population of diverse fundus images are presented in Section IV, Results.
Fig. 2. Overview of optic nerve detection process. (a) Original input red-free fundus image and prior probability of optic nerve locations from training data. (b) Segmentation, feature analysis and classification process resulting in (c), detected optic nerve location in “+” position.
Since the vasculature emanates from the ON, we have opted to characterize the retina in terms of this vessel structure by defining three vessel-related features and one luminance feature. These features are a density map of the vessels, ρ(x,y), an average thickness map, t(x,y), an average orientation map, Θ(x,y), and a luminance map l(x,y). These features form a vector, v(x,y) = [l, ρ, Θ, t]t, that is used to determine the conditional densities p(v|ωON) and p(v|ω¬ON) that describe the likelihood of obtaining the observation v at an image location, (x,y), for the state of optic nerve, ωON, or not optic nerve, ω¬ON. The prior probabilities, P(ωON) and P(ω¬ON) are combined with the conditional densities using Bayes’ rule to determine the posterior probabilities, P(ωON|v) and P(ω¬ON|v), which are used to develop a likelihood estimate for the location of the ON as shown in Fig. 2 (c). When referring to macula localization, we are careful to distinguish between “localization” and “detection.” Due to the non-specific visual structure and extent of the macula in our fundus imagery, it is difficult to produce a robust, deterministic method for segmentation of the macula based solely upon morphology. What we are able to do in a robust manner is use the relationship between the deterministic structure of the vascular arcades and the ON to predict the relative position of the macula in the human retina [24]. Our approach is presented in Fig. 3 and begins by using the learned location of the ON in (a). The segmented vascular tree shown in (b) provides the input to a model-based method shown in (c) for locating the horizontal raphe of the retina, which is not necessarily parallel to the horizontal raster of our fundus image. Once the horizontal raphe has been
Fig. 3. Localization of the macula region is determined by using the known ON location in (a), applying a geometric model to the segmented vascular arcade in (b) to determine the approximate horizontal raphe in (c) and positioning the macula center along the raphe accordingly in (d).
III. METHODS We now describe the methods used to perform the serial process of ON detection followed by macular localization. The goal is to achieve an effective and reasonably robust determination of these anatomic structures so that other disease-based anomalies that may be present in the retina (e.g., drusen, exudates, microaneurysms, choroidal lesions, etc.) can be characterized in relation to the ON and macular positions. We should note that our method is developed around the concept of using a standardized digital retina image from the Early Treatment Diabetic Retinopathy Study (ETDRS) standard protocol for retinal imaging and lesion classification [32] in which the macula is centered in the 50o image (Field 2). This standard image of the retina permits examination of both the macula and optic nerve in the same image. In addition, we selected this standard field because it shows the vasculature that feeds the macula and supports the application of our algorithm using a vascular model. Our long term goal is to research and develop high-throughput screening methods for DR. The macula-centered, Field 2 image contains more information regarding the high-resolution macula and foveola region of the eye than any other single ETDRS field, making it ideal for our long-term purpose to support high-throughput patient screening. We should note for this paper that we have included images that represent both DR and non-DR-related pathologies. These images were included because a robust
This article has been accepted for publication in a future issue of this journal, but has not been fully edited. Content may change prior to final publication.
TMI-2007-0129.R1 ON and macula detection algorithm should be perform independently of pathology. A. Optic Nerve Detection We have implemented the mathematical morphology method proposed by Zana and Klein [33] to segment the vessels in the retina. This method was developed to detect vessel-like patterns in medical images by using a model that incorporates local linearity of the vessels, piecewise connectivity, and vessel brightness with a Gaussian-like profile. This method was previously applied to fluorescein angiography (FA) images of the retina. FA uses the florescence of a sodium fluorescein dye as it courses through the vasculature, to develop bright images of the vascular trees. For our application with red-free fundus images, our vessel structures are dark relative to the retinal surface (see for example the vessels in Fig. 1). The algorithm was modified accordingly by inverting the grey-scale intensities to accommodate the FA algorithm for red-free fundus imagery. Our goal is to produce a binary image of the vasculature, b(x,y), for an image of size I×J. We want to achieve a robust segmentation for a wide variety of images representing various states of retinal disease. Fig. 4 shows examples of vessel segmentation applied to red-free fundus images for three patients. These images (i.e., the top row) represent a variety of image textures, intensities, and long and short-term illumination variations due to patient physiology, fundus camera settings, and differing states of disease. Notice the variation in contrast and structure from left to right; a left eye with fairly uniform reflectance with low contrast of the vessel structure, a right eye with mottled texture due to a light retinal pigmented epithelial layer, and a left eye with a high-contrast vasculature and a dark macula region (center). The result (i.e., bottom row) is a consistent binary representation, b(x,y), of the vascular tree. We use the binary representation of the segmented vasculature along with a luminance representation of the retinal image to generate four descriptive features used in determining the conditional densities, p(v|ωON) and p(v|ω¬ON). These features encapsulate four separate characteristics of the vessel structure that we have empirically determined are relevant to the detection of the ON. These features are extracted through the use of a convolution filter of size M×N, where this region of support is defined based on the observed structure of the vessel tree as it enters the eye and whose coefficients are all 1/(M⋅N). We have empirically chosen two categories of rectangular convolution window that vary in size depending on whether we are evaluating an intensity (luminance) feature, wl(x,y), or a feature based on vascular structure, wv(x,y), as will be described further below. In general, the convolution window is structured to match the dimensions of the ON or the vessels that enter the eye through the optic nerve. For this paper, the digital fundus imagery used represents a macular-centered 50o field of view. The ON subtends a 5o angle in the direction of the macula. This value is physiologically consistent for the human retina
4
[34]. For our dataset the images are 1024×1152 pixels and therefore we have chosen 1 ON diameter to be a standard value of 130 pixels, calculated as (5o/50o)*1024 + 2×14 additional pixels as a fixed boundary to accommodate variability in the presentation of the ON in our data. Fig. 5 shows an example of our filter window superimposed on an original and vessel segmented image in (a) and (b).
Fig. 4. The binary image results, b(i,j), of a vascular segmentation for three patients with age-related macular degeneration.
Fig. 5. Example of convolution filter, wv(i,j), of size M×N in original image I(i,j), in (a). Segmented vasculature in (b) with superimposed filter window of size M×N for the binary image b(i,j) in (c) and corresponding morphologically skeletonized region bt(i,j) in (d).
In (a) this has been superimposed over a circular demarcation of the location of the ON. The filter window is shown superimposed on the binary segmentation of the vessel structure in (b). The window shown in (c) and (d) represents a binary window, b(x,y)⋅wv(x,y), and a morphologically skeletonized version denoted by bt(x,y) wv(x,y). Using this filter definition along with the binary and skeletonized images, we define the spatial feature characteristics as follows: Retinal luminance, l(x,y) – It is characteristic of fundus imagery that the optic nerve efficiently reflects the fundus camera illumination resulting in a brightness relative to the surrounding tissue. This is partly due to the lack of pigmentation in this region of the retina. A feature that measures brightness can be helpful for locating the ON but can also create confusion for an automated algorithm since a myriad of retinal lesions also appear as bright objects in fundus imagery. The luminance is determined by convolving a filter window, wl(x,y) with the original image, I(x,y). For the luminance feature the window is defined to be of size M×N = 1 ON diameter × 1 ON diameter, which acts as a structuring element that searches for bright elements of mean size equal
This article has been accepted for publication in a future issue of this journal, but has not been fully edited. Content may change prior to final publication.
TMI-2007-0129.R1 roughly to 1⋅ON diameter,
l( x, y ) = I ( x, y ) ∗ wl ( x, y ) .
Vessel density, ρ(x,y) – Since the vasculature that feeds the retina enters the eye through the ON, the vessels tend to be the most dense in this region; density being defined as the number of vessels existing in a unit area of the retina. For our purposes we define the vessel density as, ρ ( x, y ) = bt ( x, y ) ∗ wv ( x, y ) , which results in a measure of the number of vessel structures in a supporting M×N region for every point (x,y) in the image. For vessel density and the remaining vessel-based features described below, the convolution window, wv(x,y), is defined to be M×N = 0.6⋅ON diameter × 3⋅ON diameter in size. The filter window can be considered to be a structuring element that searches for long, narrow, and vertical vessels entering the optic nerve. A range of filter widths from 0.2⋅ON diameter to 1.2⋅ON diameter in steps of 0.1 ON diameters were evaluated using two-fold validation on a subset of 100 images. As a result of our testing we selected a value of 0.6⋅ON diameter for the width of our filter window. We consider this value to represent the average width of the vessels entering the eye through the ON and it is subsequently used as a standard width in the algorithm. The height of 3⋅ON diameters facilitates the search for vertical structures that exist symmetrically away from the center of the ON. The central portion of the ON tends to exhibit visually blurred or occluded vasculature due to the three-dimensional structure of the optic cup therefore necessitating the inclusion of the vascular structure above and below the ON. Average vessel thickness, t(x,y) – Vessels are also observed to be thickest near the ON since most branching of both the arterial and venous structures does not take place until the tree is more distal from the ON. The average vascular thickness is defined as,
t ( x, y ) =
b( x, y ) ∗ wv ( x, y ) , bt ( x, y ) ∗ wv ( x, y )
which results in a measure of the average vessel thickness in a supporting M×N region for every point (x,y) in the image. Note that the thickness is independent of the number of vessels in the support region. Average vessel orientation, Θ(x,y) – Finally, for the datasets that we encounter in our work, which is typical for fundus imagery in general, the vessels entering the eye are roughly perpendicular to the horizontal raphe of the retina. i.e., the demarcation line running through the ON and fovea. The result is an observation of vascular orientation being ± 90o relative to the horizontal raphe when entering the eye and becoming more parallel (i.e., 0o) as the distance from the ON increases. The average orientation is derived from the original image, I(x,y), after application of a steerable filter. For this research we have implemented the steerable filter algorithm of Freeman and Adelson [35]. The steerable filter we incorporate uses a second derivative Gaussian combined with a Hilbert transform of this derivative, i.e., E2(θ) =
5
[G2θ]2+[H2θ]2, which can be expressed as a Fourier series in angle giving, E2(θ) = C1+C2cos(2θ)+C3sin(2θ)+…[high order terms]. The orientation image is then expressed as θ = arg[C2,C3]/2. Fig. 6 (a) and (b) shows an example of the post filtered image displayed as cos[θ(x,y)] scaled such that black = 0 and white = 1, corresponding to a vessel orientation of 90o and 0o respectively relative to the vertical axis.
Fig. 6. (a) Example of the result of the steerable filter applied to the original red-free fundus image shown in Fig. 5. (b) Filter region of size M×N and region after sampling with the binary skeletonized image in (c).
The angles of interest in a support region, M×N, (i.e., Fig. 5 (b)) are obtained by sampling the filtered image using the skeletonized binary image, bt(x,y), resulting in a sampling as shown in Fig. 6 (c). The average orientation function is therefore expressed as, Θ( x, y ) = [bt ( x, y ) ⋅ cosθ ( x, y )] ∗ wv ( x, y ) . Fig. 7 shows examples of the vascular segmentation and the feature maps developed for four different fundus images in rows (a) through (d). Each position in the original image, (x,y), now has associated with it a descriptive multivariate vector, v(x,y) = [l, ρ, Θ, t]t, that will be used for ON detection. To determine the likelihood of a location in the image being associated with the ON we use a multivariate normal density function [31] to model the conditional densities, p(v|ωON) and p(v|ω¬ON). These conditional densities are defined by,
p (v | ωON ) =
pON 2π Σ ON
t
1/ 2
e − ( v − μ ON )
1/ 2
e − ( v − μ ¬ON )
−1 Σ ON ( v − μ ON )
and,
p (v | ω¬ON ) =
p¬ON 2π Σ ¬ON
t
Σ ¬− 1ON ( v − μ ¬ON )
,
where ΣON and Σ¬ON are the covariance matrices and μON and μ¬ON are the population means generated from the training
features for each class. The function pON is a constant representing the fractional area of the retina in our data while p¬ON = 1-pON.
This article has been accepted for publication in a future issue of this journal, but has not been fully edited. Content may change prior to final publication.
TMI-2007-0129.R1
Fig. 7. Visual representations of vessel segmentation and resulting feature maps for four different fundus images in rows (a) through (d).
We define a confidence function R(x,y) as the well-known likelihood ratio of posterior probabilities by combining the conditional densities with the prior probabilities using Bayes’rule as follows,
R ( x, y ) =
P[ωON | v ( x, y )] p[v( x, y ) | ωON ] ⋅ P(ωON ) . = P[ω¬ON | v( x, y )] p[v ( x, y ) | ω¬ON ] ⋅ P(ω¬ON )
The goal here is to produce a function whose ratio is maximum for the most likely ON location in the image. The top row of Fig. 8 shows two examples of confidence maps, R(x,y), corresponding to the first two rows of the data in Fig. 7.
6
B. Macula Localization As with the ON detection algorithm, our macula localization method also relies on the segmented vasculature. Our primary approach for locating the macula is to determine the horizontal raphe of the retina, which is a line roughly passing through the ON and the fovea, or more generally separating the superior and inferior regions of the retina. The central macula (fovea) is assumed to reside at a fixed distance along this line at 2.5 ON diameters from the central ON coordinate [25]. To determine an estimate of the retinal raphe, we are applying a parabolic model of form a⋅y2=|x| to the statistical distribution of points defined by the segmented and morphologically skeletonized vasculature structure denoted earlier as bt(x,y). Foracchia, et al. [12] applied a parabolic model to the problem of ON detection to determine the ON coordinate (xON,yON) and the curvature, a, in a system where the horizontal raphe was always parallel to the raster scan of the image. For our application we already have an estimate of the ON position from our method described above. Our purpose is to employ a parabolic model to identify the angle between the horizontal raster and the line of symmetry separating the superior and inferior retinal regions of the retina. For our data set, the raphe is distributed through a range of angles, β, from +24o to -17o and we must measure this angle in each image to accurately place the estimate of our macula location. We therefore modify the basic parabolic model of form a⋅y2=|x| to include an axis rotation, β, and our known ON coordinate, (xON,yON), as shown in Fig. 9. y y′
β x (xON,yON)
x′
Fig. 8. Pixel classification maps (top row) and detected ON locations (bottom row) corresponding to (a) and (b) in the previous figure. Fig. 9. Coordinate system used to describe the horizontal raphe of the retina.
Once these maps have been obtained, the most likely ON coordinate (xON, yON) is determined by locating the coordinate of the highest confidence value in the map according to, ( xON , yON ) = arg max [R ( x, y ) ∗ d ON ( x, y )] , ( x,y )
where the confidence map has been averaged by convolution with a disk, dON(x,y), of diameter equal to our standardized value of 130 pixels; effectively combining all the evidence associated with a region surrounding the ON into the most likely coordinate. The bottom row of Fig. 8 shows corresponding estimates of the location, (xON, yON), of the ON for the corresponding likelihood maps in the top row.
The points, S, which are used to estimate the parabola are those points in the image where bt(x,y) ≠ 0, i.e., S = . Our parabolic expression, a⋅y2=|x|, is shifted to the ON center (xON,yON) to give,
a ⋅ ( y − yON ) 2 = x − xON . Next, we need to include a coordinate rotation by using the coordinate transform, x = x′cosβ − y′sinβ and y = x′sinβ + y′cosβ to give, 2 a ⋅ [x′ sin β + y ′ cosβ − yON ] = x′ cosβ − y ′ sin β − xON . Finally, this can be expressed fully in terms of the
This article has been accepted for publication in a future issue of this journal, but has not been fully edited. Content may change prior to final publication.
TMI-2007-0129.R1 transformed coordinate system by noting that, xON = x′ONcosβ − y′ONsinβ and yON = x′ONsinβ + y′ONcosβ, to give,
′ ) sin β + ( y ′ − yON ′ ) cos β ]2 = a ⋅ [( x ′ − xON , ′ ) cos β − ( y ′ − yON ′ ) sin β ( x ′ − xON
where (x′, y′) are the coordinates of the axis rotated by an amount β, and aligning with the horizontal raphe. This equation is addressed by using the standard non-linear least squares method of Marquardt [36] to estimate the parameters (a,β) by iteratively minimizing the criterion function J(a,β) on the set of points S = {(x′,y′): bt(x′,y′) ≠ 0 } defined by,
J ( a, β ) =
∑ {a ⋅ [( x′ − x′
( x ', y ')∈S
ON
′ ) cos β ] − ) sin β + ( y ′ − yON
′ ) cos β − ( y ′ − yON ′ ) sin β } ( x ′ − xON
2
.
The values used to initiate this function during iterative optimization are a = 0.0032 and β = 0. The algorithm converges quickly, in roughly seven to ten iterations. In Fig. 10 we show an example of a left eye in (a) and a right eye in (b) exhibiting significantly different disease pathologies, image quality, and geometric orientation. Overlaid on these images is the parabolic fit to the vasculature with curvature, a, and raphe orientation, β. The overlay on these images also includes the position of the identified ON coordinate plus the placement of the macula coordinate along the raphe.
Fig. 10. Example result of ON detection and macula region localization on a left eye in (a) and a right eye in (b).
IV. RESULTS To characterize our method for ON detection and macula localization over a large population of images, we have performed an extensive analysis on three datasets. Our first two datasets are derived from a population of 395 red-free fundus images representing 18 different retinal pathologies and a set of normal fundus images. The population of 395 images corresponds to 269 unique patients, with left and right eye images for some same patients plus some repeat images over time from the same patients. Our third dataset was selected from a publicly available set of fundus imagery that was developed through the STARE project [37], and referenced by Hoover, et al. in [17]. The 395 images used for our first two analyses are from an anonymized dataset of retinal images taken through dilated pupils using a Topcon TRC 50IA retina camera. Each digital
7
image encompasses a 50 degree field of the retina, and is taken using a green filter in the flash path to generate a "redfree" digital image. The image is acquired using a 1.4 Mpixel CCD camera (Kodak Megaplus 1.4i) with 1024 × 1152 pixel resolution that is saved at full fidelity without compression. The images are from the ophthalmic clinical practice of one of the authors (E. Chaum), a retina specialist at the University of Tennessee Hamilton Eye Institute, and were selected and characterized based upon determination of the specific disease diagnosis present in the eye. Images were selected from the patient database based upon their correlation with a standardized image (Field 2) from the Early Treatment Diabetic Retinopathy Study (ETDRS) standard protocol for retinal imaging and lesion classification [32] in which the macula is centered in the 50o image. In this configuration, the optic nerve occupies a location to the right or left of the central macula, in the right and left eyes, respectively. We have performed two separate tests on this set of 395 images. For our first test we have randomly extracted 100 images for evaluation of the efficacy of the four vascular and luminance features, l, ρ, Θ, t. When considering fundus images such as those shown in Fig. 7, it is apparent that the brightness of the ON region can be a strong indicator of the ON location. For this reason we have performed an evaluation of the classifier performance when considering only the luminance feature, l, different permutations of three of the four features, and all four features, l, ρ, Θ, t, on this set of 100 images. To produce a simple performance metric for this research, we define a correct localization of the ON based on a comparison of the estimated coordinate, (xON, yON), to a coordinate that was manually selected to reside at the visual center of the ON, (xm, ym). A coordinate was defined to be correct if the distance between the calculated and manually selected points were less than 1 ON radius (1R). Recall that we are using a standard ON diameter value of 130 pixels as described in the Methods section. It should be noted that the ON is not in actuality circular, but rather more elliptical with major and minor axis of approximately 1.5 × 2.0 mm [34]. To perform the test on the 100-image set, we trained the Bayesian classifier using 50 images. Training consisted of determining the prior ON coordinate distribution, P(ωON), using manually selected ON coordinates from the training set, and the covariance matrices and class means required for the conditional densities, p(v|ωON) and p(v|ω¬ON). The other 50 images were then processed to test the classifier. Next, the test data were exchanged to train the classifier and the original 50 training data were used to test. The aggregate performance across the 100 images is shown in Table 1 for the different sets of features being evaluated. Note that the total 1R performance improves with the inclusion of additional features from 69% for l-only to 96% for all features. This result shows that the luminance is a reasonably strong indicator of ON location as previously discussed, that the vascular features, ρ, Θ, and t, are more
This article has been accepted for publication in a future issue of this journal, but has not been fully edited. Content may change prior to final publication.
TMI-2007-0129.R1 discriminant (as a group), and that all four features produce
8
the highest performing response in the ON detection process.
Table 1. Performance of the optic nerve detection algorithm for a set of 100 red-free fundus images exhibiting 18 different pathologies and a normal fundus set. Shown are performance results for various permutations of the four features used with correct performance defined by a detection difference between manual and automatic ON estimation of less than 1 ON radius. Pathology Age-related macular degeneration (AMD) Cystoid macular edema (CME) Choroidal neovascularization (CNV) Choroidal lesion (ChL) Cone dystrophy (CoDy) Juxtafoveal telangiectasis (JFT) Metastasis (MET) Choroidal melanoma (ML) Normal fundus (NM) Non-proliferative diabetic retinopathy (NPDR) Ocular ischemia (OIS) Optic nerve lesion (ON) Proliferative diabetic retinopathy (PDR) Retinal artery occlusion (RAO) Retinal vein occlusion (RVO) Retinal detachment (ReD) Retinitis pigmentosa (ReP) Sickle cell disease (SC) Stargardt's disease (STAR) Total Performance
No. of Images 14 11 5 5 1 5 4 3 5
l 50.0 63.6 60.0 80.0 100.0 40.0 50.0 66.7 80.0
l, Θ, t 85.7 72.7 100.0 100.0 100.0 60.0 75.0 66.7 80.0
l, ρ, t 85.7 72.7 100.0 80.0 100.0 80.0 100.0 66.7 80.0
l, ρ, Θ 92.9 72.7 100.0 80.0 100.0 80.0 50.0 66.7 80.0
ρ, Θ, t 100.0 81.8 100.0 100.0 100.0 80.0 100.0 66.7 100.0
l, ρ, Θ, t 100.0 90.9 100.0 100.0 100.0 100.0 100.0 66.7 100.0
19 2 3 9 4 4 1 1 2 2 100
94.7 100.0 66.7 77.8 25.0 25.0 100.0 100.0 100.0 100.0 69.0
100.0 100.0 66.7 100.0 75.0 50.0 100.0 100.0 100.0 100.0 86.0
94.7 100.0 66.7 88.9 100.0 75.0 100.0 100.0 100.0 100.0 87.0
94.7 100.0 100.0 88.9 100.0 75.0 100.0 100.0 100.0 100.0 87.0
94.7 100.0 100.0 88.9 100.0 75.0 100.0 100.0 100.0 100.0 93.0
100.0 100.0 100.0 88.9 100.0 75.0 100.0 100.0 100.0 100.0 96.0
The prior knowledge of P(ωON) takes advantage of our process for using the macula-centered, ETDRS field 2 region of the retina image. For our intended application we will always be working with patient images collected with this protocol. Prior knowledge of the ON coordinate distribution improves our ON detection performance. To demonstrate this effect, the data using all four features in Table 1 were recalculated assuming a uniform prior distribution (i.e., equal ON coordinate probability within the field of view of the fundus camera). For this scenario, aggregate ON detection performance decreased from 96% to 81%. Once we verified the utility of the features being evaluated for ON detection, we performed a second test on the full 395 image population using the automatically determined ON coordinates to determine the efficacy of our macula localization method. Once again, the approximate locations of the ON and macula centers was manually selected for the dataset of 395 images. We randomly selected 50 of the data for training of the ON algorithm according to the same procedure described above. The remaining 345 images were then processed to determine detection and localization performance. While the ON performance was defined earlier in terms of the 1R distance to the manually selected ON coordinate, the criteria for macula localization was defined for the distance 2R, where “2R” refers to one ON diameter. We defined a less stringent requirement on macula localization performance because the macula is typically 2 to 3 times the diameter of the ON in extent. In physical terms, the optic nerve is approximately 1.5 mm in diameter whereas the macula extends to a diameter of approximately 3-4 mm [34], with a foveola distance of 3 mm from the ON. In our fundus imagery this equates to an ON radius of 65 pixels and a
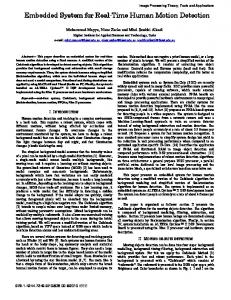
macula radius of 130 pixels, with the foveola located 360 pixels from the center of the ON (i.e., 2.5 ON diameters). Table 2 tabulates the results for ON detection and macula localization for this set of 345 images. ON detection performance is listed for the 1R criteria and the macula localization performance is listed for the 2R criterion. Macula localization performance for the population of patients tested was shown to be 92.5% for the 2R criterion. This result, which is higher than the ON 1R detection performance by 2.1%, indicates that macula localization is not highly sensitive to precise ON coordinate detection which demonstrates the inherent robustness of our method. Although not indicated in Table 2, we performed the ON detection test for the 345 images using a uniform prior, P(ωON). ON detection performance decreased from 90.4% to 87.3%, demonstrating once again the value of using prior knowledge. Fig. 11 summarizes through a histogram the differences between the calculated and manually selected ON coordinates for the 345 fundus images in the data set. This representation of performance details the distribution of distances with a peak difference of 0.46R representing 22.3% of the data. And as described in Table 2, 90.4% of the data falls within the 1R criterion as indicated by the superimposed cumulative distribution curve, with 57.1% of the total data falling within ½ the ON radius. It should be noted that the average likelihood ratio, R(x,y), for all data points less than the 1R criterion is 4-5 times higher than the data that is greater than the 1R criterion. Therefore, our confidence value does appear to provide useful information as to the quality of our prediction of the ON at a particular location in the fundus image. Fig. 12 summarizes macula localization performance through a similar histogram for the
This article has been accepted for publication in a future issue of this journal, but has not been fully edited. Content may change prior to final publication.
TMI-2007-0129.R1
18.00% 16.00%
120.00%
2R 92.5%
14.00%
80.00%
12.00% 10.00%
60.00%
8.00% 40.00%
6.00% 4.00%
20.00%
2.00% 0.00%
Optic Nerve Detection Performance %( at 1R)
Macular Localization Performance %(at 2R)
35
94.3
94.3
29
93.1
96.6
28 34 1 13 4 29 18
92.9 91.2 100.0 69.2 75.0 96.6 88.9
92.9 91.2 100.0 100.0 75.0 100.0 88.9 91.9
37 4 12
94.6 75.0 91.7
100.0 83.3
34 12 28 1 12 5 9 345
97.1 100.0 75.0 100.0 83.3 100.0 77.8 90.4
100.0 100.0 78.6 100.0 83.3 100.0 77.8 92.5
No. of Images
Pathology Age-related macular degeneration (AMD) Cystoid macular edema (CME) Choroidal neovascularization (CNV) Choroidal lesion (ChL) Cone dystrophy (CoDy) Juxtafoveal telangiectasis (JFT) Metastasis (MET) Choroidal melanoma (ML) Normal fundus (NM) Non-proliferative diabetic retinopathy (NPDR) Ocular ischemia (OIS) Optic nerve lesion (ON) Proliferative diabetic retinopathy (PDR) Retinal artery occlusion (RAO) Retinal vein occlusion (RVO) Retinal detachment (ReD) Retinitis pigmentosa (ReP) Sickle cell disease (SC) Stargardt's disease (STAR) Total Performance
120.00%
25.00%
1R 20.00%
90.4%
100.00%
60.00% 10.00%
Cumulative
Percentage
80.00% 15.00%
40.00% 5.00%
20.00%
0.00%
0.00% 0.15 0.31 0.46 0.62 0.77 0.92 1.08 1.54 3.08 4.62 6.15 7.69 More Normalized Distance (1 ON Radius)
Fig. 11. Histogram and cumulative distribution of the distances between the estimated and manually selected ON across the 345 fundus images.
100.00%
Cumulative
Table 2. Performance of the optic nerve detection and macula localization algorithms for the performance criteria related to the optic nerve radius (1R) for ON detection and optic nerve diameter (2R) for macula localization for a population of 345 images.
20.00%
Percentage
2R criterion. Note also, as from Table 2, that 92.5% of the data falls within the 2R criterion as indicated by the superimposed cumulative distribution curve, with about 70% of the total data falling within ½ the ON diameter.
9
0.00% 0.08 0.15 0.23 0.31 0.38 0.46 0.54 0.77 1.54 2.31 3.08 3.85 More Normalized Distance (1 ON Diameter)
Fig. 12. Histogram and cumulative distribution of the distances between the estimated and manually selected macula coordinate across the 345 fundus images.
There are 33 images (i.e., 9.6% of the data) for which the ON was improperly identified within the 1R criterion. Figures 13 and 14 show examples of failed detections including a slightly misdetected ON/macula (i.e., just outside of the 1R criteria) and a severely misdetected ON and macula. The reasons that the algorithms failed to properly identify and locate the optic nerve and macula in these cases is instructive. Fig. 13 shows a retina with a central retinal vein occlusion, characterized by diffuse retinal hemorrhages, swelling, and erythema of the optic nerve. Fig. 14 shows macular scarring from wet age-related macular degeneration (AMD). In Fig. 13, the nerve is swollen and erythematous, blurring the normally distinct margins between the nerve and retina. The erythema also reduces the overall luminance of the ON compared to the retina. In Fig. 14, the luminance of the ON is reduced and is significantly less than that of the dense white macular scar. Smaller retinal vessels and pigmentary changes around the scar were incorrectly interpreted and the macular orientation was reversed 180º, even though the vascular tree was correctly segmented. In both cases, variations from normal ON luminance due to disease states resulted in the ON and macula being misidentified. In general, our algorithm relies on a level of adherence of the visual presentation of the retina to our vascular and luminance model. Except for the severest instances of retinopathy, i.e., those that deviate significantly from this model, the results on our set of 395 red-free fundus images show reliable performance over a large patient population and for a wide variety of disease states. To demonstrate this further, we performed a third and final test on a set of data produced through the STARE project [37].
This article has been accepted for publication in a future issue of this journal, but has not been fully edited. Content may change prior to final publication.
TMI-2007-0129.R1
Fig. 13. Image of a retina with a central retinal vein occlusion, characterized by diffuse retinal hemorrhages, optic nerve swelling, and erythema. The normal contrast in the luminance of the ON compared to the surrounding retina is significantly reduced. The typically distinct margins of the ON are absent. The ON and macula are mapped above the true location of the ON.
10
intact - which we will denote as “Complete Fundus Images” and a population of 24 images in which the ON and/or the macula are significantly occluded or missing – which we will denote as “Occluded Fundus Images.” There were other differences between the STARE dataset and our set of 395 red-free fundus images as well. For example, our dataset has a consistent magnification and field of view for each image (1024 × 1152 pixels in a 50o of view) whereas the STARE dataset exhibited variability in both magnification and pixel resolution (605 × 700 pixels). For example, the average distance between the ON and the macula center across our 395 fundus images was 360 pixels with an ON radius of approximately 65 pixels, whereas in the STARE dataset the average ON / macula distance was 264 pixels with an ON radius of 60 pixels. Despite the difference in magnification and field of view, we applied our algorithm for ON detection without modification (e.g., without rescaling either the images or the filter windows). Two-fold validation testing was performed on the data for training and testing as with the earlier data sets and the prior ON distribution was manually determined from the training data. Table 3 shows a summary of the ON detection performance for these two populations of STARE images. Overall, our performance for images that contained reasonable representations of the macula and ON regions (i.e., the “Complete Fundus Image” set) was 87.7% with the subset of “normal” images performing at 96.0%. And, as anticipated, the Occluded Fundus Image population results were significantly lower at 37.5% for the entire subset and 57.1% for the “normal” category. The slightly lower performance of the STARE dataset for this “Complete” population (i.e., 87.7% versus 90.4%) is primarily a result of the differences in magnification, field of view, and image quality between the two sets.
V. CONCLUSION
Fig. 14. Image of a retina with a macular scarring from wet age-related macular degeneration (AMD). A dense white stellate scar is seen surrounded by small retinal vessels and reactive pigmentary changes. The ON and macula are mapped in a reversed orientation with the macular scar identified as the ON.
This dataset contains 81 red-free fundus images; 31 representing normal retinas and 50 representing various diseased retinas. For our purposes, it is generally required that we obtain a macula-centered image (ETDRS Field 2) with non-occluded macula and ON regions present. The STARE dataset of 81 images contains 26 images that are ON-centered (ETDRS Field 1) therefore occluding the macula region, and 19 additional images that are macula-centered but which occlude a significant fraction of the ON region. Therefore, since our method requires a non-occluded macula and ON region in the image to perform optimally, we have divided the STARE dataset into two populations: a population of 57 ONand macula-centered images with macula and ON regions
We have presented a method for locating the optic nerve and macula in red-free fundus imagery. Our method takes advantage of the characteristics of the vascular structure in the retina to extract statistical features related to the vascular density, orientation, and thickness. These features are used to train and apply a Bayesian classifier to classify the pixels in the original image into the binary category of optic nerve or not optic nerve. The located optic nerve is then used in conjunction with a geometric model of the vasculature to locate the horizontal raphe of the retina and ultimately the macula region. The overall performance of 96.0% correct ON detection was for a subset of 100 images from our original 395 images used to evaluate feature performance. Macula localization was not tested on this subset. The same algorithm applied to a larger testing set of 345 images resulted in a performance of 90.4% correct ON detection and 92.5% macula localization. This result is encouraging for our diverse set of 395 red-free fundus images. Our result of 87.7% ON performance on a subset (chosen by us based on the presence of ON and macula structure) of publicly available STARE images demonstrated reasonable extensibility of the method to
This article has been accepted for publication in a future issue of this journal, but has not been fully edited. Content may change prior to final publication.
TMI-2007-0129.R1 an independently gathered dataset with differing magnification, field of view, and image quality. Our method is shown to be robust for most data over a broad representation of pathologies. Fundus imagery that presented
11
problems typically exhibited significant visual structure that ran counter to our vascular model upon which our features where based.
Table 3. Performance of the ON detection algorithm on a set of 81 publicly available fundus images from the STARE project. “Complete Fundus Images” corresponds to macula centered image data containing the ON, whereas “Occluded Fundus Images” corresponds to images that had grossly occluded ON or macula regions, i.e., that deviate significantly from our vascular and luminance model.
Pathology AMD AR BDR CNV EM HR HistoPlasmosis Nevus Normal Retinitis RAO RVO Vasculitis Telangiectasia UnKnown Total Performance
No. of Examples 4 1 6 7 1 1 1 1 25 3 4 1 2
Complete Fundus Images Optic Nerve Detection Performance %( at 1R) 50.0 100.0 100.0 85.7 100.0 100.0 100.0 100.0 96.0 33.3 75.0 100.0 100.0
4 1 1 7 3 4 1 -
87.7
24
57
VI. REFERENCES [1]
[2] [3]
[4]
[5]
[6]
[7]
[8]
[9]
[10]
A. F. Amos, D. J. McCarty, and P. Zimmet, "The rising global burden of diabetes and its complications: estimates and projections to the year 2010," Diabetic Med, vol. 14, pp. S57-85, 1997. "Centers for Disease Control and Prevention National Diabetes Fact Sheet, http://www.cdc.gov," 2003. C. Stellingwerf, P. Hardus, and J. Hooymans, "Two-field photography can identify patients with vision-threatening diabetic retinopathy: a screening approach in the primary care setting," Diabetes Care, vol. 24, pp. 2086-90, 2001. J. C. Javitt, L. P. Aiello, L. J. Bassi, Y. P. Chiang, and J. K. Canner, "Detecting and treating retinopathy in patients with type I diabetes mellitus: Savings associated with improved implementation of current guidelines," Ophthalmology, vol. 98, pp. 1565-73, October 1991 A. A. Cavallerano, J. D. Cavallerano, P. Katalinic, A. M. Tolson, and L. P. Aiello, "Use of Joslin Vision Network digital-video nonmydriatic retinal imaging to assess diabetic retinopathy in a clinical program," Retina, vol. 23, pp. 215-23, April 2003 S. R. Fransen, T. C. Leonard-Martin, W. J. Feuer, and P. L. Hildebrand, "Clinical evaluation of patients with diabetic retinopathy: accuracy of the Inoveon diabetic retinopathy-3DT system," Ophthalmology, vol. 109, pp. 595-601, March 2002 D. Y. Lin, M. S. Blumenkranz, R. J. Brothers, and D. M. Grosvenor, "The sensitivity and specificity of single-field nonmydriatic monochromatic digital fundus photography with remote image interpretation for diabetic retinopathy screening: a comparison with ophthalmoscopy and standardized mydriatic color photography," Am J Ophthalmol., vol. 134, pp. 204-13, Aug 2002 M. Larsen, J. Godt, and M. Grunkin, "Automated detection of diabetic retinopathy in a fundus photographic screening population," Invest Ophthal Vis Sci, vol. 44, pp. 767-71, 2003. T.Teng, M. Lefley, and D. Claremont, "Progress towards automated diabetic ocular screening: a review of image analysis and intelligent systems for diabetic retinopathy," Med. Biol. Eng. Comput., vol. 40, pp. 2-13, 2002. N. Patton, T. M. Aslam, T. MacGillivary, I. J. Deary, B. Dhillon, R. H. Eikelboom, K. Yogesan, and I. J. Constable, "Retinal image
[11] [12]
[13]
[14]
[15]
[16]
[17]
[18]
[19]
[20]
[21]
No. of Examples 3
Occluded Fundus Images Optic Nerve Detection Performance %( at 1R) 0.0 50.0 100.0 100.0 57.1 0.0 0.0 100.0 37.5
analysis: Concepts, applications and potential," Progress in Retinal and Eye Research, vol. 25, pp. 99-127, 2006. H. Sun and J. Nathans, "The challenge of macular degeneration," Scientific American, pp. 69-75, Oct 2001. M. Foracchia, E. Grisan, and A. Ruggeri, "Luminosity and contrast normalization in retinal images," Medical Image Analysis, vol. 9, pp. 179-190, June 2005. M. E. Martin-Perez, A. D. Hughes, A. V. Staanton, S. A. Thom, A. A. Bharath, and K. H. Parker, "Segmentation of retinal blood vessels based on the second directional derivative and region growing," in IEEE International Conference on Image Processing, 1999, pp. 173-176. T. Lin and Y. Zheng, "Adaptive image enhancement for retinal blood vessel segmentation," Electronic Letters, vol. 38, pp. 10901091, Sep 2002. Z. H. Qing, "Segmentation of blood vessels in retinal images using 2-D entropies of gray level-gradient co-occurrence matrix," in IEEE International Conference on Acoustics, Speech, and Signal Processing, 2004, pp. 509-512. J. Staal, M. D. Abramoff, M. Niemeijer, M. A. Viergever, and B. V. Ginneken, "Ridge-Based Vessel Segmentation in Color Images of the Retina," IEEE Trans. on Medical Imaging, vol. 23, pp. 501509, April 2004. A. Hoover and M. Goldbaum, "Locating the optic nerve in a retinal image using the fuzzy convergence of the blood vessels," IEEE Tran. on Medical Imaging, vol. 22, pp. 951-958, Aug 2003. M. Foracchia, E. Grisan, and A. Ruggeri, "Detection of the optic disc in retinal images by means of a geometrical model of vessel structure," IEEE Trans. on Medical Imaging, vol. 23, pp. 11891195, Oct 2004. A. D. Fleming, K. A. Goatman, S. Philip, J. A. Olson, and P. F. Sharp, "Automatic detection of retinal anatomy to assist diabetic retinopathy screening," Physics in Medicine and Biology, vol. 52, pp. 331-345, 2007. M. D. Abramoff and M. Niemeijer, "The automatic detection of the optic disc location in retinal images using optic disc location regression," in Proc. 28th IEEE EMBS Annual Conference, 2006, pp. 4432-4435. M. D. Abramoff, W. L. Alward, E. C. Greenlee, L. Shuba, C. Y. Kim, J. H. Fingert, and Y. H. Kwon, "Automated segmentation of
This article has been accepted for publication in a future issue of this journal, but has not been fully edited. Content may change prior to final publication.
TMI-2007-0129.R1
[22]
[23]
[24]
[25]
[26] [27]
[28]
[29]
[30]
[31] [32]
[33]
[34] [35]
[36]
the optic disc from stereo color photographs using physiologically plausible features," Invest Ophthalmol Vis Sci., vol. 48, pp. 166573, April 2007 M. B. Merickel, M. D. Abramoff, M. Sonka, and X. Wu, "Segmentation of the optic nerve head combining pixel classification and graph search," in Proc. of SPIE, 2007, pp. 651215-10. D. T. Morris and C. Donnison, "Identifying the neuroretinal rim boundary using dynamic contours," Image and Vision Computing, vol. 17, pp. 169-174, 1999. A. Pinz, S. Bernogger, P. Datlinger, and A. Kruger, "Mapping the human retina," IEEE Trans Med Imaging, vol. 17, pp. 606-19, Aug 1998 H. Li and O. Chutatape, "Automated feature extraction in color retinal images by a model based approach," IEEE Trans Biomed Eng., vol. 51, pp. 246-54, Feb 2004 C.-H. Wu and G. Agam, "Probabilistic retinal vessel segmentation," in Proc. of SPIE, 2007, pp. 6512131-8. M. Niemeijer, M. D. Abramoff, and B. v. Ginneken, "Segmentation of the optic disc, macula and vascular arch in fundus photographs," IEEE Trans Med Imaging, vol. 26, pp. 116-127, Jan 2007 N. H. Solouma, A. M. Youssef, Y. A. Badr, and Y. M. Kadah, "A New Real-Time Retinal Tracking System for Image-Guided Laser Treatment," IEEE Trans on Biomedical Engineering, vol. 49, pp. 1059-1067, Sept 2002. E. Trucco and P. J. Kamat, "Locating the Optic Disk in Retinal Images via Plausible Detection and Constraint Satisfaction," in IEEE International Conference on Image Processing, 2004 L. Gagnon, M. Lalonde, M. Beaulieu, and M.-C. Boucher, "Procedure to detect anatomical structures in optical fundus images," in Proceedings of SPIE, 2001, pp. 1218-1225. R. O. Duda, P. E. Hart, and D. G. Stork, Pattern Classification, 2nd ed. New York: John Wiley and Sons, Inc., 2001. T. Chanwimaluang, G. Fan, and S. R. Fransen, "Hybrid Retinal Image Registration," IEEE Tran. on Information Tech. in Biomedicine, vol. 10, pp. 129-142, Jan 2006. F. Zana and J. Klein, "Segmentation of Vessel-Like Patterns Using Mathematical Morphology and Curvature Evaluation," IEEE Trans. On Image Processing, vol. 10, pp. 1010-1019, July 2001. J. Schwiegerling, Field Guide to Visual and Ophthalmic Optics. Bellingham, Washington: SPIE Press, 2004. W. T. Freeman and E. H. Adelson, "The Design and Use of Steerable Filters," IEEE Trans. on Pattern Analysis and Machine Intelligence, vol. 13, pp. 891-906, Sept 1991. D. Marquardt, "An Algorithm for Least-Squares Estimation of Nonlinear Parameters," SIAM Journal Applied Math, vol. 11, pp. 431-441, 1963.
Kenneth W. Tobin is a Corporate Research Fellow and Group Leader of the Image Science and Machine Vision Group at the Oak Ridge National Laboratory, Oak Ridge, Tennessee. The group performs applied computer vision research and development in biomedical imaging, industrial inspection, and national security. He performs research in image processing, pattern recognition, and image-based metrology for automation and process characterization. In the areas of biomedical imaging he is developing new computational methods for analyzing, managing, and re-using large repositories of anatomical and functional imagery. This research is resulting in the development of data management systems and strategies to improve data mining, diagnosis, and telemedicine technologies. He has authored and co-authored over 135 publications and he currently holds nine U.S. Patents and two pending patents in the areas of computer vision, photonics, radiography, and microscopy. Dr. Tobin is a Fellow of the International Society for Optical Engineering and a Senior Member of the IEEE. He has a Ph.D. in Nuclear Engineering from the University of Virginia, Charlottesville, Virginia, and an MS in Nuclear Engineering and a BS in Physics from Virginia Tech., Blacksburg, Virginia. Edward Chaum is the Plough Foundation Professor of Retinal Diseases at the University of Tennessee Health Science Center (UTHSC), Hamilton Eye Institute. He is Professor of Ophthalmology, and Associate Professor of Pediatrics, Anatomy & Neurobiology, & Biomedical Engineering at the UTHSC. Dr. Chaum obtained his Ph.D. from Cornell Graduate School of
12
Medical Sciences, and his M.D. from Cornell University Medical College in New York City. He is Board certified in Pediatrics (Massachusetts General Hospital, Boston) and Ophthalmology, (University Hospital, Boston) and received fellowship training in medical and surgical Retina at Massachusetts Eye & Ear Infirmary, Boston. Dr. Chaum has published more than 30 articles and chapters on clinical and basic science related to retinal disease. His research interests include translational research; the development and application of gene therapy to the understanding and treatment of developmental and degenerative retinal diseases, tissue engineering approaches to understanding and modulating the growth, aging and injury responses of the retina to oxidative stress; the application of new technologies to ophthalmology and the development of internet-based, automated, diagnostic methods for blinding eye diseases. Other areas of interest include the application of electrochemical sensors and nanotechnology to clinical medicine and surgery and the development of novel ocular surgical instrument designs based upon new biomaterials and nanofabrication techniques. V. Priya Govindasamy is a member of the Image Science and Machine Vision Group at the Oak Ridge National Laboratory, Oak Ridge, Tennessee. She received her Masters Degree in Electrical Engineering from the University of Tennessee, Knoxville, Tennessee in December 2004. Her field of specialization is image processing and computer vision. She has experience in medical imaging, thermal image processing and image restoration. She is currently working on the National Eye Institute funded project “Automated Screening for Diabetic Retinopathy”. Ms. Govindasamy is a member of the IEEE. Thomas P. Karnowski is an R&D Staff Member in the Image Science and Computer Vision Group at Oak Ridge National Laboratory. He received his B.S. in Electrical Engineering from the University of Tennessee-Knoxville in 1988 and his M.S. in Electrical Engineering from North Carolina State University in 1990. In 1990 he joined the Real-Time Systems Group of Oak Ridge National Laboratory and joined the Image Science and Machine Vision Group in 1995. His current research interests are content-based image retrieval, retinal image processing, and traffic monitoring through video analysis. He is a co-inventor of two patents and author or co-author of over 30 papers in the field of optical and image processing and pattern recognition. He received a National Federal Laboratory Consortium Award for Excellence in Technology Transfer in 1998 and 2002 and an R&D 100 award in 2002. He is a member of the IEEE.