WATER RESOURCES RESEARCH, VOL. 34, NO. 10, PAGES 2573–2585, OCTOBER 1998
Detection of aquifer system compaction and land subsidence using interferometric synthetic aperture radar, Antelope Valley, Mojave Desert, California D. L. Galloway,1 K. W. Hudnut,2 S. E. Ingebritsen,3 S. P. Phillips,1 G. Peltzer,4 F. Rogez,4 and P. A. Rosen4 Abstract. Interferometric synthetic aperture radar (InSAR) has great potential to detect and quantify land subsidence caused by aquifer system compaction. InSAR maps with high spatial detail and resolution of range displacement (610 mm in change of land surface elevation) were developed for a groundwater basin (;103 km2) in Antelope Valley, California, using radar data collected from the ERS-1 satellite. These data allow comprehensive comparison between recent (1993–1995) subsidence patterns and those detected historically (1926 –1992) by more traditional methods. The changed subsidence patterns are generally compatible with recent shifts in land and water use. The InSARdetected patterns are generally consistent with predictions based on a coupled model of groundwater flow and aquifer system compaction. The minor inconsistencies may reflect our imperfect knowledge of the distribution and properties of compressible sediments. When used in conjunction with coincident measurements of groundwater levels and other geologic information, InSAR data may be useful for constraining parameter estimates in simulations of aquifer system compaction.
U.S. Geological Survey, Sacramento, California. U.S. Geological Survey, Pasadena, California. 3 U.S. Geological Survey, Menlo Park, California. 4 Jet Propulsion Laboratory, California Institute of Technology, Pasadena.
oratory, written communication, 1997; M. van der Kooij, Atlantis Scientific Inc., written communication, 1997). We employ InSAR to study a particular case of a global problem, that of regional land subsidence related to aquifer system compaction. Land subsidence caused by groundwater pumping is due to compaction of aquitards during the time-dependent and typically slow process of aquitard drainage [Tolman and Poland, 1940]. Compaction describes the inelastic aquitard or aquifer system compression, reflecting rearrangement of the pore structure under effective stresses greater than the maximum past stress, and is synonymous with the term “virgin consolidation” as used in soil mechanics. Studies of subsidence in the Santa Clara Valley [Tolman and Poland, 1940; Poland and Green, 1962; Green, 1964; Poland and Ireland, 1988] and San Joaquin Valley [Poland, 1960; Miller, 1961; Riley, 1969; Helm, 1975; Poland et al., 1975; Ireland et al., 1984] in California established the theoretical and field application of Terzaghi’s [1925, 1943] laboratory-derived principle of effective stress and theory of hydrodynamic consolidation. We studied an InSAR interferogram for a groundwater basin in Antelope Valley, Mojave Desert, California (Figure 1), where the U.S. Geological Survey has been collecting geohydrologic and geodetic data for many decades. The interferogram was originally developed by the Jet Propulsion Laboratory (JPL) to study crustal deformation in the Los Angeles area and along the San Andreas fault. We recognized that the small, spatially diffuse displacements detected in Antelope Valley could be related to land subsidence. More than 1.8 m of subsidence attributable to aquifer system compaction in Antelope Valley between 1926 and 1992 had already been measured by traditional surveying methods and the global positioning system [Ikehara and Phillips, 1994].
Copyright 1998 by the American Geophysical Union.
1.1.
Paper number 98WR01285. 0043-1397/98/98WR-01285$09.00
When two radar scans are made from the same viewing angle but at different times, a small change in the position of
1.
Introduction
Geophysical applications of radar interferometry take advantage of the phase component of reflected radar signals to measure apparent changes in the range distance of ground reflectors, that is, the land surface [Gabriel et al., 1989]. Interferograms, formed from patterns of interference between the phase components of two radar scans made from the same antenna position (viewing angle) but at different times, have demonstrated dramatic potential for high-density spatial mapping of ground surface deformations associated with tectonic [Massonnet et al., 1993; Zebker et al., 1994] and volcanic strains [Massonnet et al., 1995; Rosen et al., 1996]. When the target is the land surface and the antenna is part of a synthetic aperture radar (SAR) platform on an Earth-orbiting satellite, the radar scan may encompass 10,000 km2, and a single picture element (pixel) of the reflected signal may represent an area as small as 100 m2. Mapping programs are recognized as a critical element in efforts to identify and manage subsidence problems [National Research Council, 1991], and interferometric synthetic aperture radar (InSAR) has recently been used to map localized crustal deformation and land subsidence associated with geothermal fields in Imperial Valley, California [Massonnet et al., 1997], Long Valley, California (W. Thatcher, U.S. Geological Survey (USGS), written communication, 1997), and Iceland [Vadon and Sigmundsson, 1997], and with oil and gas fields in the Central Valley, California (E. Fielding, Jet Propulsion Lab1 2
2573
InSAR
2574
GALLOWAY ET AL.: DETECTING AQUIFER SYSTEM COMPACTION
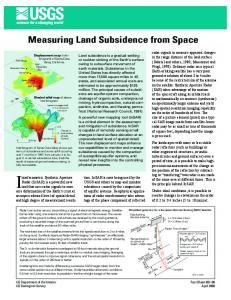
Figure 1. Antelope Valley location map.
the target may create a detectable change in the phase of the reflected signal. In a coherent radar the phase is exactly proportional to the measured time delay and effective path length of the signal. The path differences of two signals can be determined to subwavelength accuracy by observing the phase differences of the echoes. If there is significant topographic relief in the target area and/or the radar antenna positions are significantly different, a component of any phase difference may be caused by topographic effects. Temporal and spatial variations in tropospheric water vapor content and, to a lesser extent, in pressure and temperature can also induce phase distortions in the reflected radar signals and compromise the effectiveness of interferometric techniques. Zebker et al. [1997] found errors of 10 –14 cm in interferometrically derived crustal deformation estimates for relative humidity variations of 20% over Kilauea volcano, Hawaii. In the Mojave Desert, Goldstein [1995] measured subcentimeter-level distortions in path length due to atmospheric effects. In humid regions, averaged, independent multiple observations may be required to reduce tropospheric distortions to the centimeter level [Zebker et al., 1997; Fujiwara et al., 1998]. The Antelope Valley interferogram was based on C band (56-mm wavelength) SAR data collected by the European Remote Sensing satellite ERS-1. To reduce phase noise, the full resolution SAR data were averaged, referenced to geographic coordinates, and resampled, resulting in a relatively smoothed, georeferenced displacement surface at a pixel size of 90 m 3 90 m. A three-pass interferometric method, successfully employed to detect ice sheet movement and seismic crustal displacements [Goldstein et al., 1993; Zebker et al., 1994; Peltzer and Rosen, 1995; Peltzer et al., 1996], was used to form a radar
triplet from which two interferometric pairs were formed: one that contained solely topographic interference, and a second that contained both topography and change interference. The radar triplet chosen has optimum orbital baseline separations representing an altitude ambiguity [Massonnet and Rabaute, 1993] of 200 m for the change pair and ;130 m for the topographic pair. The topographic pair was formed from radar scans made on September 15, 1993, and October 20, 1993, and was used to remove the topographic component of phase differences from the change pair, which spans a time interval of approximately 26 months from October 20, 1993, to December 22, 1995. The resulting interferogram contained any range displacements due to land subsidence plus any artifacts due primarily to signal propagation errors and temporal and/or spatial decorrelation of the land surface. The Mojave Desert environment is nearly ideal for achieving longer-term (months to years) coherence between repeat pass radar images. The generally stable soil moisture conditions, slow-growing vegetation, and absence of large-scale agricultural land use in Antelope Valley favor the stability of ground surface reflection, though intermittent flooding of the usually dry lakes and playa surfaces during the winter is a potential source of decorrelation on Rosamond Lake, Rogers Lake, and some of the smaller nearby playas. Changes in the atmospheric moisture content between two radar acquisitions can lead to phase shifts and artificial fringes on either the change pair or the topographic pair interferograms. There were no obvious atmospheric contributions to the interferogram, and no attempt was made to evaluate the potential interferometric effects of changes in atmospheric conditions between the three scenes. Future work might make use of multiple interferograms to analyze any atmospheric artifacts. In the absence of a complete set of coincident terrestrial geodetic measurements for the period of the interferogram, we use information regarding historical subsidence trends, aquifer system compaction, subsurface geology, aquifer system hydraulic properties, groundwater use, and land use change to evaluate the InSAR observations and their relation to land subsidence. We use these data to constrain simulations coupling groundwater flow and aquifer system compaction to determine whether InSAR-detected displacements could in fact be explained by aquifer system compaction. Contemporaneous aquifer system compaction data collected from a borehole extensometer on Edwards Air Force Base in Antelope Valley are used to relate the InSAR-detected displacement to measured displacement at that particular site. 1.2.
Principles of Aquifer System Deformation
The relation between changes in pore fluid pressure and compression of the aquifer system is based on the principle of effective stress first proposed by Terzaghi [1925],
s e 5 s T 2 p,
(1)
where effective or intergranular stress (se) is the difference between the total stress (sT) and the pore fluid pressure ( p). Under this principle, when the total stress remains constant, a change in pore fluid pressure causes an equivalent change in effective stress within the aquifer system, which causes the aquifer system skeleton to compress or expand under the new load. When the effective stress is decreased by an increase in pore fluid pressure, the aquifer system expands elastically. When the effective stress is increased by a reduction in pore
GALLOWAY ET AL.: DETECTING AQUIFER SYSTEM COMPACTION
2575
fluid pressure and the effective stress does not exceed the maximum past effective stress, the aquifer system compresses elastically. When a reduction in pore fluid pressure causes an increase in effective stress to values greater than the previous maximum effective stress, the pore structure of the finegrained aquitards in the system undergoes significant rearrangement, resulting in a permanent reduction of pore volume and compaction of the aquitards. This process can be quantified in terms of two compressibilities, one elastic and one inelastic, each of which can be applied to the aquifer system as a whole or, if the stratigraphy is well defined, to the aquitards only. The elastic and inelastic skeletal compressibilities, ak9 , of the aquitards are expressed in terms of the skeletal specific storages, S9sk, S9sk 5 S9ske 5 a 9ker g,
s e , s e(max),
S9sk 5 S9skv 5 a 9kvr g,
s e . s e(max),
(2)
where the primes signify aquitard properties, subscripts e and v refer to the elastic and virgin (inelastic) properties, r is fluid density, and g is gravitational acceleration. For a change in effective stress, the aquitard deforms elastically when the effective stress is less than the previous maximum effective stress, se(max); when the effective stress is greater than se(max), the aquitard deforms inelastically. In typical aquifer systems composed of unconsolidated to semiconsolidated late Cenozoic sediments, S9skv is generally 30 to several hundred times larger than S9ske [Ireland et al., 1984]. The product of the elastic or inelastic skeletal specific storage and the aggregate thickness of the aquitards, ¥b9, is the aquitard skeletal storage coefficient S9k: S9k 5 S9ke 5 S9ske~¥b9!,
s e , s e(max),
S9k 5 S9kv 5 S9skv~¥b9!,
s e . s e(max),
(3)
for the elastic (S9ke) and inelastic (S9kv) range of skeletal compressibility, respectively. A similar set of equations, one for the coarse-grained aquifers and one for the pore water, relates the compressibility of the aquifer skeleton (ak) to the aquifer skeletal storage coefficient (S k) and the compressibility of water (bw) to the component of aquifer system storage attributed to the pore water (S w): S k 5 S sk~¥b! < a ker g~¥b!,
(4)
S w 5 b wr g@n~¥b! 1 n9~¥b9!#,
(5)
where ¥b is the aggregate thickness of the aquifers and n and n9 are the porosities of the aquifers and aquitards, respectively. For coarse-grained aquifers interbedded with compacting aquitards, the difference between the elastic and inelastic compressibilities of the aquifer skeleton is considered relatively insignificant, and ak ' ake (equation (4)). The aquifer-system storage coefficient S* is defined as the sum of the skeletal storage coefficients of the aquitards and aquifers (equations (3)–(4)) plus the storage attributed to water compressibility (equation (5)). Thus S* 5 S9k 1 S k 1 S w.
(6)
For compacting aquifer systems, S9skv .. S sw, and the inelastic storage coefficient of the aquifer system is approximately equal to the inelastic aquitard skeletal storage coefficient, S *v ' S9kv. In confined aquifer systems subject to large-scale overdraft, the volume of water derived from irreversible aquitard compaction
Figure 2. Generalized hydrogeologic section through Antelope Valley. Line of section shown in Figure 1 (modified from Londquist et al. [1993]).
can typically range from 10 to 30% of the total volume of water pumped and represents a one-time mining of stored groundwater and a small permanent reduction in the storage capacity of the aquifer system.
2.
Groundwater Depletion and Land Subsidence
Antelope Valley is an arid valley in the western corner of the Mojave Desert, about 60 km northeast of Los Angeles (Figure 1). The triangular valley is bounded on the southwest by the San Gabriel Mountains, on the northwest by the Tehachapi Mountains, and by lower hills, ridges, and buttes to the north and east. It is a topographically closed basin with surface water runoff terminating in several playas. Average annual precipitation varies from about 1 m near the crests of the San Gabriel Mountains to 0.1 m on the valley floor [Rantz, 1969]. Antelope Valley overlies three large structural basins filled to depths of more than 1.5 km with Tertiary and Quaternary alluvial sediments eroded from the adjacent highlands. The basin fill sediments constitute a vast groundwater basin that has been subdivided conceptually into 12 subbasins [Thayer, 1946], of which the Lancaster subbasin (Figure 1) is by far the largest and most developed. The Lancaster subbasin has been subdivided vertically into aquifer systems consisting of transmissive aquifers interbedded with relatively nontransmissive aquitards [Londquist et al., 1993]. The main aquifer systems are known locally as the “principal aquifer” and the “deep aquifer” (Figure 2); they consist of poorly consolidated, variably sorted beds of clay, silt, sand, and gravel. At moderate depths below the water table the principal aquifer system is partially confined by fine-grained interbedded aquitards; it is separated from the deep aquifer system by laterally extensive, thick (.30 m) lacustrine deposits. Before agricultural development in the early part of this century, groundwater flowed from recharge areas near the San Gabriel and Tehachapi Mountains toward meadows, marshes, and springs (now dry) near the center of Antelope Valley. The earliest irrigation systems, dependent on surface streams, failed to provide a stable and reliable water source for crop production and were soon augmented by groundwater-based systems [Thompson, 1929]. Groundwater pumpage for crop
2576
GALLOWAY ET AL.: DETECTING AQUIFER SYSTEM COMPACTION
Figure 3. Land subsidence in Antelope Valley, about 1930 – 1992 (adapted from Ikehara and Phillips [1994]).
production reached peak levels of 3–5 3 108 m3 yr21 in the late 1950s [Templin et al., 1994]. Groundwater remained the principal source of water supply until the middle 1970s, when imported water was delivered via the California Aqueduct. By this time, irrigated acreage and groundwater use for crop production were on a steady decline due in part to the increasingly large depth to groundwater and associated costs of pumping; by 1991 agricultural water use had decreased to 20% of peak levels. During the 1980s the population of Antelope Valley nearly doubled as the predominant land use shifted from irrigated agriculture to urban. Again, groundwater use began to increase, this time to support the growing population. Currently, about 1 3 108 m3 of groundwater are pumped annually, mainly to meet the growing municipal/industrial water demand, and the spatial distribution of pumpage is substantially different than during the agricultural era. Groundwater withdrawals far in excess of the natural recharge, estimated at less than 0.7 3 108 m3 yr21 [Snyder, 1955; Durbin, 1978], continue to cause land subsidence. The historical relation between groundwater level declines and regional land subsidence in Antelope Valley was established on the basis of hydrologic measurements and a combination of spirit leveling and global positioning system surveys made from 1926 to 1992 [Ikehara and Phillips, 1994]. By 1992, more than 1.8 m of subsidence attributable to groundwater withdrawal had occurred in parts of Antelope Valley (Figure 3). By 1992 an area of 740 km2 had been affected by more than 0.3 m of land subsidence and accounted for a conservatively estimated permanent loss of aquifer system storage of about 0.6 3 108 m3 [Ikehara and Phillips, 1994], an amount roughly equivalent to the mean annual recharge.
Groundwater levels have fallen more than 90 m in some areas, and generally more than 30 m in most of the Lancaster subbasin (Figure 4). The largest water level declines have occurred around the southern and western margins of the subbasin. Despite the water level declines, no significant land subsidence has been recorded in these areas (Figure 3). This can likely be explained by the relative absence of fine-grained, compressible sediments where recent and older buried alluvial fans occur. For example the thick, laterally extensive lacustrine units present in the central portion of the basin are absent in the extreme southern portion of the subbasin near Palmdale and in the western portion of the subbasin (Figures 2–3), and no appreciable thickness of interbedded aquitards has been mapped in the principal aquifer system in these regions [Durbin, 1978; Londquist et al., 1993]. The largest measured subsidence has occurred in two separate areas: one centered on the city of Lancaster and another about 10 km east of Lancaster (Figure 3), where large amounts of groundwater were once pumped for irrigation and a significant aggregate thickness of fine-grained, compressible sediments has been mapped. In general, there is good correlation between the distribution of the laterally extensive lacustrine units that serve to confine the deep aquifer system and the historically mapped land subsidence (Figure 3). In Lancaster, seasonal water level fluctuations are imposed on a long period of monotonic water level decline that has amounted to about 50 m since the early 1940s (Figure 5). East of Lancaster, water levels have recovered nearly 15 m since 1970 owing to a reduction in irrigated acreage. The transition from an essentially agricultural water demand to a predominantly municipal/industrial water demand, begun in the early 1960s, became fully manifest by the early 1990s. While irrigated acreage was reduced by 80%, urban land use increased by more than 200%. The magnitude of groundwater pumpage in Antelope Valley is still greatly diminished in relation to 1960s levels, and groundwater levels are presently recovering in the eastern and western rural areas of the sub-
Figure 4. Groundwater level declines in the Lancaster groundwater subbasin, 1915–1991.
GALLOWAY ET AL.: DETECTING AQUIFER SYSTEM COMPACTION
basin, which had previously supported intensive irrigated agriculture. However, groundwater levels in the urbanizing areas in and around Lancaster and Palmdale and around Rogers Lake on Edwards Air Force Base continue to show steady declines (Figure 6). Differential land subsidence in Antelope Valley has promoted the formation of earth fissures and has altered surface drainage gradients, contributing to erosion and flooding problems, as is particularly evident in Rogers (dry) Lake. In January 1991 an earth fissure ruptured the surface of Rogers Lake on Edwards Air Force Base, prompting the closure of the southern portion of the lake bed to aircraft operations, including NASA space shuttle landings [Blodgett and Williams, 1992]. The fissure, up to 2 m wide, at least 4 m deep, and extending more than 400 m, formed near the margin of the groundwater subbasin in an area where inspection revealed recent (10 –20 yrs), en echelon traces of healed fissures. T. L. Holzer and M. M. Clark of the U.S. Geological Survey (unpublished report for Soil Conservation Service, 1981) described a similar, 600m-long, 2.3-m-deep arcuate earth fissure first noticed by residents in 1978 about 11 km east-northeast of the city of Lancaster. The locations of these two fissures are shown on the InSAR map (Plate 1). Numerous similar, but generally smaller, earth fissures have been mapped in a 25-km2 area in the northwest portion of Lancaster and attributed to tensional forces created by regional land subsidence (C. Swift, GeolabsWestlake Village, written communication, 1991). Similar earth fissures at the margins of alluvial basins have been associated with differential aquifer system compaction throughout the western United States [Holzer, 1984]. 2.1. InSAR-Detected Land Subsidence: October 1993 to December 1995 The InSAR data allow comparison between recent (1993– 1995) subsidence patterns and those detected historically (1926 –1992) by more traditional methods (Plate 1). Because the line-of-sight of the ERS-1 satellite is reclined 238 from vertical at the center of the scene [European Space Agency,
Figure 5. Paired groundwater level and land subsidence time series observations. Locations of benchmarks and wells are shown in Figure 1.
2577
Figure 6. Groundwater level changes in the Lancaster groundwater subbasin, 1983–1996. 1992], we have adjusted the range displacements sensed in the Antelope Valley interferogram by an approximation, cos (238)21, to compute an equivalent vertical displacement or land subsidence. One color cycle on the interferogram represents 56 mm of range displacement or about 61 mm of vertical displacement. The color range displayed in Plate 1 has been selected in order to range the maximum detected vertical displacement of 50 mm. We have assumed that only the vertical component of land subsidence is significant, although significant horizontal displacements are known to occur in subsiding basins and it is worth noting that InSAR has potential to provide some means to map these component displacements. The U.S. Geological Survey has measured aquifer system compaction and groundwater levels at a borehole extensometer installation south of Rogers Lake since 1990 [Londquist et al., 1993; Freeman, 1996; M. Sneed, USGS, written communication, 1997]. During the period corresponding to the interferogram, 31 mm of aquifer-system compaction were measured on the extensometer (Figure 7a). The extensometer provides a measure of compaction in the interval 6 –256 m below land surface at submillimeter resolution of displacement. A recent differential Global Positioning System (GPS) survey with an expected measurement error of 610 mm indicates that 117 mm of land subsidence has occurred at the extensometer site between August 6, 1992, and January 5, 1998. During this same period, the extensometer measured only 79 mm of compaction, or about 68% (65% accounting for GPS measurement error) of the total measured subsidence. Accounting for the fraction of land subsidence that may be occurring as a result of deep compaction below the base of the extensometer, we would expect to measure between 42 and 49 mm of total compaction or land subsidence at the extensometer site during the period of the interferogram. The InSAR-detected subsidence at the extensometer is 40 mm (Plate 1) and is reasonable compared with the terrestrial measurements. The region on the InSAR-derived displacement map where detected subsidence exceeds about 10 mm generally corresponds well with the shape of the historical subsidence pattern. A local maximum (;50 mm) occurs in the Lancaster area and corresponds roughly to the location of the historical maximum
2578
GALLOWAY ET AL.: DETECTING AQUIFER SYSTEM COMPACTION
cated ongoing subsidence despite significant water level recoveries. The InSAR vertical displacement map appears to support this finding, which suggests that residual compaction may be occurring in thick, slowly draining aquitards. The stressdisplacement trajectories measured at the extensometer south of Rogers Lake confirm residual compaction, as evidenced by open hysteresis loops that result when the applied stress cycles between seasonally maximum and minimum values (Figure 7b). There is an absence of rebound, and in fact a small net compaction during seasonal groundwater level recoveries, followed by an increased rate of compaction during the seasonal groundwater level declines. 2.2. Simulation of Aquifer System Compaction and the InSAR Map
Figure 7. Paired aquifer system compaction and hydraulic head time series observations from borehole extensometerpiezometer installations south of Rogers Lake, Edwards Air Force Base, 1990 –1996: (a) groundwater levels measured in the upper zone of the deep aquifer system and aquifer-system compaction measured in the interval 6 –256 m below land surface, and (b) applied stress-displacement trajectories.
subsidence measured in the valley (1.8 m). Another local maximum (;50 mm) on the displacement map occurs in the area south of Rogers Lake. The beige tone covering most of Rosamond Lake and the southeastern portion of Rogers Lake signifies regions of poor coherence of the phase component, probably due to flooding of the playa surfaces in one or more of the radar images. The InSAR-derived displacement map (Plate 1) also suggests that somewhat less than 25 mm of subsidence occurred during the 26-month period prior to December 22, 1995, in an area near the east central margin of the valley where nearly 1.8 m of historical subsidence had been measured [Ikehara and Phillips, 1994]. This region experienced a decline in agricultural land use and associated groundwater pumpage prior to 1992, which has resulted in the recovery of groundwater levels by as much as 10 –12 m (Figure 6). One might expect that subsidence would be arrested in this region owing to the recovery of water levels, but comparisons between 1992 elevations determined at several benchmarks in this region (Figures 3 and 5) and earlier surveys conducted during the 1980s indi-
In the absence of a complete set of coincident terrestrial geodetic measurements for the period of the interferogram, we simulated land subsidence in the Lancaster groundwater subbasin to determine whether the InSAR-detected displacements could reasonably be explained by aquifer system compaction. The simulation is based on the available hydrogeologic, land survey, and borehole extensometer data for the basin and represents our preliminary expectation for land subsidence due to aquifer system compaction during the period of the interferogram. We constrain the simulations of aquifer system compaction and land subsidence during the period of the interferogram using available information on changes in groundwater levels for the period 1983–1996, historical land subsidence for the period 1926 –1992, and aquifer system compaction measured at the borehole extensometer south of Rogers Lake since 1990. The simulation does not represent a rigorously calibrated model of groundwater flow and aquifer system compaction in Antelope Valley but instead is formulated to evaluate changes in the system’s theoretical response to measured stresses during the study period and is further limited by the assumptions used in the models. A calibrated regional groundwater flow and aquifer system compaction model is currently being developed for Antelope Valley to aid in managing groundwater use and land subsidence (S. Phillips, USGS, written communication, 1997). We simulated one-dimensional (vertical) deformation caused by changes in effective stress during the period spanned by the interferogram, October 20, 1993, to December 22, 1995. The simulations couple groundwater flow, elastic compression and expansion of the aquifers and interbedded aquitards in the aquifer system, and inelastic compaction of the aquitards. The model was based on an earlier conceptual and numerical model of groundwater flow for the Antelope Valley [Durbin, 1978] and incorporated available recent information regarding hydrogeologic conditions and water use. The earlier finite-element model [Durbin, 1978] was recast in the format of a finite-difference numerical groundwater flow model, MODFLOW [McDonald and Harbaugh, 1988]. We used two model layers, one each for the principal and deep aquifer systems (Figure 2). The intervening confining unit was simulated as a zone of reduced vertical conductance between the two layers (aquifer systems) over an areal extent defined by the distribution of lacustrine deposits (Figure 3). The MODFLOW simulations included some modifications to the Durbin [1978] model in order to simulate coupled deformation of the aquifer system. These were accomplished using the MODFLOW interbed storage package, IBS1 [Leake, 1990; Leake and Prudic, 1991]. IBS1 simulates the elastic compression and expansion and
GALLOWAY ET AL.: DETECTING AQUIFER SYSTEM COMPACTION
2579
Figure 8. Distribution of aquitard-interbed skeletal elastic and inelastic storage coefficient values, S9ke and S9kv, respectively, used in the Antelope Valley simulation: (a) principal aquifer system and (b) deep aquifer system. inelastic compaction of interbedded aquitards, which are treated as laterally discontinuous beds of compressible clay and silt within which water flows vertically to and from adjacent coarse-grained beds. IBS1 includes the assumption that pore fluid pressures within the aquitards equilibrate instantaneously with changes in head in the adjacent aquifers. As such, IBS1 simulates the ultimate compaction that would occur in the aquitards for a given head decline in the aquifer. Where aquitard drainage is delayed because of the large thickness or small vertical hydraulic conductivity of individual aquitards, IBS1 overestimates aquifer system compaction during the time required for excess pore fluid pressures in the aquitards to equilibrate with the head decline in the aquifer. This difference between the compaction that has occurred at a given time and the compaction that would ultimately occur for a given sustained head decline defines the residual compaction, evidence for which was cited in the discussion of extensometer data. More comprehensive models currently under development for
Antelope Valley will account for delayed aquitard drainage and residual compaction in simulations of aquifer system compaction at the borehole extensometer site (M. Sneed, USGS, written communication, 1997) and regional land subsidence (S. Phillips, USGS, written communication, 1997). The modifications to the Durbin [1978] model required to simulate aquifer system compaction involve specification of additional parameters relating to the past stress history and the compressibility and thickness of the interbedded aquitards. To a first approximation, initial heads used in the simulation were equated to the previous maximum effective stresses (preconsolidation stresses) in model cells. Thus a head decline in a particular model cell would cause aquitards to compact. Initial heads were defined on the basis of groundwater levels measured annually in more than 100 wells as part of routine groundwater level monitoring in Antelope Valley (D. Leighton, USGS, written communication, 1997). Figure 8 shows the specified distributions of S9ke and S9kv
2580
GALLOWAY ET AL.: DETECTING AQUIFER SYSTEM COMPACTION
thickness of the aquitards. The distribution of the skeletal storages used in the model (Figure 8) is based on the assumption that the aggregate thickness of aquitards thins near the higher-energy depositional environments. In the model, permanent aquifer system compaction (Db*) and land subsidence result from a decline in aquifer hydraulic head (h) below the critical head that causes an increase in effective stress (se) to values greater than the maximum past stress: Db* 5 D s eS9kv/ r g 5 DhS9kv,
Plate 1. InSAR-detected (October 20, 1993, to December 22, 1995) land subsidence and historical (about 1930 –1992) land subsidence. The color cycle used to display the vertical displacement map was chosen to range the maximum detected subsidence. Beige-colored areas signify regions of decorrelation of the radar. Black-colored areas signify regions of smallmagnitude uplift. (equation (3)) for the aquitards in the principal and deep aquifer systems. Elastic and inelastic aquifer system skeletal storages were estimated on the basis of stress-strain analysis of aquifer system compaction and aquifer hydraulic head time series measured during 1990 –1996 at the extensometer south of Rogers Lake (Figure 7) (M. Sneed, USGS, written communication, 1997) and on the basis of results from simulations of the compaction history of other alluvial basins in California [Helm, 1978]. We simulated compressible aquitards in both the principal and deep aquifer systems, as well as the compression of the main confining unit. Compressible aquitards in both aquifer systems were assumed to be restricted to regions where lacustrine deposits have been mapped (Figure 3). For the principal aquifer system we assigned constant values of skeletal storage in model cells where compressible sediments were distributed. For the deep aquifer system we used a gradational distribution of skeletal storage, with higher values in the lowenergy depositional environments distal to the alluvial fans emanating from the San Gabriel Mountains and lower values nearer the range front. The compression of the confining unit was simulated indirectly by accounting for the thickness of the confining unit in the aggregate thicknesses of the compressible aquitards within the deep and principal aquifer systems. This simplification neglects the delayed drainage response of the thick, low permeability confining unit. The aquitard skeletal storage coefficients in the model combine information on the skeletal specific storages (compressibilities) and the aggregate
s e . s e(max).
(7)
Model simulations were constrained by available groundwater level, groundwater pumpage, and aquifer system compaction data. The most recent available comprehensive data on annual distribution and magnitude of groundwater pumpage in Antelope Valley [Templin et al., 1994] was applied for each year of the simulation period. Aquifer system parameters were adjusted from initial values to match measured head changes throughout the Lancaster groundwater subbasin and to match measured compaction south of Rogers Lake (Figure 8). In the simulation, as expected, compaction occurs in regions where compressible interbeds were specified and where specified pumpage stresses caused groundwater levels to fall below critical heads. The subsidence areas indicated by the 1993–1995 vertical displacement map are generally consistent with the 1993–1995 simulation (Plate 2). Residuals between InSAR-detected and simulated subsidence are fairly small in the areas of maximum subsidence near Lancaster and south of Rogers Lake (Plate 3). Two regions of large negative residuals are evident, one west of Rosamond Lake and another south of Lancaster. In these areas the model overestimates the amount of subsidence with respect to the interferogram. Declining groundwater levels in each of these regions, and the known presence of significant thicknesses of fine-grained sediments south of Lancaster between Palmdale and Lancaster, caused us to expect subsidence on the interferogram. Its absence may be related to larger-
Plate 2. Simulated and InSAR-detected land subsidence (October 20, 1993, to December 22, 1995).
GALLOWAY ET AL.: DETECTING AQUIFER SYSTEM COMPACTION
2581
Plate 3. Residuals between InSAR-detected land subsidence and simulated land subsidence.
than-expected preconsolidation stresses in this region, or the fine-grained aquitards may occur deeper in the aquifer system, relatively isolated and only slowly equilibrating to head decline occurring in shallower portions of the aquifer system. The vertical distribution of head decline in both the deep and principal aquifer systems is ill-defined. In the historically active subsidence region near the east central margin of the Antelope Valley (Plate 1), the simulation produced between 15 and 20 mm of subsidence, similar to that detected in the InSARderived vertical displacement map (Plate 2), but failed to accurately reproduce the areal distribution suggested by the displacement map. This localized subsidence is likely due to residual compaction, which was not simulated. The data from InSAR, combined with the more localized information from the extensometer and conventional surveying, suggest a need to incorporate this process in the simulation.
3.
Discussion
In assessing the applicability of InSAR to subsidence studies, it is useful to further review some of the fundamentals of aquifer mechanics and the traditional methods of collecting and analyzing data for compacting aquifer systems. 3.1.
Preconsolidation Stresses
An accurate initial estimate of preconsolidation stress (critical head) is one of the most important requirements for a successful simulation of the compaction of aquifer systems [Hanson, 1989; Hanson and Benedict, 1994]. In typical alluvial groundwater basins, the native preconsolidation stresses are generally somewhat larger than the predevelopment effective stresses, and land subsidence becomes obvious only after substantial drawdowns have initiated inelastic compaction. Holzer [1981] identified a variety of natural mechanisms that can cause such an overconsolidated condition in alluvial basins,
including removal of overburden by erosion, prehistoric groundwater level declines, desiccation, and diagenesis. Few investigations have examined the elastic responses of the aquifer system to changes in effective stress under natural conditions, before large-scale groundwater withdrawal has begun to cause irreversible subsidence. As a result, information on the critical aquifer hydraulic head, representing the native preconsolidation stress of the system, has been deduced from paired profiles of groundwater levels and land subsidence [Holzer, 1981; Anderson, 1988, 1989], as measured at wells and any nearby benchmarks (e.g., Figure 5) or inferred from simulation [Hanson et al., 1990; Hanson and Benedict, 1994]. Geodetic networks designed to monitor subsiding groundwater basins generally have minimal coverage in areas where historical subsidence has not been previously recognized; InSAR coverage will generally include such areas. In regions where there has been historical subsidence, InSAR may show where subsidence has been arrested, or in actively subsiding regions, InSAR may provide additional, more detailed information within the extent of previously measured networks. Where there is independent knowledge of the temporal variations in groundwater levels and the alluvial stratigraphy, in particular the distribution of fine-grained sediments, InSAR may help define the areal distribution and magnitude of the preconsolidation stresses. In areas where large groundwater level declines (stresses) in the known presence of compressible sediments are not causing significant land subsidence (e.g., the region between Palmdale and Lancaster in Antelope Valley), one might hypothesize overconsolidated conditions due to large native preconsolidation stresses. However, an alternate explanation for such behavior is hydraulic isolation between the compressible aquitards within the aquifer system and the pumpage causing large water level declines in the aquifers. That is, if most of the groundwater pumpage and head decline
2582
GALLOWAY ET AL.: DETECTING AQUIFER SYSTEM COMPACTION
occurs in the upper portion of the aquifer system and the aquitards occur in deeper portions, impedance of vertical groundwater flow between shallow and deep portions of the aquifer system may retard the equilibration of heads. In either event, the spatially detailed displacement maps possible with InSAR, in conjunction with other hydrogeologic data, may help define these regions. Such information could be useful in reconstructing the sedimentary and possibly the climatic history of a basin, and in constraining conceptual models of basin hydrogeology. 3.2.
Skeletal Compressibilities
The inelastic skeletal specific storage of aquitards (S9skv), in particular, is a critical parameter in quantitative analyses of compacting aquifer systems; its value may be several hundred times larger than the specific storage of aquifers (S s) [Ireland et al., 1984], which is the storage component usually invoked in standard groundwater flow equations. For typical aggregate thicknesses of interbedded aquifers and aquitards, the inelastic skeletal storativity of the aquitards (S9kv) is very large with respect to the storativity of the aquifers (S) and can be assumed to represent the inelastic storativity of the entire aquifer system. As a consequence of the extraordinarily high compressibility and confined aquifer conditions, the yield from inelastic storage (that is, “water of compaction” mined from compacting aquitards) typically constitutes 10 –30% of the groundwater pumped in compacting aquifer systems [Poland et al., 1975]. Riley [1969] showed how the time-varying stressstrain relation, measured in terms of drawdown and recovery in the aquifers and the vertical component of compression and expansion of the aquifer system, can provide estimates of the inelastic compressibility of the aquitards and the elastic compressibility of the aquifer system. Such time variation is often seasonal, and if the seasonal displacement is greater than 10 –20 mm and head change data are available for representative locations of interest, it should be possible to obtain enough information from InSAR data (e.g., from a 35-day orbital cycle of the current (phase A) ERS-2 mission) to approximate the areal pattern of the seasonal stress-strain relation for the aquifer system. This may not currently be possible in Antelope Valley, where seasonal compaction is generally less than about 10 mm and there is negligible expansion (Figure 7). In some formerly subsiding areas, such as the Santa Clara and San Joaquin valleys in California, importation of surface water has allowed aquifer heads to recover enough to maintain stresses at values consistently less than the anthropogenic preconsolidation stresses induced during the preceding period of groundwater mining. Nevertheless, extensometers in these areas reveal cycles of elastic compression and expansion in response to drawdown and recovery due to seasonal fluctuations in groundwater demand. Elastic seasonal deformation of about 80 mm has been observed [Riley, 1986]. Surface deformations of this amplitude are well within the resolution of InSAR, and preliminary analyses of interferograms of the Santa Clara Valley suggest that seasonal, recoverable subbasin-scale deformation of the order of 30 mm in range change is detectable (E. Fielding, JPL, written communication, 1997). We expect that InSAR could measure even smaller elevation changes due to drawdown and recovery around individual wells or well fields at seasonal or shorter timescales.
3.3.
Residual Compaction
Depending on the thickness and vertical hydraulic diffusivity of an aquitard, the equilibration of fluid pressure, and thus compaction, lags the head decline in adjacent aquifers. This concept is an essential element of the “aquitard drainage model” and describes the delay involved in draining aquitards when heads are lowered in adjacent aquifers, as well as the residual compaction which may continue long after aquifer heads are initially lowered. Drawing on time-consolidation theory from soil mechanics, Riley [1969] noted that a time constant t for compaction of a doubly draining aquitard following an instantaneous step load may be defined as
t 5 S9s~b9/ 2! 2/K9,
(8)
where b9 is the aquitard thickness, S9s is specific storage (S9skv if effective stresses are greater than maximum past effective stress), and K9 is vertical hydraulic conductivity. The time constant is the time required to attain about 93% of ultimate compaction following a step increase in applied load (a step decrease in head in the adjacent aquifers) and constitutes the product of the volume of water that must be expressed from the aquitard to achieve consolidation and the impedance to the flow of that water. For a doubly draining aquitard subject to these conditions, this time is also proportional to the square of the half thickness of the bed. Riley [1969] showed how an approximate time constant for compaction of the aquifer system as a whole can be derived from time series of aquifer head decline and aquifer-system compaction (e.g., Figure 7b). He combined this system time constant with inelastic storativity (derived from stress-strain analysis) and with the number and thicknesses of compacting aquitards to estimate an average value of K9 for the aquitards. Helm [1975, 1978] incorporated these concepts in a numerical aquitard drainage model that closely simulated compaction recorded at 15 extensometer-piezometer sites in the Santa Clara and San Joaquin Valleys. Extrapolating from Helm’s model-derived values of S9skv and K9, Ireland et al. [1984] estimated system time constants that ranged from 5 to 1350 years and averaged 159 years. Riley [1998] noted that in parts of the San Joaquin Valley, the large amounts of subsidence (approaching 9 m) observed by the late 1960s may have been only 50% or less of the amounts that would have ultimately occurred if aquifer drawdowns had been maintained at 1960s levels for another century or two. In areas where significant aquifer system compaction is occurring despite groundwater level increases and where other causes of land subsidence such as tectonic and/or oil and gas extractions can be ruled out, InSAR may provide some insight into the residual and/or ultimate compaction of aquifer systems. Where there is independent knowledge of the spatial and temporal variations in groundwater levels, the alluvial stratigraphy (in particular, the distribution of fine-grained sediments), and some estimate of the inelastic storativity of the aquifer system, InSAR-detected displacements may make it possible to compute spatially detailed estimates of average K9 and time constants for compacting aquitards. At the very least it should be possible to determine where residual compaction is occurring and possibly identify areas of unexpected compaction. This information could also be useful in reconstructing the sedimentary history of a basin, constraining conceptual models of basin hydrogeology, and constraining estimates of the volume of groundwater released from aquitard storage (an important element of groundwater management in subsiding
GALLOWAY ET AL.: DETECTING AQUIFER SYSTEM COMPACTION
2583
Table 1. Measurement of Land Subsidence Caused by Aquifer System Compaction
Method Borehole extensometry Leveling GPS InSAR
Component Displacement
Precision,* mm
vertical vertical horizontal vertical range
0.01–0.1 1–10 5 20 10
Sample Frequency,† day21
Sample Density,‡ survey21
continuous 1–10 10–30
1 10–100 10–100
..106
105–107
Survey Scale point line network map pixel
*Precision generally attainable under optimum conditions. †Number of measurements generally attainable in one day under optimum conditions at benchmarks and reference marks within the scale of the survey. ‡Number of measurements generally attainable under optimum conditions to define the distribution and magnitude of land subsidence at the scale of the survey.
basins). In basins with a history of significant sediment loading and erosion that results in a highly variable preconsolidation stress distribution, information on residual compaction could be used to constrain distributions of preconsolidation stress used in simulations. 3.4.
Monitoring
InSAR requires geodetic control to relate indicated changes to stable datum; presently, this is best accomplished using GPS and leveling surveys, tied to extensometer sites where possible. Coincident ground control can also constrain sources of error in the radar interferometric technique. At the basin scale, the change detection precision generally attainable by InSAR under optimum conditions (10 mm) is comparable to conventional leveling (1–10 mm) and GPS surveys (5–20 mm) (Table 1). The InSAR-detected range changes represent differencing of spatially averaged estimates over the area of a pixel or pixels, whereas measurements derived from conventional surveys result from differencing point measurements. However, given the sparseness of surveyed measurements generally attainable at the basin scale, neither of these conventional methods can realistically compete with the high spatial detail possible with InSAR at this scale. On the other hand, InSAR cannot supplant borehole extensometry for precise (0.01– 0.1 mm) and continuous measurements of aquifer system compaction at a single location. Precise, continuous measurements of compaction, easily attainable with extensometers, are very useful for developing detailed stress-strain relations when paired with coincident aquifer hydraulic head measurements from nearby piezometers. The resulting site-specific stress-strain relations can be used to compute compressibilities for the elastic and inelastic range of most aquifer systems [Riley, 1969]. Elastic and inelastic compressibilities have been estimated from extensometer data in a wide variety of geologic environments [e.g., Ireland et al., 1984; Epstein, 1987; Hanson, 1989; Heywood, 1998] where the applicability of InSAR could also be tested. Clearly, InSAR may provide a reconnaissance tool for basins where installations of geodetic networks and extensometer sites are planned. In areas where radar coherency can be achieved for periods of months to years, InSAR permits reconnaissance and monitoring of land subsidence at an unprecedented spatial detail and at costs competitive with conventional surveys. Where large-scale, high-density change detection is required, InSAR could yield a considerable cost advantage over conventional surveys. In basins prone to aquifer system compaction, the high spatial detail of InSAR dis-
placement maps may illustrate crustal deformations related to the great lateral variability and heterogeneity of alluvial deposits, the uncertain location and nature of groundwater flow boundaries, and the clustered distribution and localized effects of aquifer system stress (pumping wells). Many of these features of aquifer systems, all of which affect compaction, are often poorly defined in the sparsely measured, spatially averaged displacement surfaces computed from conventional surveys. We anticipate that InSAR reconnaissance will be useful to optimize the design of ground control networks and to guide the collection of hydrogeologic data for subsidence investigations, especially in arid regions where nonagricultural land uses predominate. In combination with other hydrogeologic information, including the timing and distribution of changes in aquifer system hydraulic head, InSAR may help define the distributed stress-strain behavior of the system. Such data are critical for managing subsidence and previously could be obtained only through sparsely distributed, paired observations at infrequently surveyed benchmarks and wells, through borehole extensometer installations, and through simulations [Hanson and Benedict, 1994; Hanson, 1996]. At present the usefulness of InSAR is somewhat limited by the newness of SAR technology. Satellite SAR data are available only for about 1992 to present, although there is extensive global coverage. The 35-day orbital cycle of the current ERS-2 mission would permit nearly monthly repeat-pass interferograms, but the amount of land surface elevation change accrued during 35 days may not be large enough to register a useable signal-tonoise ratio at that sample frequency. Monthly changes would be within the expected noise of the InSAR-detected land subsidence in Antelope Valley. However, where subsidence rates approach 0.3 m yr21, as occurred in parts of the San Joaquin Valley, California, during 1950 –1970 [Poland et al., 1975], it may be possible to detect displacements on monthly or bimonthly interferograms. For Antelope Valley, where current subsidence rates are generally less than 20 mm yr21, biannual, annual, or possibly semiannual (seasonal) sampling frequencies, depending on areas of interest within the valley, would seem reasonable given the current technology. Continued availability of satellite platforms is of some concern with respect to long-term monitoring. The ERS-1 and JERS-1 (Japanese Earth Resources Satellite) satellites are operating beyond their expected lifetimes, and the ERS-2 satellite is near the end of its expected lifetime. It is unclear whether the next generation of spaceborne synthetic aperture radar platforms
2584
GALLOWAY ET AL.: DETECTING AQUIFER SYSTEM COMPACTION
will be generally suitable for repeat-pass interferometry at timescales of interest for monitoring aquifer system compaction. InSAR, like conventional ground-surveying methods, measures only the surface displacement that results from the volumetric deformation of the aquifer system. The role of horizontal strain in the deformation of aquifer systems has been explored theoretically [Helm, 1994; Hsieh and Cooley, 1995] and practically [Holzer, 1977, 1984; Carpenter, 1993] to predict and monitor earth fissure development. While it may not be possible to adequately resolve horizontal components of surface displacement with the currently available satellite SAR data, it may be possible to locate areas susceptible to earth fissures by identifying regions where localized differential land subsidence may contribute to large tensional stresses. When used in conjunction with coincident measurements of groundwater levels and other geologic information regarding faults, bedrock topography and the distribution of fine-grained (more compressible) sediments, spatially detailed InSAR maps may highlight new relations between land surface displacements and the controlling hydrogeologic features. InSAR may also provide some information into the time-varying nature of aquifer system compaction on a regional scale. Where seasonal interferograms are possible, spatial relations between regions undergoing elastic and inelastic compression may be inferred. Where coherence permits interferograms spanning years, monitoring may reveal regions where sustained residual compaction is occurring. The population of Antelope Valley is projected to grow from 260,400 in 1990 to 690,000 by the year 2010 [California Department of Finance, 1992]. Meanwhile, total water demands are expected to triple by the year 2010 because of continued urban development (L. M. Takaichi, Kennedy-Jenks Inc., unpublished report for the Antelope Valley Water Group, 1995), placing more reliance on local groundwater resources and exacerbating problems of groundwater depletion and land subsidence [Galloway et al., 1998]. The evolution of land and water use in many areas of the arid western United States is similar to that experienced in Antelope Valley: initial development of groundwater for agricultural use, followed by urbanization and importation of surface water which in many cases will not completely suffice to meet water use demands. The future of groundwater use is linked to continuing or renewed compaction of the aquifer system and land subsidence. The InSAR method may provide a relatively inexpensive and comprehensive way to monitor this process in developing groundwater basins with favorable radiometric conditions. Rigorous “ground truth” is required to identify error sources and constrain temporal decorrelation in order to advance InSAR in this application. Acknowledgments. We gratefully acknowledge Francis S. Riley who provided valuable input through discussions and thoughtful review of many aspects of this manuscript, especially the principles, measurement, and interpretation of aquifer system compaction. Randall T. Hanson’s careful and insightful review improved many of the hydrogeologic, land subsidence, and related simulation aspects of this paper, and Stuart A. Rojstaczer’s early comments compelled us to sharpen its focus and direction. John R. Styles provided constructive and helpful geotechnical comment. Dominique Derauw contributed many useful suggestions regarding the application of InSAR.
References Anderson, S. R., Potential for aquifer compaction, land subsidence, and earth fissures in Tucson Basin, Pima County, Arizona, U.S. Geol. Surv. Hydrol. Invest. Atlas, HA-713, 3 sheets, 1988.
Anderson, S. R., Potential for aquifer compaction, land subsidence, and earth fissures in Avra Valley, Pima and Pinal Counties, Arizona, U.S. Geol. Surv. Hydrol. Invest. Atlas, HA-718, 3 sheets, 1989. Blodgett, J. C., and J. S. Williams, Land subsidence and problems affecting land use at Edwards Air Force Base and vicinity, California, 1990, U.S. Geol. Surv. Water Resour. Invest. Rep., 92-4035, 25 pp., 1992. California Department of Finance, California annual population and housing data April 1, 1980, to April, 1990, for cities, counties and the state, Rep. E-8090, pp. 59 – 88, Sacramento, 1992. Carpenter, M. C., Earth-fissure movement associated with fluctuations in ground-water levels near the Picacho Mountains, south-central Arizona, 1980 – 84, U.S. Geol. Surv. Prof. Pap., 497-H, 49 pp., 1993. Durbin, T. J., Calibration of a mathematical model of the Antelope Valley groundwater basin, California, U.S. Geol. Surv. Water Supply Pap., 2046, 51 pp., 1978. Epstein, V. J., Hydrologic and geologic factors affecting land subsidence near Eloy, Arizona, U.S. Geol. Surv. Water Resour. Invest. Rep., 87-4143, 28 pp., 1987. European Space Agency, ERS-1 system, 87 pp., Eur. Space Res. and Technol. Cent., Noordwijk, Netherlands, 1992. Freeman, L. F., Time-series ground-water-level and aquifer-system compaction data, Edwards Air Force Base, Antelope Valley, California, January 1991 through September 1993, U.S. Geol. Surv. Open File Rep., 96-86, 32 pp., 1996. Fujiwara, S., P. A. Rosen, M. Tobita, and M. Murakami, Crustal deformation measurements using repeat-pass JERS 1 synthetic aperture radar interferometry near the Izu Peninsula, Japan, J. Geophys. Res., 103(B2), 2411–2426, 1998. Gabriel, A. K., R. M. Goldstein, and H. A. Zebker, Mapping small elevation changes over large areas: Differential radar interferometry, J. Geophys. Res., 94(B7), 9183–9191, 1989. Galloway, D. L., S. P. Phillips, and M. E. Ikehara, Land subsidence and its relation to past and future water supplies in Antelope Valley, California, in Current Research and Case Studies of Land Subsidence: Proceedings of the Dr. Joseph F. Poland Symposium on Land Subsidence, edited by J. Borchers, pp. 529 –539, Assoc. Eng. Geol. Spec. Publ. 8, Star, Belmont, Calif., 1998. Goldstein, R., Atmospheric limitations to repeat-track radar interferometry, Geophys. Res. Lett., 22(18), 2517–2520, 1995. Goldstein, R. M., Englehardt, B. Kamb, and R. M. Frolich, Satellite radar interferometry for monitoring ice sheet motion: Application to an Antarctic ice stream, Science, 262, 1525–1530, 1993. Green, J. H., Compaction of the aquifer system and land subsidence in the Santa Clara Valley, California, U.S. Geol. Surv. Water Supply Pap., 1779-T, 11 pp., 1964. Hanson, R. T., Aquifer-system compaction, Tucson Basin and Avra Valley, Arizona, U.S. Geol. Surv. Open File Rep., 88-4172, 69 pp., 1989. Hanson, R. T., Postaudit of head and transmissivity estimates and ground-water flow models of Avra Valley, Arizona, U.S. Geol. Surv. Water Resour. Invest. Rep., 96-4045, 84 pp., 1996. Hanson, R. T., and J. F. Benedict, Simulation of ground-water flow and potential land subsidence, upper Santa Cruz Basin, Arizona, U.S. Geol. Surv. Water Resour. Invest. Rep., 93-4196, 47 pp., 1994. Hanson, R. T., S. R. Anderson, and D. R. Pool, Simulation of groundwater flow and potential land subsidence, Avra Valley, Arizona, U.S. Geol. Surv. Water Resour. Invest. Rep., 90-4178, 41 pp., 1990. Helm, D. C., One-dimensional simulation of aquifer system compaction near Pixley, California, 1, Constant parameters, Water Resour. Res., 11, 465– 478, 1975. Helm, D. C., Field verification of a one-dimensional mathematical model for transient compaction and expansion of a confined aquifer system, in Verification of Mathematical and Physical Models in Hydraulic Engineering, Proceedings 26th Hydraulic Division Specialty Conference, pp. 189 –196, Am. Soc. of Civ. Eng., New York, 1978. Helm, D. C., Horizontal aquifer movement in a Theis-Thiem confined system, Water Resour. Res., 30(4), 953–964, 1994. Heywood, C. E., Piezometric-extensometric estimations of specific storage in the Albuquerque basin, New Mexico, in Current Research and Case Studies of Land Subsidence: Proceedings of the Dr. Joseph F. Poland Symposium, edited by J. Borchers, pp. 435– 440, Assoc. of Eng. Geol. Spec. Publ. 8, Star, Belmont, Calif., 1998. Holzer, T. L., Ground failure in area of subsidence due to groundwater decline in the United States, in Proceedings, International Land Subsidence Symposium, 2nd, IAHS Publ., 212, 423– 433, 1977.
GALLOWAY ET AL.: DETECTING AQUIFER SYSTEM COMPACTION Holzer, T. L., Preconsolidation stress of aquifer systems in areas of induced land subsidence, Water Resour. Res., 17(3), 693–704, 1981. Holzer, T. L., Ground failure induced by ground-water withdrawal from unconsolidated sediment, Rev. Eng. Geol., 6, 67–105, 1984. Hsieh, P. A., and R. L. Cooley, Comment on “Horizontal aquifer movement in a Theis-Theim confined system” by Donald C. Helm, Water Resour. Res., 31(12), 3107–3111, 1995. Ikehara, M. E., and S. P. Phillips, Determination of land subsidence related to ground-water level declines using global positioning system and levelling surveys in Antelope Valley, Los Angeles and Kern Counties, California 1992, U.S. Geol. Surv. Water Res. Invest. Rep., 94-4184, 101 pp., 1994. Ireland, R. L., J. F. Poland, and F. S. Riley, Land subsidence in the San Joaquin Valley, California, as of 1980, U.S. Geol. Surv. Prof. Pap., 437-I, 93 pp., 1984. Leake, S. A., Interbed storage changes and compaction in models of ground-water flow, Water Resour. Res., 26, 1939 –1950, 1990. Leake, S. A., and D. E. Prudic, Documentation of a computer program to simulate aquifer-system compaction using the modular finitedifference ground-water flow model, Techniques of Water-Resources Investigations of the United States Geological Survey, book 6, chap. A2, 68 pp., U.S. Geol. Surv., Reston, Va., 1991. Londquist, C. J., D. L. Rewis, D. L. Galloway, and W. F. McCaffrey, Hydrogeology and land subsidence, Edwards Air Force Base, Antelope Valley, California, January 1989 –December 1991, U.S. Geol. Surv. Water Res. Invest. Rep., 93-4114, 74 pp., 1993. McDonald, M. G., and A. W. Harbaugh, A modular three-dimensional finite-difference groundwater flow model, Techniques of WaterResources Investigations of the United States Geological Survey, book 6, chap. A1, 586 pp., U.S. Geol. Surv., Reston, Va., 1988. Massonnet, D., and T. Rabaute, Radar interferometry: Limits and potential, Trans. Geoscience and Remote Sensing, 31(2), 455– 464, 1993. Massonnet, D., M. Rossi, C. Carmona, F. Adragna, G. Peltzer, K. Feigl, and T. Rabaute, The displacement field of the Landers earthquake mapped by radar interferometry, Nature, 364, 138 –142, 1993. Massonnet, D., P. Briole, and A. Arnaud, Deflation of Mount Etna monitored by spaceborne radar interferometry, Nature, 375, 567– 570, 1995. Massonnet, D., T. Holzer, and H. Vadon, Land subsidence caused by the East Mesa geothermal field, California, observed using SAR interferometry, Geophys. Res. Lett., 24(8), 901–904, 1997. Miller, R. E., Compaction of an aquifer system computed from consolidation tests and decline in artesian head, in Short Papers in the Geologic and Hydrologic Sciences, U.S. Geol. Surv. Prof. Pap., 424-B, B54 –B58, 1961. National Research Council, Mitigating Losses From Land Subsidence in the United States, 58 pp., Natl. Acad. Press, Washington, D. C., 1991. Peltzer, G., and P. Rosen, Surface displacement of the 17 May 1993 Eureka Valley, California, earthquake observed by SAR interferometry, Science, 268, 1333–1336, 1995. Peltzer, G., P. Rosen, F. Rogez, and K. Hudnut, Postseismic rebound in fault step-overs caused by pore fluid flow, Science, 273, 1202–1204, 1996. Poland, J. F., Land subsidence in the San Joaquin Valley and its effect on estimates of groundwater resources, Int. Assoc. Sci. Hydrol. Publ., 52, 324 –335, 1960. Poland, J. F., and J. H. Green, Subsidence in the Santa Clara Valley, California—A progress report, U.S. Geol. Surv. Water Supply Pap., 1619-C, 16 pp., 1962. Poland, J. F., and R. L. Ireland, Land subsidence in the Santa Clara Valley, California, as of 1982, U.S. Geol. Surv. Prof. Pap., 497-F, 61 pp., 1988. Poland, J. F., B. E. Lofgren, R. L. Ireland, and R. G. Pugh, Land
2585
subsidence in the San Joaquin Valley, California, as of 1972, U.S. Geol. Surv. Prof. Pap., 437-H, 77 pp., 1975. Rantz, S. E., Mean annual precipitation in the California region, U.S. Geol. Surv. Open File Rep., 2 sheets, scale 1;1,000,000, 1969. Riley, F. S., Analysis of borehole extensometer data from central California, in Land Subsidence, vol. 2, edited by L. K. Tison, Int. Assoc. Sci. Hydrol., Publ. 89, 423– 431, 1969. Riley, F. S., Developments in borehole extensometry, in Land Subsidence, edited by A. I. Johnson, L. Carborgnin, and L. Ubertini, IAHS Publ., 151, 169 –186, 1986. Riley, F. S., Mechanics of aquifer systems—The scientific legacy of Joseph F. Poland, in Current Research and Case Studies of Land Subsidence: Proceedings of the Dr. Joseph F. Poland Symposium on Land Subsidence, edited by J. Borchers, pp. 13–27, Assoc. of Eng. Geol. Spec. Publ. 8, Star, Belmont, Calif., 1998. Rosen, P. A., S. Hensley, H. A. Zebker, F. H. Webb, and E. Fielding, Surface deformation and coherence measurements of Kilauea volcano, Hawaii, from SIR-C radar interferometry, J. Geophys. Res., 101(E10), 23,109 –23,125, 1996. Snyder, J. H., Ground Water in California—The Experience of Antelope Valley, Berkeley, California, Giannini Found. Ground-Water Stud. 2, 171 pp., Div. of Agric. Sci., Univ. of Calif., Berkeley, 1955. Templin, W. E., S. P. Phillips, D. E. Cherry, M. L. DeBortoli, T. C. Haltom, C. A. Mrozek, and K. R. McPherson, Land use and water use in the Antelope Valley, California, U.S. Geol. Surv. Water Resour. Invest. Rep., 94-4208, 97 pp., 1994. Terzaghi, K., Principles of soil mechanics, IV, Settlement and consolidation of clay, Eng. News Rec., 95(3), 874 – 878, 1925. Terzaghi, K., Theoretical Soil Mechanics, 510 pp., John Wiley, New York, 1943. Thayer, W. N., Geologic features of Antelope Valley, California, report, 20 pp., Los Angeles County Flood Control District, Los Angeles, Calif., 1946. Thompson, D. G., The Mohave Desert region, California: A geographic, geologic, and hydrologic reconnaissance, U.S. Geol. Surv. Water Supply Pap., 578, 759 pp., 1929. Tolman, C. F., and J. F. Poland, Ground-water, salt-water infiltration, and ground-surface recession in Santa Clara Valley, Santa Clara County, California, Eos Trans. AGU Transactions, 21(1), 23–24, 1940. Vadon, H., and F. Sigmundsson, 1992–1995 crustal deformation at Mid-Atlantic ridge, SW Iceland, mapped by radar interferometry, Science, 275, 193–197, 1997. Zebker, H. A., P. A. Rosen, R. M. Goldstein, A. Gabriel, and C. L. Werner, On the derivation of coseismic displacement fields using differential radar interferometry: The Landers earthquake, J. Geophys. Res., 99(B10), 19,617–19,634, 1994. Zebker, H. A., P. A. Rosen, and S. Hensley, Atmospheric effects in interferometric synthetic aperture radar surface deformation and topographic maps, J. Geophys. Res., 102(B4), 7547–7563, 1997. D. L. Galloway and S. P. Phillips, U.S. Geological Survey, Placer Hall, California State University, 6000 J Street, Sacramento, CA 95819. (e-mail:
[email protected]) K. W. Hudnut, U.S. Geological Survey, 525 South Wilson Avenue, Pasadena, CA 91106. S. E. Ingebritsen, U.S. Geological Survey, Mail Stop 439, 345 Middlefield Road, Menlo Park, CA 94025. G. Peltzer, F. Rogez, and P. A. Rosen, Jet Propulsion Laboratory, California Institute of Technology, Mail Stop 300-325, 4800 Oak Grove Drive, Pasadena, CA 91109. (Received September 17, 1997; revised April 10, 1998; accepted April 15, 1998.)
2586