Developmental Biology 302 (2007) 617 – 626 www.elsevier.com/locate/ydbio
Genomes & Developmental Control
Detection of broadly expressed neuronal genes in C. elegans Ilya Ruvinsky a,1 , Uwe Ohler b,2 , Christopher B. Burge b , Gary Ruvkun a,⁎ a
Department of Molecular Biology, Massachusetts General Hospital and Department of Genetics, Harvard Medical School, 185 Cambridge Street, Simches 7, Boston, MA 02114, USA b Department of Biology, Massachusetts Institute of Technology, Cambridge, MA 02139, USA Received for publication 14 July 2006; revised 1 September 2006; accepted 7 September 2006 Available online 15 September 2006
Abstract The genes that are expressed in most or all types of neurons define generic neuronal features and provide a window into the developmental origin and function of the nervous system. Few such genes (sometimes referred to as pan-neuronal or broadly expressed neuronal genes) have been defined to date and the mechanisms controlling their regulation are not well understood. As a first step in investigating their regulation, we used a computational approach to detect sequences overrepresented in their promoter elements. We identified a ten-nucleotide cis-regulatory motif shared by many broadly expressed neuronal genes and demonstrated that it is involved in control of neuronal expression. Our results further suggest that global and cell-type-specific controls likely act in concert to establish pan-neuronal gene expression. Using the newly discovered motif and genome-level gene expression data, we identified a set of 234 candidate broadly expressed genes. The known involvement of many of these genes in neurogenesis and physiology of the nervous system supports the utility of this set for future targeted analyses. © 2006 Elsevier Inc. All rights reserved. Keywords: C. elegans; Gene expression; Pan-neuronal genes; cis-regulatory motifs
Introduction Despite remarkable variation in morphology and function, all neurons possess a set of attributes that allow their assignment to this cell type (Kandel et al., 2000). These features are likely determined by genes, called pan-neuronal genes, uniquely expressed in all (or nearly all) neurons, but not in other cell types. However, in many instances broadly expressed neuronal genes are also expressed in other cell types (Iwasaki et al., 1997; Nonet et al., 1999; Rajaram et al., 1999; Sieburth et al., 2005). Characterization of such broadly expressed neuronal genes (a term we will use interchangeably with pan-neuronal) has a potential to uncover the genetic modules that give neurons their distinctive features. Identifica-
⁎ Corresponding author. E-mail address:
[email protected] (G. Ruvkun). 1 Present address: Department of Ecology and Evolution, The University of Chicago, USA. 2 Present address: Institute for Genome Sciences and Policy, Duke University, USA. 0012-1606/$ - see front matter © 2006 Elsevier Inc. All rights reserved. doi:10.1016/j.ydbio.2006.09.014
tion of these genes has lagged behind the progress made toward understanding the mechanisms of neuronal subtype specification (Melkman and Sengupta, 2004; Shirasaki and Pfaff, 2002; Thor and Thomas, 2002). The identification of these genes may also provide clues to the molecular mechanisms that regulate their expression. If subsets of pan-neuronal genes are controlled by a common set of transcription factors, they are likely to share transcription factor binding sites in their cis-regulatory regions (Zhang, 1999). We investigated this possibility by searching for sequence motifs overrepresented in the promoters of known pan-neuronal genes. Materials and methods Computational discovery of motifs overrepresented in pan-neuronal promoters From a manually curated set of 17 experimentally verified pan-neuronal genes (Tables 1 and S1), we extracted the regions upstream of the annotated translation start sites as given by WormBase, release 102 (http://www. wormbase.org). We also extracted the sequences upstream of the annotated start codons of C. briggsae orthologs. We next aligned these sequences using dynamic block aligner—DBA (Jareborg et al., 1999), which relies on a pair hidden Markov model to identify short, highly conserved blocks
618
I. Ruvinsky et al. / Developmental Biology 302 (2007) 617–626
Table 1 Identity and functional annotations of genes that comprised training and test sets (see Tables S1 and S2 for details) Gene Training set aex-3 ehs-1 F25B3.3 jkk-1 rab-3 ric-19 rpm-1 snb-1 sng-1 unc-10 unc-11 unc-14 unc-33 unc-51 unc-64 unc-76 unc-119 Test set acy-1 dgk-1 eat-16 egl-8 gpb-2 gpc-2 jnk-1 ldb-1 rbf-1 ric-3 ric-4 snt-1 unc-1 unc-13 unc-18 unc-26 unc-57 unc-75 unc-104 unc-115 zag-1
Functional annotation Guanine nucleotide exchange factor Ortholog of mammalian EPS15 Guanine nucleotide exchange factor MAP kinase kinase Ras GTPase superfamily Cytosolic protein involved in secretion Neuronal presynaptic protein (ortholog of highwire) Synaptobrevin Synaptogyrin Presynaptic protein that effects the activity of rab-3 Clathrin-adaptor protein AP180 Required for axonogenesis Essential for axon guidance and axonogenesis Required for axonogenesis Syntaxin Required for axonal outgrowth and fasciculation Required for axonal branching and fasciculation Adenylyl cyclase Diacylglycerol kinase Regulator of G-protein signalling Phospholipase C beta G-protein beta G-protein gamma c-Jun N-terminal kinase (MAP kinase) Nuclear LIM binding protein family Synaptic vesicle protein rabphilin Required for function of nicotinic acetylcholine receptors Ortholog of vertebrate SNAP-25 Synaptotagmin Homolog of human stomatin Neurotransmitter release regulator Vesicle trafficking protein Sec1 Synaptojanin (inositol-1,4,5-triphosphate 5-phosphatase) Endophilin (lysophosphatidic acid acyltransferase) RNA-binding protein required for neurotransmission Kinesin-like protein Limatin (LIM Zn-finger protein involved in axon guidance) Homeobox transcription factor
between two sequences, a pattern that can be expected in promoters where transcription factor binding sites are surrounded by stretches of nonconserved sequence (Wray et al., 2003). The DBA computes the optimal alignment under a model of several match states corresponding to four levels of conservation (with average identities of 65%, 75%, 85% and 95%). While aligning orthologous non-coding C. elegans/C. briggsae sequence pairs, we noticed that in five cases the upstream regions contained few conserved regions. These pairs had less than 10% of sequence with identity of 80% or higher, whereas the remaining 12 pairs on average contained 27% of sequences conserved above 80%. Possible causes of such low conservation include divergence of control regions, erroneous ortholog assignment, mis-annotation of a start codon, etc. Another open issue in the study of regulatory sequences is that common alignment programs like DBA do not account for rearrangements caused by birth and death of binding sites (Wray et al., 2003). We therefore decided on the following strategy: to find motifs in both species separately, keeping only those present in both species (also see below). We applied the probabilistic motif discovery program MEME, ver. 3 (Bailey and Elkan, 1994), to the sequence set containing 1 kb from each of the 12 C. elegans genes with conserved promoter elements, searching for zero or one occurrence per sequence. A tri-nucleotide background model was estimated based on the
complete 1.5-kb sequences upstream of conserved C. elegans/C. briggsae orthologous genes obtained from Ensembl, ver.16, August 2003 (http://www. ensembl.org), to adjust the significance of common low complexity di- and tri-nucleotide repeats.
Genome-wide detection of N1-box motifs We assembled a set containing the sequences 1 kb upstream of translation initiation sites for all C. elegans/C. briggsae orthologous gene pairs annotated to have conserved upstream regions (http://www.ensembl.org). We removed from this set all genes located within less than 150 bp from an upstream gene to exclude the intercistronic sequences separating downstream genes in operons (Blumenthal et al., 2002). We used Patser, ver.1.3d (Hertz and Stormo, 1999), to scan all remaining 9183 pairs of upstream regions and recorded a separate loglikelihood score for motif presence in C. elegans and C. briggsae, using the organism-specific positional weight matrices generated by MEME. We searched both strands and retained the top score regardless of its orientation. According to a single nucleotide frequency background model implemented in Patser, the lowest scoring sequence from C. elegans training set corresponded to an expected frequency of 1 site per 100,000 nucleotides (log odds score 1,411) and 5 sites per 100,000 nucleotides from C. briggsae orthologs of the training set (log odds score 1084). Because both strands of 1 kb upstream sequence was examined for each gene in each species, the fraction of promoters containing a high-scoring N1-box by chance alone is about 2% in C. elegans and 10% in C. briggsae. Under ideal circumstances, we would be able to use a joint weight matrix model to score orthologous promoters simultaneously, or at least the presence of a binding site in C. briggsae conditional on its score in C. elegans. However, the growth in the number of parameters in such models prohibits their application in our case, due to the small size of our training set. We therefore computed a sum of C. elegans and C. briggsae scores for every orthologous gene pair; the lowest score in the training set was 2529. This effectively assumes independence of the C. elegans and C. briggsae sequences which is certainly not the case (they are descendent from a common ancestor). However, given the overall relatively low amount of conservation, this is a crude yet not unreasonable approximation. When we applied Patser to the entire collection of 9183 promoter pairs, we noticed that the lowest score was 2335 due to a difference in the location of the 5′ start site of one gene in the Ensembl database compared to the manually curated version of the same sequence. We therefore designated as “high” those scores that were greater than 2335. In all subsequent tests, we found no qualitative differences between the genes that scored higher than 2529 and those with scores between 2529 and 2335. In addition to low overall conservation, the five sequences excluded from the initial motif searches also had lower N1-box scores. Finally, we found that N1-boxes were enriched within 1 kb (∼ 1.5-fold) and 0.5 kb (∼ 2-fold) of translation start sites, compared to sequences elsewhere in the genome.
Strains and constructs We used standard methods to generate constructs and transgenic animals; these were described in detail before (Ruvinsky and Ruvkun, 2003). To generate deletion series of cis-elements, we cloned fragments of relevant promoters into pPD95.75 (gift of A. Fire). To replace the N1-boxes in promoters of ric-19 (Pilon et al., 2000) and unc-1 (Rajaram et al., 1999), with an unrelated sequence of equal length, bacterial lexA binding site— TACTGTATAT (Robison et al., 1998), we used QuickChange site-directed mutagenesis kit (Stratagene). To test whether sequences of the N1-box are sufficient to direct broad neuronal expression, we cloned promoter fragments of rpm-1, jkk-1 and sng-1, each of which contains four high-scoring N1-boxes (fragment sizes of 118 bp, 175 bp and 274 bp, respectively), into pPD122.53 from which the nuclear localization signal was previously removed. Sequences of all constructs were verified by restriction digestion and sequencing. All constructs were injected (at 50 ng/μl) into pha-1 (e2123) worms, together with a pha-1 rescuing construct (Granato et al., 1994) at 2 ng/μl. Multiple independent lines were examined for each construct. Some strains were obtained from Genome British Columbia C. elegans Gene Expression Consortium (McKay et al., 2003). Images were captured on Leica DMR microscope and processed with Adobe Photoshop.
I. Ruvinsky et al. / Developmental Biology 302 (2007) 617–626
Results Identification of a conserved sequence element overrepresented in pan-neuronal promoter elements One mechanism controlling pan-neuronal genes could be a class of transcription factors that coordinately regulate expression of some or all pan-neuronal genes. If that were the case, we would expect to detect sequence motifs shared by promoters of many broadly expressed (pan-neuronal) genes. A flow-chart illustrating our approach is shown in Fig. 1. First, we assembled a training set of promoters of 17 genes, which previously have been experimentally shown to be expressed in all or nearly all neurons in C. elegans (Tables 1 and S1). These genes comprise roughly one half of all known broadly expressed genes in the nematode. Known pan-neuronal genes that were not used in this training set were used as a test set to validate motif discovery (see below). Even though some pan-neuronal genes are expressed in cell types other than neurons, for this initial analysis we grouped all of them together because excluding certain genes a priori would have further reduced an already relatively small training set. As we were seeking to uncover
619
sequence motifs mediating broad neuronal expression rather than co-regulation of small, functionally related groups of genes, the training set consisted of genes encoding components of vesicular machinery (snb-1, sng-1), regulators of exocytosis (aex-3, rab-3, unc-10) and endocytosis (ehs-1), and proteins required for axonal outgrowth (unc-14, unc-51, unc-119). Likewise, the test set included genes involved in a variety of different functions. We are not aware of any systematic compositional differences between the two sets. Because C. elegans and another nematode C. briggsae are relatively divergent (Kiontke et al., 2004), only functionally important sites within homologous promoter elements are expected to be conserved between these two species (Boffelli et al., 2003; Maduro and Pilgrim, 1996). In some instances, however, even if individual motifs are conserved between two species, they may not reside in regions of extended sequence similarity. This is due to relatively rapid sequence turnover in cis-regulatory DNA, particularly across larger phylogenetic distances (Emberly et al., 2003; Smith et al., 2004; Stone and Wray, 2001). Consequently, an expectation that all cisregulatory motifs (shared by orthologous genes between two species) should reside in larger conserved blocks may be too
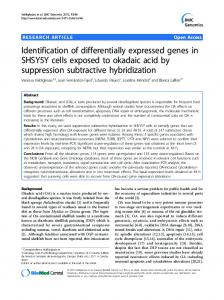
Fig. 1. A flow-chart scheme illustrating the computational approach to (A) identify the N1-box, (B) to conduct a genome-wide screen for conserved N1-boxes in promoters of C. elegans/C. briggsae gene pairs and (C) to identify candidate pan-neuronal genes.
620
I. Ruvinsky et al. / Developmental Biology 302 (2007) 617–626
stringent. The overall conservation of the upstream non-coding sequences of the 17 orthologous C. elegans/C. briggsae gene pairs in the training set was quite low. We eliminated five pairs because they contained little detectable conservation (Table S1), even though their respective proteins were highly conserved, and searched for enriched sequence motifs in the remaining 12 sequences. A search of the C. elegans sequence set using the MEME motif search and discovery algorithm (Bailey and Elkan, 1994) produced a single significant ten-nucleotide sequence with the E-value of 4.9 × 10− 3, which we dubbed the “N1-box” (for neuronal 1). The E-values generated by MEME refer to the expected number of motifs of the same length which are found with equal or higher likelihood in the same number of random sequences with the same nucleotide composition as the considered set of sequences. All twelve alignable promoters from the training set contained at least one N1-box within 1 kb upstream of the translation initiation site; thus, for reasons of efficiency we restricted all future searches to 1 kb of the proximal promoter regions. We found a similar motif in the orthologous C. briggsae sequence set (Fig. S1), suggesting that this site is constrained in evolution and thus likely to be functionally important (Fig. 1A). The N1-box was also the only significant motif discovered by PhyloGibbs (Siddharthan et al., 2005), an algorithm that explicitly considers the phylogenetic relationship between the two nematode species (data not shown). The N1-box is preferentially present in promoters of pan-neuronal genes To take advantage of the conserved nature of the N1-box, we conducted a search for this motif in a data set containing promoter elements of all annotated orthologous C. elegans/ C. briggsae gene pairs, 9183 in total (Stein et al., 2003). Although this represents only about one half of the genes in the C. elegans genome (C. elegans Sequencing Consortium, 1998), most genes involved in basic neuronal functions are conserved (Bargmann, 1998) and thus represented among orthologous gene pairs. Because in some instances sequence motifs shared by two species may not reside in blocks of extended conservation (see above), we separately recorded the highest scoring match to the N1-box for every C. elegans and C. briggsae gene and then combined the scores for each pair of orthologs. We defined “high-scoring” gene pairs as those which had a combined C. elegans/C. briggsae score as high or higher than the lowest score (unc-14, 2335; Table S1) in the training set (Fig. 1B). The search of 9183 C. elegans/ C. briggsae promoter pairs identified 1136 high-scoring genes (12%). As is generally the case with computational predictions, some among them are genuine pan-neuronal genes while others are false positives. If the N1-box is in fact specific to the promoters of panneuronal genes in C. elegans, it should satisfy several criteria. First, high-scoring, conserved N1-boxes should be present in promoters of known pan-neuronal genes which were not included in the original training set. We searched for highscoring N1-boxes in a test set containing 21 such genes, whose
expression patterns, previously described in the literature, were not apparently different from those of the training set (Tables 1 and S2). We found that 11 of them (52%) scored as high or higher than the cut-off score we established based on the training set (Table 2). Second, promoters of genes expressed in small subsets of neurons should have few, if any, N1-boxes. We assembled a set of 100 such genes (Table S3) and found that only 7 (7%) of them possessed high-scoring motifs. Finally, genes not expressed in neurons also should not have highscoring N1-boxes. Indeed, among 100 genes expressed in body muscle, pharynx, intestine or hypodermis of C. elegans (Table S4), only 12 (12%) scored higher than the lowest gene from the training set. Thus, promoter elements of panneuronal genes are four to five times more likely to contain a high-scoring N1-box than promoters of genes expressed in small subsets of neurons or those expressed outside the nervous system. The N1-box controls expression of pan-neuronal genes Because the N1-box is overrepresented in promoters of panneuronal genes, we tested whether it has a function in regulating gene expression. First, we generated GFP reporters of promoter deletion series of several genes to identify the cis-regulatory elements required for broad neuronal expression. In accord with previously published results (Pilon et al., 2000), a 1-kb promoter fragment can direct the expression of ric-19 (a conserved cytosolic protein associated with secretory vesicles) in all or nearly all neurons in C. elegans (Fig. 2A). Progressive promoter deletions distal to the N1-box produced consistently weaker expression patterns in fewer cells in the anterior nerve ring, the ventral cord and the posterior ganglia, although in all cases extensive expression was seen in many neurons (Figs. 2B and C). In contrast, removal of a short fragment encompassing the N1-box resulted in a nearly complete abrogation of neuronal expression (Fig. 2D). Qualitatively similar results (Figs. 2F–I) were observed with promoter deletion series of sng-1 (synaptogyrin, a conserved protein involved in the regulation of exocytosis). Taken together, these results circumscribe the regions required for broad neuronal expression to fragments of 72 and 163 nucleotides, in promoters of ric-19 and sng-1, respectively. Even more prominently than in the case of ric-19 (Figs. 2A–D), we saw that shorter promoter elements of sng-1
Table 2 Fractions of genes that have high N1-box scores are located in gene expression mounts 1 or 6 and satisfy both requirements Category (number of genes)
High N1-box score
In mounts 1 or 6
High score and in mounts 1 or 6
Pan-neuronal genes in the training set (17) Pan-neuronal genes in the test set (21) Genes expressed in subsets of neurons (100) Genes expressed outside the nervous system (100)
12 (71%)
11 (65%)
7 (41%)
11 (52%)
18 (86%)
10 (48%)
7 (7%)
30 (30%)
3 (3%)
12 (12%)
35 (35%)
5 (5%)
I. Ruvinsky et al. / Developmental Biology 302 (2007) 617–626
621
Fig. 2. Expression patterns of GFP reporter constructs testing the function of the N1-box. Panels (A–E) ric-19, (F–I) sng-1 and (J, K) unc-1. (A) A 1068-bp promoter of ric-19 directs expression in all or nearly all neurons. (B) A shorter construct is expressed in fewer cells in the head, the ventral cord and the tail ganglia. (C) Further reduction of the number of expressing cells in the ventral cord. In addition, the relative levels of expression are diminished and ectopic expression is seen in the intestine. All three of these constructs are still expressed in a large number of neurons. (D) A construct which contains promoter sequence just proximal to the N1-box only shows expression in two neurons in the head and two in the tail. (E) Replacement of the N1-box with lexA binding site completely abrogates neuronal expression. (F) A 1812-bp promoter of sng-1 directs expression in all or nearly all neurons. (G) A shorter construct is expressed in fewer cells in the head, the ventral cord and the tail ganglia. (H) Further reduction of the number of expressing cells in the ventral cord. In addition, the relative levels of expression are diminished and ectopic expression is seen in the intestine. All three of these constructs are still expressed in a large number of neurons. (I) A construct which contains promoter sequence just proximal to the N1-box only shows expression in ∼ 10–12 neurons in the head; note strong ectopic expression in the pharynx and the intestine. The sng-1 promoter contains four tightly clustered N1-boxes which are schematically represented here by a single red box. (J) A 1736-bp promoter of unc-1 directs expression in a large number of head neurons, the ventral cord and posterior ganglia. (K) Replacement of the N1-box with lexA binding site diminishes the number of neurons expressing GFP in the head as well as in the ventral cord and in posterior ganglia.
are expressed in fewer neurons and in broader ectopic patterns, particularly in the intestine (Figs. 2F–I). These observations suggest that pan-neuronal expression and exclusion from non-
neuronal cell types may be mechanistically related and that multiple positive and negative elements exist in promoters of broadly expressed neuronal genes.
622
I. Ruvinsky et al. / Developmental Biology 302 (2007) 617–626
To verify that the N1-box is indeed required for pan-neuronal expression, we replaced it in the context of an intact ric-19 promoter with an unrelated sequence of the same length (lexA binding site). This replacement completely abolished neuronal expression (Fig. 2E). Although less dramatic, replacement of the N1-box in the promoter of unc-1 (a conserved membrane protein stomatin) with the lexA binding site resulted in a reduction of the number of cells expressing the reporter construct (Figs. 2J and K). These results suggest that the N1box mediates transcriptional control of broad neuronal expression in C. elegans, which is also controlled (or refined) by additional cis-regulatory elements. Finally, we tested whether the sequence of the N1-box alone is sufficient to direct expression in a broad neuronal pattern. We noticed that in a number of verified pan-neuronal promoter elements several high-scoring N1-boxes were tightly clustered, a phenomenon often observed in cis-regulatory regions (Berman et al., 2002; Markstein et al., 2002). In particular, four such sites are found within 85 bp in rpm-1, 140 bp in jkk-1 and 180 bp in sng-1. We generated constructs in which these fragments were inserted upstream of the pes-10 promoter, which alone is not capable of directing neuronal expression. Expression patterns of all three of these reporter constructs were similar—up to four neurons in the head and one to two in the tail ganglia as well as a strong intestinal pattern (Fig. S2). These results argue that the sequences of N1-boxes alone are unable to direct expression in a broad neuronal pattern. Pan-neuronal genes are highly overrepresented in gene expression mounts 1 and 6 We reasoned that the most likely candidates for novel panneuronal genes, in addition to possessing high-scoring N1boxes, should also be co-expressed with known pan-neuronal genes. Extensive microarray gene expression data are available for C. elegans. Genes have been assigned to expression mounts based on similarities and differences of their expression profiles across different experimental conditions (Kim et al., 2001). Of the 38 pan-neuronal genes studied (17 from the training set and 21 from the test set), 34 can be placed in one of the gene expression mounts (Tables S1 and S2); 29 (76%) were located in either mount 1 or mount 6, which together contain 15% of all genes (1818 and 909 genes, respectively). It is highly unlikely that this many genes would be found in mounts 1 and 6 as a result of a random sampling (p ∼ 10− 16). On the other hand, 87 of the 100 genes expressed in subsets of the nervous system (Table S3) can be placed in one of the gene expression mounts; 30 of them (12 and 18) are in mounts 1 and 6 (p ∼ 1.7 × 10− 4). Finally, 88 of the 100 genes expressed outside the nervous system (Table S4) can be placed in one of the gene expression mounts; 35 of them (32 and 3) are in mounts 1 and 6 (p ∼ 1.1 × 10− 6). It is not surprising that we find the genes expressed in subsets of neurons and genes expressed outside the nervous system to be somewhat enriched in mounts 1 and 6. The original report annotated mount 1 as being enriched for muscle and neuronal genes and mount 6 for neuronal genes only (Kim et al., 2001).
However, the overrepresentation is far more dramatic for panneuronal genes (by 10 to 12 orders of magnitude). Restricting the search from all annotated C. elegans genes to only those with C. briggsae orthologs did not change the fraction of genes found in gene expression mounts 1 and 6 (15.7% (1440 of 9183) of genes with orthologs, compared to 15.4% (2727 of 17661) of all genes). Although genes with high-scoring N1-box scores are slightly more likely to be found in mounts 1 and 6 than the lowscoring genes, expression data alone are not sufficiently prognostic of broad neuronal expression (Supplementary data). Combining motif discovery and gene expression data increases prediction accuracy To predict additional genes broadly expressed throughout the nervous system, we exploited the fact that the N1-box is overrepresented in promoters of known pan-neuronal genes and that these genes are highly enriched in gene expression mounts 1 and 6: 17 of the 38 (45%) known pan-neuronal genes and 10 of 21 (48%) genes from the test set satisfy both criteria, whereas only 8 of the 200 (4%) non-pan-neuronal genes do so (Table 2). This suggests that pan-neuronal genes are nearly 11 times more likely to satisfy both criteria and implies that nearly half of all pan-neuronal genes may be identified using the approach outlined above. Although some genuine pan-neuronal genes were omitted by imposing both requirements, we feel that this loss was justified by a more than two-fold reduction in the fraction of high-scoring non-pan-neuronal genes (Table 2). To define a set of candidate pan-neuronal genes, we selected from among the 1136 orthologous pairs with high N1-box scores those which were located in gene expression mounts 1 or 6 (Fig. 1C). There were 241 such genes; seven of them were from the training set (Table S5). To infer the likely functions of all predicted genes, we conducted manual homology and literature searches and assigned annotations based on sequence identity. Most genes in the set (∼ 80%) have clearly identifiable homologs in the human and Drosophila genomes. We next partitioned them into ten broad functional categories (Tables 3 and S5). Reflective of the functional diversity within the training set, our candidate pan-neuronal genes are predicted to have a variety of biochemical functions. Based on these identities, many of them – channels/receptors/transporters, proteins involved in synaptic transmission and G-proteinmediated signaling, etc. – are expected to be expressed in neurons. In fact, when we compared the frequency of Gene Ontology (GO) terms, using GOStat and WormBase, between our 234 predictions and the set of 9183 C. elegans/C. briggsae orthologs, we found that the most over-represented terms were “ion transporter activity”, “GTP binding” and “signal transducer activity”. Other, heretofore unknown, genes provide a glimpse of novel neuron-specific pathways. Most predicted genes are expressed in C. elegans neurons To assess the accuracy of our predictions, we examined expression patterns of 27 promoter∷GFP constructs representing 24 genes from the list of 241 genes described above (Figs.
I. Ruvinsky et al. / Developmental Biology 302 (2007) 617–626 Table 3 Partial list of predicted pan-neuronal genes Gene model (locus name)
Annotation
Channels/receptors/transporters F57C7.2 (nhx-5) K03E6.5 (unc-1) T02C5.5 (unc-2) Cell surface (11) R107.8 (lin-12) F54F2.1 K10C3.3 (zig-1) Cytoskeleton (11) C36B1.1 (cle-1) D1069.2 (cpn-2) F09B9.2 (unc-115) Synaptic transmission (10) R160.1 (dpy-23) C34E11.1 (rsd-3) F31E8.2 (snt-1) Kinases/phosphatases (15) K07A9.2 (cmk-1) B0478.1 (jnk-1) C09D8.1 (ptp-3) G-protein/other signaling (29) F17C8.1 (acy-1) F08B6.2 (gpc-2) K09A9.2 (rab-14) Protein modification (9) F01D4.4 (egl-21) C11H1.3 T04C10.2 (epn-1) Transcription/chromatin (28) F25E2.5 (daf-3) K08A8.2 (sox-2) F28F9.1 (zag-1) Metabolism (27) D1022.8 (cah-2) C06G3.5 B0304.3 Other/unknown (55) Y56A3A.33 T07E3.4 C18B2.4
(39) Sodium/hydrogen exchanger Stomatin Calcium channel Notch transmembrane receptor Integrin Immunoglobulin-domain protein Neuronal collagen NP25/calponin-like Actin-binding protein required for pathfinding Clathrin-adaptor protein Clathrin associated Synaptotagmin Calcium/calmodulin-dependent protein kinase MAP kinase Receptor-type protein–tyrosine phosphatase Adenylyl cyclases Heterotrimeric G-protein gamma Rab family member Carboxypeptidase C3HC4-type, zinc finger (RING finger) Epsin homolog (Deubiquitinating enzyme) SMAD 4 transcription factor HMG transcription factor C2H2-type zinc finger transcription factor Carbonic anhydrase Adenosine deaminase Cytochrome P450 Exonuclease III F-box GRAM-domain protein
The total number of genes in each category is listed in parentheses. Complete list is given in Table S5.
S3–S6). The strains were obtained from the Genome British Columbia C. elegans Gene Expression Consortium (http:// elegans.bcgsc.bc.ca; McKay et al., 2003). Whereas expression of 17 of these constructs could be detected in at least some neurons, four showed broad neuronal patterns. In addition, detailed expression patterns of 56 predicted genes have been previously described in the literature (WormBase, http://www. wormbase.org). Therefore, altogether expression patterns of 80 of 234 predicted genes (not counting seven genes from the original training set) were analyzed. We assigned these patterns into one of five categories—(1) ubiquitous (expressed in all or nearly all cells), (2) pan-neuronal, (3) approximately half of all neurons or more, (4) subsets of neurons (considerably fewer than half of neurons) and (5) exclusively non-neuronal (Table S6). We combined categories 2 and 3 into a single class, since in practice it is difficult to determine the exact number of GFPexpressing cells for a construct expressed in a large number of
623
neurons. As shown in Fig. 3A, of the 80 de novo predicted genes whose expression patterns were established, nearly 9% were expressed in all or nearly all cells, 35% in more than half of all neurons, 41% showed less, but still some neuronal expression, while only 15% were expressed exclusively outside the nervous system. For comparison, of all genes whose expression patterns were previously determined (WormBase, http://www.wormbase.org), we randomly selected 100 genes (Table S7) and assigned them into categories by gene expression patterns. As can be seen in Fig. 3B, the two sets had similar fractions of ubiquitously expressed genes (9% vs. 10%) and genes expressed in relatively narrow neuronal patterns (41% vs. 40%). There was a sharp difference, however, in the fraction of genes expressed broadly in the nervous system (35% vs. 7%) and of the genes not expressed in neurons (15% vs. 43%). Both the N1-box score and gene expression data make a contribution to the overall prediction accuracy (Supplementary data), yet a combination of these two kinds of data produced more accurate predictions (compare Figs. 3A to C and D). These results suggest that by selecting the genes from expression mounts 1 and 6 that have conserved N1-box motifs, we enriched for genes expressed in neurons, particularly in broad patterns. Our definition of a “positive” is relatively stringent, requiring that at least half of all neurons express a given gene. The accuracy rate observed in this study is comparable with those reported for previous computational attempts to predict gene expression patterns (Markstein and Levine, 2002). Expanding the search for N1-boxes outside the 1-kb sequence immediately upstream of the gene, may result in the identification of additional pan-neuronal genes. Expression patterns of 154 predicted genes remain to be determined (234 predictions minus 80 with known expression patterns). Assuming the same true positive rate (35%) as seen in this study, we expect ∼54 genes to be expressed throughout the nervous system and thus be useful in defining the core set of broadly expressed neuronal genes. Discussion Relatively little is known about broadly expressed neuronal genes or the mechanisms that control their expression in any species. Therefore, when we initiated this study, only a limited set of genes was available for inclusion in our training set. To complicate matters, in many instances pan-neuronal genes are also expressed in cells outside the nervous system. It was not known whether some aspects of cis-regulation are shared by some (or all) broadly expressed neuronal genes or whether each gene is regulated independently in a piecemeal manner. We found a significant motif, the N1-box, overrepresented in promoters of known pan-neuronal genes in C. elegans and demonstrated that it contributes to broad neuronal expression. It was previously noticed that this motif is highly conserved within promoters of C. elegans/C. briggsae orthologs (Elemento and Tavazoie, 2005; GuhaThakurta et al., 2002), although its function was not identified. Furthermore, it was also reported to be necessary for the expression of a subset of ethanol-response genes (Kwon et al., 2004), which is perhaps not surprising given that many ethanol-specific responses may be mediated by
624
I. Ruvinsky et al. / Developmental Biology 302 (2007) 617–626
Fig. 3. Fraction of genes expressed in all cells, most neurons, narrower neuronal patterns and exclusively outside the nervous system. (A) 80 tested genes from the set of 234 predictions, (B) 100 random genes, (C) 100 random genes with high (i.e. above 2335) N1-box scores and (D) 100 random genes from gene expression mounts 1 and 6.
neurons. Furthermore, the N1-box shares a similar core sequence with a pharyngeal-specific motif Early-1 (Gaudet et al., 2004). Because these authors have identified C. elegans promoters that contain Early-1, we looked for an overlap between their sets and our predictions. There was no overlap between the 40 genes that contain Early-1 and the 241 panneuronal genes predicted in our study. There were eight genes in common between the set of 120 genes containing a variant of Early-1 (E1var) motif and our 241 pan-neuronal genes. Of these, expression patterns of four are known—his-71 and cki-1 are ubiquitously expressed, ric-3 and C11H1.3 are expressed both throughout the nervous system and in the pharynx. Given the limited amount of overlap and the expression patterns of the genes found in both sets, we conclude that N1-box and Early-1 (E1var) are substantially different, probably due to different nucleotide frequencies within the core motifs and distinct terminal sequences. Recently, Seiburth and colleagues (2005) reported a functional genomics screen to identify the genes involved in synaptic function in C. elegans. It might be expected that pan-neuronal genes might be enriched among the positives of their screen. We analyzed their results to test this possibility (see Supplementary data for details). The genes they designated as positives could be expressed in all neurons, some neurons or outside the nervous system. Furthermore, the two studies started from two different sets of genes—we from 9183 C. elegans/C. briggsae orthologs, while Seiburth and colleagues from a set of 2072 genes. Only 1412 genes were common to both sets. Despite these fundamental differences we observed a modest, although significant, overlap between the two studies, suggesting that
enriching for broadly expressed neuronal genes tends to enrich for genes with synaptic function. Interestingly, Sieburth and colleagues also noticed that most genes expressed in neurons (either in broad or narrow patterns) are also expressed outside the nervous system. Implications for understanding the mechanisms of pan-neuronal gene regulation Two alternative, but not necessarily mutually exclusive, models can be proposed to explain the regulation of broadly expressed neuronal genes: (1) a single, or a small set of, panneuronal trans-acting factors may coordinately regulate all panneuronal genes; or (2) individual genes may be regulated independently in different neuronal cell types. Two lines of evidence appear to support the latter model. First, expression of pan-neuronal genes in different cells is controlled by separable cis-regulatory elements—note narrower expression patterns of shorter promoter deletion constructs (Figs. 2A–C, F–H). Similar results were reported for promoter of ric-4 (Hwang and Lee, 2003). In both Drosophila and vertebrates, broad neuronal patterns of several genes are assembled in a piecemeal manner—multiple independent cis-regulatory elements drive expression in distinct groups of cells that together comprise a pan-neuronal pattern (Emery and Bier, 1995; Ip et al., 1994; Uchikawa et al., 2003). Second, recent findings show that expression of at least some pan-neuronal genes (jnk-1, ldb-1 and snb-1) in a given cell may be controlled by transcription factors expressed exclusively in that cell (Wenick and Hobert, 2004; Zhang et al., 2002).
I. Ruvinsky et al. / Developmental Biology 302 (2007) 617–626
On the other hand, however, our findings also suggest a global control of expression of at least some aspects of panneuronal gene expression. We identified a motif, N1-box, which is common to a subset of promoters of broadly expressed neuronal genes. Deletions or replacements of this motif with unrelated sequences lead to reduction of neuronal expression of several promoter elements (Figs. 2D, E, I, K). Similarly, in mammals expression of several neuron-specific genes is controlled by a conserved cis-element (Kraner et al., 1992; Lunyak et al., 2002; Mori et al., 1992) and candidate panneuronal cis-regulatory elements were computationally predicted in Ciona (Kusakabe et al., 2004). It is possible that some pan-neuronal genes in C. elegans are under the global control of a single broadly expressed trans-acting factor, mediated by the N1-box or multiple factors with similar DNA binding specificities. The fact that N1-box alone is likely not sufficient to direct broad expression suggests the existence of additional pan-neuronal motifs and/or incompatibility between N1-boxes and some basal promoters (Butler and Kadonaga, 2001). In parallel with global control, expression of pan-neuronal genes in individual groups of cells is also modulated by transcription factors uniquely present in those cells. In this view, subtypespecific and global mechanisms act in concert to establish gene expression throughout the nervous system. Because similar modes of regulation are seen in worms, flies and vertebrates, it is possible that this combination of two mechanisms is a feature shared by all metazoans. Using different types of data to predict gene expression patterns To predict additional pan-neuronal genes, we employed a strategy (Fig. 1) that combined searching for N1-box motif in promoters of C. elegans/C. briggsae orthologs with clustered microarray gene expression data (Kim et al., 2001). The combination of these two types of data provided more accurate results than either would alone (Table 2, Supplementary data). Thus, our results underscore the utility of clustering the microarray gene expression data into expression mounts. Even though those data were obtained in a variety of experiments unrelated to our research paradigm and were not alone sufficiently prognostic of gene expression patterns, the combination of microarray expression with N1-box motif searches allowed us to derive more accurate predictions of gene expression patterns, confirming the general applicability of this approach. Finally, the predicted pan-neuronal candidate genes likely comprise some of the core set of molecules which endow neurons with their generic properties and thus their study will reveal important aspects of development and function of the nervous system. Acknowledgments We are grateful to members of the Ruvkun and Kaplan laboratories for helpful advice and suggestions, Q. Ch'ng and D. Sieburth for providing data prior to publication and
625
discussions, J. Gaudet and D. Miller for discussions and I. Antoshechkin (WormBase) and S. Georgiev for help with data analyses. Plasmids were a kind gift of A. Fire. 24 promoter∷GFP strains were obtained from the Genome British Columbia C. elegans Gene Expression Consortium. We thank the members of this consortium, particularly Rebecca Newbury, for this generous contribution. Some nematode strains used in this work were provided by the Caenorhabditis Genetics Center, which is funded by the NIH National Center for Research Resources (NCRR). This work was supported in part by a fellowship from the Jane Coffin Childs Memorial Fund for Medical Research to IR, by a grant from the NSF to CBB and by the Department of Molecular Biology, Massachusetts General Hospital. Appendix A. Supplementary data Supplementary data associated with this article can be found, in the online version, at doi:10.1016/j.ydbio.2006.09.014. References Bailey, T.L., Elkan, C., 1994. Fitting a mixture model by expectation maximization to discover motifs in biopolymers. Proceedings of the Second International Conference on Intelligent Systems in Molecular Biology. AAAI Press, Menlo Park, pp. 28–36. Bargmann, C.I., 1998. Neurobiology of the Caenorhabditis elegans genome. Science 282, 2028–2033. Berman, B.P., Nibu, Y., Pfeiffer, B.D., Tomancak, P., Celniker, S.E., Levine, M., Rubin, G.M., Eisen, M.B., 2002. Exploiting transcription factor binding site clustering to identify cis-regulatory modules involved in pattern formation in the Drosophila genome. Proc. Natl. Acad. Sci. U.S.A. 99, 757–762. Blumenthal, T., Evans, D., Link, C.D., Guffanti, A., Lawson, D., Thierry-Mieg, J., Thierry-Mieg, D., Chiu, W.L., Duke, K., Kiraly, M., Kim, S.K., 2002. A global analysis of Caenorhabditis elegans operons. Nature 417, 851–854. Boffelli, D., McAuliffe, J., Ovcharenko, D., Lewis, K.D., Ovcharenko, I., Pachter, L., Rubin, E.M., 2003. Phylogenetic shadowing of primate sequences to find functional regions of the human genome. Science 299, 1391–1394. Butler, J.E., Kadonaga, J.T., 2001. Enhancer-promoter specificity mediated by DPE or TATA core promoter motifs. Genes Dev. 15, 2515–2519. C. elegans Sequencing Consortium, 1998. Genome sequence of the nematode C. elegans: a platform for investigating biology. Science 282, 2012–2018. Elemento, O., Tavazoie, S., 2005. Fast and systematic genome-wide discovery of conserved regulatory elements using a non-alignment based approach. Genome Biol. 6, R18. Emberly, E., Rajewsky, N., Siggia, E.D., 2003. Conservation of regulatory elements between two species of Drosophila. BMC Bioinform. 4, 57. Emery, J.F., Bier, E., 1995. Specificity of CNS and PNS regulatory subelements comprising pan-neural enhancers of the deadpan and scratch genes is achieved by repression. Development 121, 3549–3560. Gaudet, J., Muttumu, S., Horner, M., Mango, S.E., 2004. Whole-genome analysis of temporal gene expression during foregut development. PLoS Biol. 2, e352. Granato, M., Schnabel, H., Schnabel, R., 1994. pha-1, a selectable marker for gene transfer in C. elegans. Nucleic Acids Res. 22, 1762–1763. GuhaThakurta, D., Palomar, L., Stormo, G.D., Tedesco, P., Johnson, T.E., Walker, D.W., Lithgow, G., Kim, S., Link, C.D., 2002. Identification of a novel cisregulatory element involved in the heat shock response in Caenorhabditis elegans using microarray gene expression and computational methods. Genome Res. 12, 701–712. Hertz, G.Z., Stormo, G.D., 1999. Identifying DNA and protein patterns with statistically significant alignments of multiple sequences. Bioinformatics 15, 563–577.
626
I. Ruvinsky et al. / Developmental Biology 302 (2007) 617–626
Hwang, S.B., Lee, J., 2003. Neuron cell type-specific SNAP-25 expression driven by multiple regulatory elements in the nematode Caenorhabditis elegans. J. Mol. Biol. 333, 237–247. Ip, Y.T., Levine, M., Bier, E., 1994. Neurogenic expression of snail is controlled by separable CNS and PNS promoter elements. Development 120, 199–207. Iwasaki, K., Staunton, J., Saifee, O., Nonet, M., Thomas, J.H., 1997. aex-3 encodes a novel regulator of presynaptic activity in C. elegans. Neuron 18, 613–622. Jareborg, N., Birney, E., Durbin, R., 1999. Comparative analysis of noncoding regions of 77 orthologous mouse and human gene pairs. Genome Res. 9, 815–824. Kandel, E.R., Schwartz, J.H., Jessell, T.M., 2000. Principles of Neural Science. McGraw-Hill, New York. Kim, S.K., Lund, J., Kiraly, M., Duke, K., Jiang, M., Stuart, J.M., Eizinger, A., Wylie, B.N., Davidson, G.S., 2001. A gene expression map for Caenorhabditis elegans. Science 293, 2087–2092. Kiontke, K., Gavin, N.P., Raynes, Y., Roehrig, C., Piano, F., Fitch, D.H., 2004. Caenorhabditis phylogeny predicts convergence of hermaphroditism and extensive intron loss. Proc. Natl. Acad. Sci. U.S.A. 101, 9003–9008. Kraner, S.D., Chong, J.A., Tsay, H.J., Mandel, G., 1992. Silencing the type II sodium channel gene: a model for neural-specific gene regulation. Neuron 9, 37–44. Kusakabe, T., Yoshida, R., Ikeda, Y., Tsuda, M., 2004. Computational discovery of DNA motifs associated with cell type-specific gene expression in Ciona. Dev. Biol. 276, 563–580. Kwon, J.Y., Hong, M., Choi, M.S., Kang, S., Duke, K., Kim, S., Lee, S., Lee, J., 2004. Ethanol-response genes and their regulation analyzed by a microarray and comparative genomic approach in the nematode Caenorhabditis elegans. Genomics 83, 600–614. Lunyak, V.V., Burgess, R., Prefontaine, G.G., Nelson, C., Sze, S.H., Chenoweth, J., Schwartz, P., Pevzner, P.A., Glass, C., Mandel, G., Rosenfeld, M.G., 2002. Corepressor-dependent silencing of chromosomal regions encoding neuronal genes. Science 298, 1747–1752. Maduro, M., Pilgrim, D., 1996. Conservation of function and expression of unc119 from two Caenorhabditis species despite divergence of non-coding DNA. Gene 183, 77–85. Markstein, M., Levine, M., 2002. Decoding cis-regulatory DNAs in the Drosophila genome. Curr. Opin. Genet. Dev. 12, 601–606. Markstein, M., Markstein, P., Markstein, V., Levine, M.S., 2002. Genome-wide analysis of clustered Dorsal binding sites identifies putative target genes in the Drosophila embryo. Proc. Natl. Acad. Sci. U.S.A. 99, 763–768. McKay, S.J., Johnsen, R., Khattra, J., Asano, J., Baillie, D.L., Chan, S., Dube, N., Fang, L., Goszczynski, B., Ha, E., Halfnight, E., Hollebakken, R., Huang, P., Hung, K., Jensen, V., Jones, S.J., Kai, H., Li, D., Mah, A., Marra, M., McGhee, J., Newbury, R., Pouzyrev, A., Riddle, D.L., Sonnhammer, E., Tian, H., Tu, D., Tyson, J.R., Vatcher, G., Warner, A., Wong, K., Zhao, Z., Moerman, D.G., 2003. Gene expression profiling of cells, tissues, and developmental stages of the nematode C. elegans. Cold Spring Harbor Symp. Quant. Biol. 68, 159–169. Melkman, T., Sengupta, P., 2004. The worm's sense of smell. Development of functional diversity in the chemosensory system of Caenorhabditis elegans. Dev. Biol. 265, 302–319. Mori, N., Schoenherr, C., Vandenbergh, D.J., Anderson, D.J., 1992. A common silencer element in the SCG10 and type II Na+ channel genes binds a factor present in nonneuronal cells but not in neuronal cells. Neuron 9, 45–54.
Nonet, M.L., Holgado, A.M., Brewer, F., Serpe, C.J., Norbeck, B.A., Holleran, J., Wei, L., Hartwieg, E., Jorgensen, E.M., Alfonso, A., 1999. UNC-11, a Caenorhabditis elegans AP180 homologue, regulates the size and protein composition of synaptic vesicles. Mol. Biol. Cell 10, 2343–2360. Pilon, M., Peng, X.R., Spence, A.M., Plasterk, R.H., Dosch, H.M., 2000. The diabetes autoantigen ICA69 and its Caenorhabditis elegans homologue, ric-19, are conserved regulators of neuroendocrine secretion. Mol. Biol. Cell 11, 3277–3288. Rajaram, S., Spangler, T.L., Sedensky, M.M., Morgan, P.G., 1999. A stomatin and a degenerin interact to control anesthetic sensitivity in Caenorhabditis elegans. Genetics 153, 1673–1682. Robison, K., McGuire, A.M., Church, G.M., 1998. A comprehensive library of DNA-binding site matrices for 55 proteins applied to the complete Escherichia coli K-12 genome. J. Mol. Biol. 284, 241–254. Ruvinsky, I., Ruvkun, G., 2003. Functional tests of enhancer conservation between distantly related species. Development 130, 5133–5142. Shirasaki, R., Pfaff, S.L., 2002. Transcriptional codes and the control of neuronal identity. Annu. Rev. Neurosci. 25, 251–281. Siddharthan, R., Siggia, E.D., van Nimwegen, E., 2005. PhyloGibbs: a Gibbs sampling motif finder that incorporates phylogeny. PLoS Comput. Biol. 1, e67. Sieburth, D., Ch'ng, Q., Dybbs, M., Tavazoie, M., Kennedy, S., Wang, D., Dupuy, D., Rual, J.F., Hill, D.E., Vidal, M., Ruvkun, G., Kaplan, J.M., 2005. Systematic analysis of genes required for synapse structure and function. Nature 436, 510–517. Smith, N.G., Brandstrom, M., Ellegren, H., 2004. Evidence for turnover of functional noncoding DNA in mammalian genome evolution. Genomics 84, 806–813. Stein, L.D., Bao, Z., Blasiar, D., Blumenthal, T., Brent, M.R., Chen, N., Chinwalla, A., Clarke, L., Clee, C., Coghlan, A., Coulson, A., D'Eustachio, P., Fitch, D.H., Fulton, L.A., Fulton, R.E., Griffiths-Jones, S., Harris, T.W., Hillier, L.W., Kamath, R., Kuwabara, P.E., Mardis, E.R., Marra, M.A., Miner, T.L., Minx, P., Mullikin, J.C., Plumb, R.W., Rogers, J., Schein, J.E., Sohrmann, M., Spieth, J., Stajich, J.E., Wei, C., Willey, D., Wilson, R.K., Durbin, R., Waterston, R.H., 2003. The genome sequence of Caenorhabditis briggsae: a platform for comparative genomics. PLoS Biol. 1, E45. Stone, J.R., Wray, G.A., 2001. Rapid evolution of cis-regulatory sequences via local point mutations. Mol. Biol. Evol. 18, 1764–1770. Thor, S., Thomas, J., 2002. Motor neuron specification in worms, flies and mice: conserved and ‘lost’ mechanisms. Curr. Opin. Genet. Dev. 12, 558–564. Uchikawa, M., Ishida, Y., Takemoto, T., Kamachi, Y., Kondoh, H., 2003. Functional analysis of chicken Sox2 enhancers highlights an array of diverse regulatory elements that are conserved in mammals. Dev. Cell 4, 509–519. Wenick, A.S., Hobert, O., 2004. Genomic cis-regulatory architecture and transacting regulators of a single interneuron-specific gene battery in C. elegans. Dev. Cell 6, 757–770. Wray, G.A., Hahn, M.W., Abouheif, E., Balhoff, J.P., Pizer, M., Rockman, M.V., Romano, L.A., 2003. The evolution of transcriptional regulation in eukaryotes. Mol. Biol. Evol. 20, 1377–1419. Zhang, M.Q., 1999. Large-scale gene expression data analysis: a new challenge to computational biologists. Genome Res. 9, 681–688. Zhang, Y., Ma, C., Delohery, T., Nasipak, B., Foat, B.C., Bounoutas, A., Bussemaker, H.J., Kim, S.K., Chalfie, M., 2002. Identification of genes expressed in C. elegans touch receptor neurons. Nature 418, 331–335.