Hindawi Publishing Corporation e Scientific World Journal Volume 2014, Article ID 295070, 11 pages http://dx.doi.org/10.1155/2014/295070
Research Article Detection of Burst Suppression Patterns in EEG Using Recurrence Rate Zhenhu Liang,1 Yinghua Wang,2,3 Yongshao Ren,1 Duan Li,4 Logan Voss,5 Jamie Sleigh,5 and Xiaoli Li2,3 1
Institute of Electrical Engineering, Yanshan University, Qinhuangdao 066004, China State Key Laboratory of Cognitive Neuroscience and Learning and IDG/McGovern Institute for Brain Research, Beijing Normal University, Beijing 100875, China 3 Center for Collaboration and Innovation in Brain and Learning Sciences, Beijing Normal University, Beijing 100875, China 4 Institute of Information and Science Engineering, Yanshan University, Qinhuangdao 066004, China 5 Department of Anesthesia, Waikato Hospital, Hamilton, New Zealand 2
Correspondence should be addressed to Xiaoli Li;
[email protected] Received 21 January 2014; Accepted 20 February 2014; Published 17 April 2014 Academic Editors: H.-K. Lam, J. Li, G. Ouyang, and T. Stathaki Copyright © 2014 Zhenhu Liang et al. This is an open access article distributed under the Creative Commons Attribution License, which permits unrestricted use, distribution, and reproduction in any medium, provided the original work is properly cited. Burst suppression is a unique electroencephalogram (EEG) pattern commonly seen in cases of severely reduced brain activity such as overdose of general anesthesia. It is important to detect burst suppression reliably during the administration of anesthetic or sedative agents, especially for cerebral-protective treatments in various neurosurgical diseases. This study investigates recurrent plot (RP) analysis for the detection of the burst suppression pattern (BSP) in EEG. The RP analysis is applied to EEG data containing BSPs collected from 14 patients. Firstly we obtain the best selection of parameters for RP analysis. Then, the recurrence rate (RR), determinism (DET), and entropy (ENTR) are calculated. Then RR was selected as the best BSP index one-way analysis of variance (ANOVA) and multiple comparison tests. Finally, the performance of RR analysis is compared with spectral analysis, bispectral analysis, approximate entropy, and the nonlinear energy operator (NLEO). ANOVA and multiple comparison tests showed that the RR could detect BSP and that it was superior to other measures with the highest sensitivity of suppression detection (96.49%, 𝑃 = 0.03). Tracking BSP patterns is essential for clinical monitoring in critically ill and anesthetized patients. The purposed RR may provide an effective burst suppression detector for developing new patient monitoring systems.
1. Introduction The electroencephalographic burst suppression pattern (BSP) consists of high amplitude bursts interrupted by low amplitude suppressions. It can be observed in different clinical conditions (head trauma, stroke, coma, anoxia, and hypothermia) [1, 2] and can also be induced by pharmacological agents such as anesthetics, analgesics, or antiepileptic drugs [3]. The BSP is a representative of the interaction between neuronal dynamics and brain metabolism. Each series of successive bursts can be viewed as an attempted recovery of basal cortical dynamics [4]. So, the BSP can be seen as a defined “reference point” during administration of anesthetic or sedative agents and is considered a reliable indicator of adequate cerebral-protection for various neurosurgical
diseases. It is commonly used as a monitor for the titration of sedatives in order to achieve a maximum reduction of cerebral metabolic rate [5]. Many researchers have investigated methods for BSP detection. Early methods were based on the spectral analysis, such as the spectral edge frequency and the median frequency [6, 7]. Although these methods can successfully obtain the frequency and spectral characteristics of the BSP [8], they ignore the intense nonlinearity of the BSP, resulting in low accuracy of detection. The bispectral method was designed to distinguish the BSP in the EEG series, but it is based on a two-dimensional function, which requires complicated computational processes. A recent method based on the information theory and nonlinear time series analysis (approximate entropy) has been also developed [9]. This method evaluates
2 the signal regularity in the EEG series for detection of the BSP. Actually, both the burst signal and suppression signal in the EEG series are surprisingly regular, so the approximate entropy can detect BSP in normal EEG series signals; however it cannot differentiate between the burst and suppression patterns. The nonlinear energy operator (NLEO) is a simple nonlinear method for BSP detection, which measures the energy in a single-component signal [10–12]. However, it is very sensitive to the exaction threshold selection. Therefore, a robust approach for the reliable detection of BSP remains elusive. Recurrence quantification analysis (RQA) [13] can measure the complexity of a short and non-stationary characteristic signal with noise [14, 15]. Furthermore, it can analyze both linear and nonlinear time series to quantify the activity of a system irrespective of the numbers or dynamical nature of the individual sources [16]. Up to now, the RQA has been broadly applied in the analysis of physiological data [17–20]. In this study, we investigated whether it could be applied to the EEG for detection of the BSP. The paper is organized as follows. In Section 2 the subjects and recordings, signal preprocessing, RQA methods, and statistical analysis are introduced. Then we provide the results for parameter selection and a comparison of different RQA measures. After choosing the best RQA parameter using statistical analysis, we compared its performance with a few existing BSP detection methods. After that we show the application of RQA measure to a long-term EEG records. At last we discuss some properties of the proposed method.
2. Materials and Methods 2.1. Subjects and EEG Recordings. The data used in this study were obtained from a previously reported study on dreaming during general anesthesia [21, 22]. Clinical trials registration is ClinicalTrials.gov identifier NCT00446212; Australian Clinical Trials Registry number is ACTRN12606000279527. Ethical committee review and patient written informed consent were obtained. Two experienced experts selected 14 patients whose EEGs include obvious burst suppression patterns out of a group of patients (300) recruited for the sleep data collection. These patients were adults (aged 18–50 yrs) who were American Society of Anesthesiologists’ physical status I–III, presenting for elective noncardiac surgery under relaxant general anesthesia with endotracheal intubation. Patients were randomized to two groups before the surgery. Anesthesia was induced with propofol, fentanyl 1-2 𝜇g/kg, and a muscle relaxant and then maintained with either propofol or desflurane; and the patient’s lungs ventilated for normocapnia. The maintenance hypnotic (either propofol or desflurane) was then titrated to aim for a bispectral index (BIS, Aspect Medical Systems Inc.) of 40–55. The EEG signal was obtained using the Aspect XP monitor (BIS-XP, Aspect Medical Systems Inc., Norwood, MA) with the proprietary electrode strip on the standard recommended prefrontal montage (FP2-FT7). The raw signal was digitized at 100/sec 14-bit precision and stored by a laptop computer. Offline
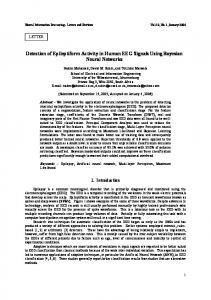
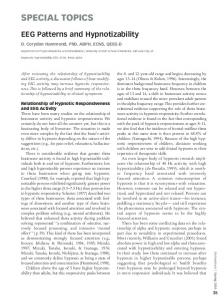
The Scientific World Journal analysis was performed using the MATLAB software (version 7, MathWorks Inc.). 2.2. EEG Preprocessing. Artifacts in scalp EEG recordings mainly come from eye movement, muscle activity, and power frequency noise. To reduce these artifacts, the following steps are carried out. First, statistical mean and standard deviation methods were used to remove the outlier points. Then, a stationary wavelet transform [23] was utilized to reduce the electrooculogram (EOG) artifact by setting an appropriate threshold. Finally, the two-way least-square finite impulse response (FIR) at a zero-phase forward and reverse operation [24] was applied to reduce 0–0.5 Hz baseline drift. 2.3. BSP Detection. The process of BSP detection is depicted with a block diagram in Figure 1. Block 1. For a given time series 𝑥1 , 𝑥2 , . . . , 𝑥𝑙 construct the phase space vector X𝑖 using a time delay method, X𝑘 = (𝑥𝑘 , 𝑥𝑘+𝜏 , . . . , 𝑥𝑘+(𝑚−1)𝜏 ) [25], based on the observations 𝑥𝑘 . Here 𝑘 = 1, 2, . . . , 𝑁 − (𝑚 − 1), 𝜏 is the delay time, and 𝑚 is the embedding dimension. Block 2. Determine the parameters 𝑚, 𝜏, and 𝑟. Block 3. Use recurrence plot (RP) to visualize the time dependent behavior of orbits X𝑖 in a phase space. It is shown that RP can describe dynamical characteristics of burst suppression patterns. The key step of RP is to calculate the following 𝑁 × 𝑁 matrix: 1 : X𝑖 − Y𝑗 ≤ 𝑟 𝑖, 𝑗 = 1, . . . , 𝑁, (1) 𝑅𝑖,𝑗 = { 0 : Otherwise where 𝑁 is the number of points in the times series for analysis, ‖ ⋅ ‖ is the norm (the 𝐿 ∞ -norm is selected because it is computationally faster and allows the studying of some features in RPs analytically), and 𝑟 is the cutoff distance defining an area centered at X𝑖 . As can be seen in Figure 2, the EEG signal is comprised of three segments, 1000-point suppression, 1000-point burst, and 1000-point normal EEGs from the first patient. RP forms are different for EEG segments during suppression, burst, and normal states. The blue box corresponding to the suppression shows thick black dots; the green box to the burst shows sparse dots; and the red box to the normal state shows uniform dots, which is similar to that of a white noise. Block 4. Analyze the recurrence point density in RPs. The procedure is known as recurrence quantification analysis (RQA). More details of RP and RQA can be found in [26, 27]. First we introduce the simplest measure of RQA, RR, which is a measure of the density of recurrence points which simply counts the black dots in the RP. RR is calculated by RR =
1 𝑁 ∑𝑅 . 𝑁2 𝑖,𝑗=1 𝑖,𝑗
(2)
The ratio of recurrence points on the diagonal structures to all recurrence points is called determinism (DET).
The Scientific World Journal
3 1
Start Preprocessed EEG series x1 , x2 , . . . xl
Taken’s time delay method The phase space vector Xi Xk = (xk , xk+𝜏 , . . . , xk+(m−1)𝜏 )
2
False nearest neighbors algorithm
The first local minimum of the mutual information
Recurrence rate greater than 1%
The time delay 𝜏
The radius r
The embedding dimension m
3 Ri,j = {
1: ‖X i − Yj ‖ ≤ r 0: Otherwise
i, j = 1, . . . , N
Recurrence plots (RP): the binary values of can be simply visualized with the black (1) and white (0)
4
Recurrence quantification analysis (RQA)
RR =
1 N ∑ Ri,j N2 i,j=1
N
N
l=lmin
i,j=1
DET = ∑ lP(l)/∑ Ri,j
N
ENTR = − ∑ p(l)ln p(l) l=lmin N
5 Compare of three RQA measures and select the most appropriate 6 Normalization y =
ENTR = − ∑ p(l)lnp(l) l=lmin
x − Minvalue Maxvalue − Minvalue
7 Determine the threshold 𝜀 Classify to burst or suppression state 8 Compute burst suppression ratio (BSR)
End
Figure 1: The block diagrams of EEG signal processing.
The DET is a determinism (or predictability) measure of a system, calculated by DET =
∑𝑁 𝑙=𝑙min 𝑙𝑃 (𝑙) ∑𝑁 𝑖,𝑗=1 𝑅𝑖,𝑗
,
(3)
where 𝑃(𝑙) is the frequency distribution of the lengths of the diagonal structures in the RP and 𝑙min is the threshold, which excludes the diagonal lines formed by the tangential motion of a phase space trajectory. The ENTR is considered as a complexity measure of a deterministic structure in a dynamical system. The ENTR
4
The Scientific World Journal 3000
2500
Point
2000
1500
1000
(𝜇V)
100
Suppression
Burst
Normal 500
0
−100
0 500
1000
1500 Point
2000
2500
3000
0
500
1000
1500
2000
2500
3000
Point
(a)
(b)
Figure 2: (a) A composite EEG signal from a patient. It consists of suppression (1000-point), burst (1000-point), and normal (1000-point) records artificially joined together; (b) different RP patterns during suppression, burst, and normal states, respectively. The blue box represents the suppression, the green box the burst, and the red box the normal state.
refers to the Shannon entropy of the frequency distribution of the diagonal line lengths. The more complex the deterministic structure, the larger the ENTR value. ENTR is calculated as 𝑁
ENTR = − ∑ 𝑝 (𝑙) ln 𝑝 (𝑙) .
(4)
𝑙=𝑙min
3. Results
Block 5. Compare the three RQA measures and select the most appropriate BSP index. The details are explained later in results. Block 6. Normalize the index to eliminate individual differences. The normalized linear formula is calculated by 𝑦=
𝑥 − mean (𝑥) . max (𝑥) − min (𝑥)
(5)
Block 7. Determine the threshold 𝜀 for detecting the BSP. The details are explained later in results. Block 8. Calculate the burst suppression ratio (BSR). BSR represents the intensity of the burst suppression pattern in the long-term EEG recordings [28]. It is calculated as BSR =
Total time of suppression × 100%. epoch length
were performed on averaged RR values. We also compared RR and NLEO for detecting and classifying BSP with confusion matrixes [29, 30], which contains information about actual and predicted classifications done by a classification system.
(6)
2.4. Statistical Analysis. To test the performance of the three RQA indexes RR, DET, and ENTR to detect BSP in the EEG series, the one-way ANOVA and multiple comparison tests
3.1. Choice of the Parameters. Prior to calculating a recurrent plot index from EEG data, the phase space reconstruction should first be determined. In consideration of the nonstationary characteristic of the EEG signals exhibiting rather sudden changes of state, the notion of a “correct” embedding or delay is inappropriate—as demonstrated by Grassberger and Schreiber [29]. Therefore, we determined the embedding dimension of EEG signals by using the false nearest neighbors algorithm [31]. Figure 3(a) shows the false nearest neighbors versus the dimension from 0 to 40, and the dimension is approximately 5 at the first local minimum of false nearest neighbors. Figure 3(b) shows a focused view of Figure 3(a). It shows that the false nearest neighbors become stable for 𝑚 ≥ 4; thus 𝑚 = 4 would be the optimal choice of embedding dimension for the phase space reconstruction. The first local minimum of the mutual information measure was used to determine the time delay parameter [32, 33]. This method provides a reconstruction which maximally “unfolds” the dynamics. Figure 3(c) shows the mutual information versus the lag time 0 to 40, and the delay time 𝜏 is approximately 5 at the first local minimum of mutual information. From the focused view in Figure 3(d) we see that 𝜏 = 3 is a preferred value for the phase space reconstruction.
The Scientific World Journal
5 6 5
0.8 Mutual information
The false nearest neighbours
1
0.6
0.4
0.2
0
4 3 2 1 0
0
5
10
15
20 25 Dimension
30
35
40
0
5
10
15
(a)
30
35
40
(c)
5
0.8 Mutual information
The false nearest-neighbours
25
6
1
0.6
0.4
0.2
0
20 Lag
4 3 2 1 0
1
2
3
4
5
6
7
8
9
10
0
2
4
6
Dimension
Lag
(b)
(d)
8
10
Figure 3: The embedding dimension and delay time of the EEG signals during the burst suppression state. (a) The false nearest neighbors versus the dimension with scales from 0 to 40. (b) The local plot of (a) with the dimension scales from 1 to 10. (c) The mutual information versus the delay time with scales from 0 to 40. (d) The local plot of (c) with the delay time scales from 1 to 10.
Another crucial parameter of RP is the radius 𝑟. Conventionally 𝑟 is adjusted so that there would be sufficient numbers of recurrence values to make the recurrence rate larger than 1%. Figure 4 shows the different RP under different radius for an identical typical time series composed of 10 s suppression and 10 s burst. When 𝑟 = 0.1, the RP for the suppression part in the green box does not show an obvious recurrent state. But when 𝑟 = 0.5 and 𝑟 = 0.7, the green box of RP for the suppression part is filled with black dots and red box for the burst part in the red box shows some undesirable regular black dots. Only when 𝑟 = 0.3 does the RP for suppression part show the required recurrent state. So 𝑟 = 0.3 is an appropriate choice of the radius. 3.2. Comparison of Three RQA Measures. The comparison of the three RQA measures, and, hence, selection of the BSP index, is another important issue. Figure 5 shows the statistics of corresponding RR, DET, and ENTR calculated on an EEG
series composed of 1000-point suppression, 1000-point burst, and 1000-point normal signals (see Figure 1). As can be seen in Figure 5, all the three measures could readily distinguish the burst and suppression patterns. However, DET and ENTR do not show significant differences between the suppression and normal states. To evaluate the performance of the three RQA indexes, we applied the one-way repeated measure ANOVA and multiple comparisons. As shown in Table 1, the difference between values at different states for all indices is all significant (𝑃 < 0.001). However, the RR has a larger 𝐹 value and thus is the best at the 𝑃 < 0.001 level of probability. Multiple comparison tests showed that all three indices could distinguish between the burst and suppression states and the burst and normal states (difference of mean >0). However only the RR measure could distinguish between the suppression and normal states (the other two indexes’ difference contains 0 and thus are not significant). So the RR measure was chosen to be the index of the BSP identification.
6
The Scientific World Journal
(𝜇V)
100 0 −100
200
400
600
800 1000 1200 1400 1600 1800 Point (a)
r = 0.3 1800
1400
1400
1000
1000
600
600
200
200
0
Point
Point
1800
0
200
600 1000 Point
1400
0
1800
600 1000 Point (B) r = 0.7
1800
1400
1400
1000
1000
600
600
200
200
0 200
200
(A)
1800
0
0
r = 0.5
Point
Point
r = 0.1
600 1000 Point
1400
1800
0
0
(C)
200
600 1000 Point
1400
1800
1400
1800
(D) (b)
Figure 4: (a) An EEG signal consists of suppression and burst; (b) the different RP under four different radiuses for the signals in (a). (A) 𝑟 = 0.1, (B) 𝑟 = 0.3, (C) 𝑟 = 0.5, and (D) 𝑟 = 0.7 with a dimension of 4 and a delay of 3.
Table 1: One-way ANOVA and multiple comparison test of three RQA indexes.
RR DET ENTR
One-way ANOVA 𝐹 𝑃 1282.82