Clinical Chemistry 57:4 586–592 (2011)
Automation and Analytical Techniques
Detection of Circulating Endothelial Cells via a Microfluidic Disk Ken-Chao Chen,1 Tai-Ping Lee,2 Yu-Cheng Pan,1 Chi-Ling Chiang,3 Chen-Lin Chen,1 Yao-Hsu Yang,4 Bor-Luen Chiang,2 Hsinyu Lee,3 and Andrew M. Wo1*
BACKGROUND: Circulating endothelial cells (CECs) in the blood are rare but have been shown to be associated with various diseases. With the ratio of CECs to peripheral blood mononuclear cells (PBMCs) less than 1 part per thousand, their separation from PBMCs and detection are challenging. We present a means of detecting CECs from PBMCs via an economical microfluidic disk with a model cell system [human umbilical vein endothelial cells (HUVECs) in PBMCs], along with demonstration of its efficacy clinically. METHODS:
To enrich these rare cells, we used immunomagnetic beads and a tailor-made magnet on the disk. CEC-simulating HUVECs, as target cells, were stained with primary anti–CD146-phycoerythrin antibody and bound with secondary antibody on antiphycoerythrin magnetic beads. PBMCs served as nontarget cells and were labeled with anti–CD45-FITC antibody.
RESULTS:
When hundreds of HUVECs were mixed in 106 PBMCs, 95% of spiked HUVECs were detected. This yield also held for 60 HUVEC in ⬍104 PBMCs. We compared data from flow cytometry with that from the disk: CEC counts in 50 L blood from patients with systemic lupus erythematosus were 61.1 (21.5), significantly higher (P ⬍ 0.01) than those of healthy donors, 31.2 (13.3). CONCLUSIONS: The count of CECs is a suitable marker for symptoms of systemic lupus erythematosus. The microfluidic disk system should be a viable platform for detection of CECs.
© 2011 American Association for Clinical Chemistry
The presence of circulating endothelial cells (CECs)5 in blood is an important issue in biological and clinical
1
Institute of Applied Mechanics; 2 Graduate Institute of Clinical Medicine; 3 Department of Life Science and Institute of Zoology; and 4 Department of Pediatrics, National Taiwan University Hospital, College of Medicine, National Taiwan University, Taipei, Taiwan. * Address correspondence to this author at: Institute of Applied Mechanics, National Taiwan University, Taipei, Taiwan 10617. Fax ⫹886-2-23639290; e-mail
[email protected].
586
studies. Reports have indicated that the amount of CECs can serve as an indicator of the health of blood vessels, and this finding has been leveraged to monitor cardiovascular events (1, 2 ) and vascular disease (3, 4 ). Nozaki et al. (1 ) presented an assessment of endothelial dysfunction by plasma concentrations of endotheliumderived microparticles. Their assessment can independently predict future cardiovascular events in patients at high risk for coronary heart disease. Elshal et al. (4 ) reported that an increased number of CECs observed in patients with systemic lupus erythematosus (SLE) was associated with the active phase of the disease and may serve as a marker of widespread endothelial injury. Researchers have also evaluated CECs as biomarkers for the efficacy of anticancer/antiangiogenic treatments (5–9 ). Dome et al. (6 ) reported that CECs’ presence in increased numbers reflects vascular injury. Along with endothelial progenitor and proangiogenic hematopoietic cells, CECs may play a synergistic role with angiogenesis. Such efforts have demonstrated their value in breast (10 ), prostate (11 ), and rectal (12 ) cancers. Trace amounts of CECs are present among a large number of blood cells. Hence, isolation and detection of these rare cells present a technical challenge. Efficient purification and detection of CECs are critical to derive their clinical significance (13 ). The numbers of CECs have usually been obtained by use of immunobeads or flow cytometry. Roughly 10 diseases have been identified on the basis of the numbers of CECs. For cardiovascular and infectious diseases, the numbers of CECs are 3–10 times higher than controls. For vasculitis and lupus, CECs number from 10 to more than 100, or 2–10 times that of controls. For transplantation and cancer, the numbers of CECs are 4 –5 times that of controls (13 ). Thus, increased CEC counts are associated with undesirable health status.
Received November 4, 2010; accepted January 11, 2011. Previously published online at DOI: 10.1373/clinchem.2010.157404 Nonstandard abbreviations: CEC, circulating endothelial cell; SLE, systemic lupus erythematosus; PBMC, peripheral blood mononuclear cell; HUVEC, human umbilical vein endothelial cell; PE, phycoerythrin; FITC, fluorescein isothiocyanate.
5
Microfluidic Disk Detection of Circulating Endothelial Cells
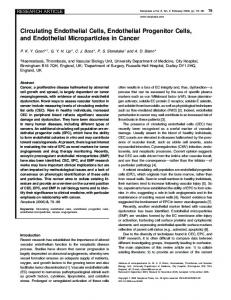
Fig. 1. The microfluidic disk and schematic of cell trapping. (A), Layout of 1 sector of the disk: inlet reservoir (region a) for containing cell sample and collecting target cells for observation, connecting channel (region c, area in light green), and waste reservoir (region b). (B), HUVECs labeled and trapped to magnet in region a.
Currently, there are a number of approaches to quantify CECs. In most cases, researchers count CECs by fluorescence microscopy (2 ), analyze the cell mixture with flow cytometry (14, 15 ), or combine either of these with ELISA (10 ). A consensus protocol based on CD146-driven immunomagnetic isolation, representing the experience of 3 major centers (16 ), has been generally adopted (5 ). Duda et al. (17 ) proposed a cytometry protocol for phenotypic identification and enumeration of CECs and other cells in the blood, which has been adopted (6 ). However, in specific clinical setting, the agreement of the counts of CECs from the 2 techniques would be poor (3 ). Although flow cytometry is capable of high throughput and multiparametric analysis, capital and operational costs might prohibit its usage in resource-limited regions. The microfluidic disk is an effective way to achieve integrated analysis systems in a laboratory setting with a small amount of sample (18 ). Other advantages of the disk-based platform include ease of fluid transport, straightforward valve designs, a disposable batch-like process, and a large range of sample volumes (19 ). Use of the microfluidic disk for enumeration of rare cells with negative selection configuration has been demonstrated (20 ). We describe here a microfluidic disk incorporating immunomagnetic-based separation with direct immunofluorophore for detection in the same region of the disk. To evaluate the performance of the disk, we also analyzed peripheral blood mononuclear cells (PBMCs) from healthy donors with spiked human umbilical vein endothelial cells (HUVECs) via flow cytometry for comparison. CEC counts in 50 L blood from patients with SLE were compared to those in the blood from healthy donors.
Materials and Methods Experimental aspects described in this section include disk design, preparation of cell mixture, disk operation, and data collection from patients. Details of how we achieved high trapping force by using multistage magnets, plus details of the flow cytometry are provided in the Supplemental Data file, which accompanies the online version of this article at www.clinchem.org/ content/vol57/issue4. Further details of disk and experimental setup have been published (20 ). DISK DESIGN
Overarching design considerations for the disk are 2-fold: (a) securely trap the maximum number of rare cells while minimizing the shear stress on the trapped cells, and (b) minimize the time required for the entire procedure. The shear stress arises owing to background cells and the flow of the medium passing the stationary/ trapped cells. The minimum time is desirable for rapid disk operation. Toward these ends, we applied design considerations for the 3 main microfluidic components: inlet reservoirs, connecting channels, and waste reservoirs (Fig. 1). The inlet reservoir houses the mixture of rare and background cells and also traps rare cells via the multistage magnet located directly above the disk. Ten identical sectors on an entire disk (12-cm diameter) were incorporated to maximize the number of tests per spin, with each sector consisting of a complete set of microfluidic components. Centrifugal force propelled nontrapped cells and fluid radially outward toward the waste reservoir via the connecting channels. Ease of observation via fluorescence microscope was considered in the design process. Clinical Chemistry 57:4 (2011) 587
PREPARATION OF CELL MIXTURE
HUVECs were cultured in gelatin (1%)– coated tissue culture dishes or flasks (Falcon Labware, Becton Dickinson) in medium 199 (Gibco BRL, Life Technologies) supplemented with 20% fetal calf serum (Gibco BRL), 4 mmol/L L-glutamine, 30 mg/L (30 g/mL) endothelial cell growth supplement (Collaborative Research), 14 IU/mL heparin (Leo Pharmaceutical Products), and antibiotics at 37°C under an atmosphere of 5% CO2. PBMCs obtained from the peripheral blood of healthy donor volunteers were purified by Ficoll-Paque (GE Healthcare Life Sciences) and labeled with anti–CD45 FITC antibody (555482, BD Pharmingen). We applied a double-step immunomagnetic binding to HUVECs, representing rare cells. HUVECs were stained with human anti–CD146-phycoerythrin (PE) antibody (550315, BD Pharmingen) and bound with BD IMag™ anti-PE magnetic particles (557899, BD Pharmingen). PE and FITC are 2 common fluorophores with red and green colors, respectively. We used a running buffer, composed of pH 7.2 PBS, 0.5% BSA, and 2 mmol/L EDTA, for washing out excessive dye and suspending cells. COLLECTION AND ANALYSIS OF PATIENT SPECIMENS
CECs were defined as nucleated cells larger than 10 m and of the CD146⫹/CD45– phenotype. Peripheral blood samples were obtained with nontraumatic venipuncture (use of tourniquet, selection of a large vein, and avoidance of needle movements). We discarded the first 2 mL of blood drawn to avoid contamination by endothelial cells from venipuncture. We added 4 L FcR blocking agent, antihuman CD45-FITC, and antihuman CD146-PE to 50 L whole blood in EDTA anticoagulant, mixed thoroughly, and incubated at 4 °C away from light for 1 h. We washed the sample with running buffer and added 20 L magnetic particles conjugated with anti-PE mAb (BD IMag Anti-PE Particles; BD Biosciences) for 30 min at room temperature. The sample was loaded into the microfluidic disk and the disk rotated according to the rotational protocol described in the next section. We then counted CECs (CD146⫹/CD45–) by fluorescence microscopy. We analyzed the results, expressed as mean (SD), using Graphpad Prism 4 software. Statistical significance was determined by the Mann–Whitney test. The study was approved by the local research ethics committee, and signed consent was obtained from all participants. DISK OPERATION
We loaded 50 L cell suspension in the inlet reservoir. After placing the magnet on top of the disk, the immunomagnetically bound cells were captured to the top of the reservoir by magnetic-trapping force. Disk rotation 588 Clinical Chemistry 57:4 (2011)
was started at 150 rpm and gradually increased to about 250 rpm to purge residual liquid, within 5 min. Meanwhile, most of the fluid, along with the magnetically unlabeled cells, flowed to the waste reservoir. A rotational speed of 250 rpm for 3 min was usually required to clear the remaining fluid in the inlet reservoir. Finally, the microfluidic disk was flipped upside down and observed directly with a microscope (IX-71, Olympus). Target cells were identified and counted in the microfluidic disk within 15 min. Results Results are presented over an extensive range of HUVEC concentrations, with consideration of both yield (percentage of detected cells over spiked cells) and variation of yield. We performed comparison studies with the BD FACSCanto II flow cytometer and demonstrated the disk’s usage with SLE patients vs healthy donors. FLOW CYTOMETRY
Fig. 2 shows density plots of the mixture of HUVECs in 105 PBMCs. The spiked HUVEC count was categorized into 3 groups: 0, 20, and 200 cells, with each group containing 3 replicates of tests. PBMCs were CD45⫹CD146– and in large quantity, and the strong signals in quadrant IV reflect this fact. HUVECs are CD45–CD146⫹ and in small quantity, so data in quadrant II should correspond to the HUVECs. As spiked HUVEC count increased for the 3 groups, the events in quadrant II (Fig. 2A to Fig. 2C) became more prominent. Table 1 shows flow cytometric data for different numbers of spiked HUVECs mixed into 105 PBMCs. Values of spiked and detected HUVEC numbers shown include mean (SD), with corresponding CV. The yield was represented in both mean yield and CV of the yield (CVyield). The mean yield is the ratio of detected cell number over the spiked cell count in percentage. Thus, CVyield was calculated from the square root of the sum of squares of both the CV of the detected numbers (CVdetected) and the CV of the spiked number (CVspiked), i.e.: CVyield ⫽ CVdetected2 ⫹ CVspiked2 (21 ). The CV from the yield accounts for the variation from both spiked and detected cells. In contrast, some calculation accounts only for the variation from detection. However, bad control on the number of spiked cells causes large variation on yield. In reality, both the preparation of sample and the robustness of detection influence the net yield. The stock of 20 cells was produced by diluting 200-cell stock 10 times. Hence, the spiked number of 200-cells was calculated by multiplying the average of 20 cells by 10. The SD of 200 cells was also calculated
冑
Microfluidic Disk Detection of Circulating Endothelial Cells
Fig. 2. Flow cytometry data of the mixture of HUVECs in 105 PBMCs. Density plots (ascending density from red to blue) of cell mixtures with 0 (A), approximately 20 (B), and approximately 200 (C) HUVECs. Cells can be divided into 4 quadrants according to their FITC (CD45) and PE (CD146) intensity. The counts are listed in Table 1.
(22 ). The detected numbers are all larger than the corresponding spiked numbers. YIELD OF HUVECs
Table 2 presents tabulated data from the disk’s results over a range of spiked numbers of HUVECs in 106 PBMCs. For a large number of spiked cells, e.g., cases of 60, 180, and 360 HUVEC cells, both the CVspiked and CVdetected were less than or around 15%, with the uncertainties in yield (CVyield) also below or around 15%. In the cases of 10 and 20 spiked cells, most CVs were larger than 15%. Fig. 3A presents the number of detected HUVECs after disk operation and detected HUVECs via flow cytometer, both against spiked cells. In disk tests with 1 million PBMCs as surrounding cells, the spiked HUVEC count was categorized into 5 groups: 10, 20, 60, 180, and 360 cells. Each test contained 3 replicates. Results show a linear trend over the 3 orders of magnitude of HUVEC range in the full logarithmic scale plot-
Table 1. Flow cytometer data for different numbers of spiked HUVECs mixed into 105 PBMCs.a 0 cells
20 cells
200 cells
HUVECs Spiked Detected
0 1.0 (1.0)
CVdetected, %
238.3
34.7 (5.9)
272.0 (81.6)
25
CVspiked, %
a
23.8 (5.9)
100
17
30
Data are mean (SD) unless noted otherwise. All the detected numbers are larger than corresponding spiked numbers. Even subtracting the base level (detected count for 0 spiked case), the modified detected numbers are greater than the spiked numbers.
ted. Furthermore, the counts of HUVECs from flow cytometry were used as a reference to evaluate the performance of the disk. Linear regression was used to fit the data points. Results show that R2 values were all ⬎0.998. The strong linearity in the data indicated that the mean yield was independent of the number of spiked HUVECs. Data from the regression analysis suggest that the detected and spike numbers of HUVECs are positively proportional. This proportional relationship implies that the number of spiked HUVECs could be determined from the arbitrary number of detected HUVECs divided by 0.97, at least over the range of spiked cells tested. For flow cytometry data, 3 sets of spiked HUVECs in PBMCs were tested: 0, approximately 20, and approximately 200 cells (owing to logarithmic scale used in the coordinate, the 0 HUVEC data set is at negative infinity, and thus not shown in Fig. 3A). The regression result shows that the amount of detected HUVECs for flow cytometry is higher than that for the disk, and the slope of linear regression for flow cytometry is ⬎1. The fact that the mean yield of approximately 300 HUVECs is closer to 1 than for the lower spiked HUVECs suggests that flow cytometry produced less accurate results at lower cell counts. Besides, the y-intercept of flow cytometry was higher than that of the disk, indicating that the noise level of flow cytometry was higher than that of the disk. Fig. 3B presents the yield for 60 spiked HUVECs in 106, 105, and 104 PBMC counts. Results indicate that the mean yield was distinctly around 95% and varied only slightly with PBMC counts. The CVyield for a cell mixture is noted by the error bar for each case. The differences among the average yields were within the error bars, by comparing any 2 cases for different PBMC numbers. The volume fractions of 106, 105, and Clinical Chemistry 57:4 (2011) 589
Table 2. Microfluidic disk data for different numbers of spiked HUVECs mixed into 106 PBMCs.a 10 cells
20 cells
60 cells
180 cells
360 cells
Spiked
11.0 (2.6)
24.7 (4.7)
62.1 (6.5)
180.0 (6.6)
328.7 (25.7)
Detected
10.0 (2.6)
23.3 (2.1)
61.7 (5.5)
182.7 (12.7)
316.0 (49.3)
CVspiked, %
24
19
11
4
8
CVdetected, %
26
9
9
7
16
91 (36)
95 (21)
99 (14)
101 (8)
96 (17)
HUVECs
Yield (CVyield), %
a Data are mean (SD) unless noted otherwise. Yields are around 100% and CV of detected number and uncertainty of yield are less than or around 15%, except for 10- and 20-cell cases.
104 PBMCs in 60 L liquid are roughly 1.7%, 0.17%, and 0.017%, respectively. The data suggest that the mean yield is virtually identical for the various compositions of cell mixtures. Fig. 3A and B therefore demonstrate that results from the disk produced a mean yield that is independent of both the number of HUVECs and the PBMC count. SLE PATIENTS’ CEC DATA
Fig. 4 shows the detected numbers of CECs of healthy controls (n ⫽ 10) and SLE patients (n ⫽ 10). The controls’ CEC counts ranged from 10 to 50, with a mean (SD) of 31.2 (13.3), whereas the SLE group’s CEC counts ranged from 39 to 103, with a mean (SD) of 61.1 (21.5). Discussion Results from the disk platform show an average of 95% recovered cells over a wide range of HUVEC counts.
The overall robustness of the disk in handling CECs appears to be sound. The approach might also be viable to study other cells in blood by using different immunological properties. For example, by the difference in immunological phenotype of CECs and endothelial progenitor cells in terms of CD45, CD133, or CD117 (23 ), we might be able to distinguish these 2 kinds of cells from CD146⫹ cells. Comparison of results from the disk and flow cytometry deserves further discussion. First, examination of the CV data proved insightful. Two key points are noteworthy: (a) a failure of the CV to describe count variation exists for low numbers of spiked cells, and (b) the level of the CV is an indication of the robustness of the method used. The number of spiked cells played a vital role in the significance of CV values. For small numbers of spiked cells, the underlying cause for the large CVyield, CVspiked, and probably CVdetected should be that 1 cell number variation produces at least a 10% step-change in CV variation for both the spiked and
Fig. 3. Detected number and yield of HUVECs in PBMCs over a range of cell counts. (A), Number of detected HUVECs by disk and flow cytometer from the mixtures of HUVECs and PBMCs. SDs of both spiked and detected cell count are marked on each HUVEC data point. (B), Average yields from disk for 60 HUVECs in 104 to 106 PBMCs.
590 Clinical Chemistry 57:4 (2011)
Microfluidic Disk Detection of Circulating Endothelial Cells
Fig. 4. Detected number of CECs in 50 L whole blood from 10 healthy donors and 10 SLE patients. The bars denote the means of 31.2 CECs for healthy donors and 61.1 for SLE patients, respectively. **P ⬍ 0.01, meaning the difference of CEC numbers for 2 groups is significant.
detected numbers (Table 2). Part of the cell number variation, due to loss during cell mixture handling, would be unavoidable. Perhaps for the level of target cell number ⬍10, SD alone should be a more appropriate parameter than CV. The fact that all CVdetected were ⬎15% shows that the count variation from flow cytometry (Table 1) is larger than that of the disk (Table 2). Therefore, we infer that the enumeration of CEC by disks is more robust than by flow cytometer in the model system. Furthermore, in the flow cytometry result of Fig. 2, the identity of some cells, such as those in quadrant I and III, is not as certain as in isolated HUVECs or PBMCs. Some researchers reported that certain lymphocytes express CD146 (12, 24, 25 ). Thus, quadrant I dots may represent random clusters of such lymphocytes. Besides, cells in quadrant III, claiming 10%–15% of total population, have a weak signal in both colors, and were believed to be the PBMCs with a low intensity of FITC. In flow cytometry, careful optimization of labeling of each fluorophore was required to properly present double-staining data. Otherwise, the intensity of anti– CD146-PE could overwhelm that of anti–CD45-FITC so that the overlapped FITC signal could not be compensated for by software. This would result in only 1 color that can be analyzed. In contrast to flow cytom-
etry, the requirement of balanced labeling is not as strict in tests using the disk. Both false-positive signals and cell loss in flow cytometry contributed to the yield. One may guess that cell loss in flow cytometry would be apparent, for it has a longer fluid conduit compared to the disk. However, judging from the fact that the detected number was greater than the spiked number (Table 1), a falsepositive signal seemed to be dominant. Disk results (Fig. 4) show that the level of CECs for both SLE patients and controls are more than 20 times that presented by Elshal et al. (4 ). There are many factors that contributed to this difference. In their study, Elshal et al. analyzed PBMCs from 1 mL blood with flow cytometry. In comparison, we processed 50 L whole blood with our disks and enumerated CECs by fluorescence microscopy. PBMC enrichment and the precision of flow cytometry down to the level of hundreds should contribute to lower CEC levels. In conclusion, a microfluidic disk was designed to enable separation and detection of rare cells. The capture of CECs, removal of large amounts of surrounding cells, and detection of target cells were all performed on-disk. The yield was very high and remained nearly constant over a wide range of cell counts tested. Using the disk, we enumerated CECs in patients with SLE and found that they were significantly higher than those for healthy donors, suggesting that CEC count is a viable marker for symptoms of SLE.
Author Contributions: All authors confirmed they have contributed to the intellectual content of this paper and have met the following 3 requirements: (a) significant contributions to the conception and design, acquisition of data, or analysis and interpretation of data; (b) drafting or revising the article for intellectual content; and (c) final approval of the published article. Authors’ Disclosures or Potential Conflicts of Interest: Upon manuscript submission, all authors completed the Disclosures of Potential Conflict of Interest form. Potential conflicts of interest: Employment or Leadership: None declared. Consultant or Advisory Role: None declared. Stock Ownership: None declared. Honoraria: None declared. Research Funding: Grants NSC98-2120-M-002-009 and NSC 992120-M-002-004 from the National Science Council of the Republic of China and special subsidiary from National Taiwan University. Expert Testimony: None declared. Role of Sponsor: The funding organizations played no role in the design of study, choice of enrolled patients, review and interpretation of data, or preparation or approval of manuscript. Acknowledgments: The authors thank Yu-An Chen for discussion on simulation.
Clinical Chemistry 57:4 (2011) 591
References 1. Nozaki T, Sugiyama S, Koga H, Sugamura K, Ohba K, Matsuzawa Y, et al. Significance of a multiple biomarkers strategy including endothelial dysfunction to improve risk stratification for cardiovascular events in patients at high risk for coronary heart disease. J Am Coll Cardiol 2009; 54:601– 8. 2. Boos CJ, Lip GYH, Blann AD. Circulating endothelial cells in cardiovascular disease. J Am Coll Cardiol 2006;48:1538 – 47. 3. Clarke LA, Shah V, Arrigoni F, Eleftheriou D, Hong Y, Halcox J, et al. Quantitative detection of circulating endothelial cells in vasculitis: comparison of flow cytometry and immunomagnetic bead extraction. J Thromb Haemost 2008;6:1025–32. 4. Elshal M, Abdelaziz A, Abbas A, Mahmoud K, Fathy H, El Mongy S, et al. Quantification of circulating endothelial cells in peripheral blood of systemic lupus erythematosus patients: a simple and reproducible method of assessing endothelial injury and repair. Nephrol Dial Transplant 2009; 24:1495–9. 5. Bertolini F, Mancuso P, Braidotti P, Shaked Y, Kerbel RS. The multiple personality disorder phenotype(s) of circulating endothelial cells in cancer. Biochim Biophys Acta Rev Cancer 2009;1796: 27–32. 6. Dome B, Timar J, Ladanyi A, Paku S, Renyi-Vamos F, Klepetko W, et al. Circulating endothelial cells, bone marrow-derived endothelial progenitor cells and proangiogenic hematopoietic cells in cancer: from biology to therapy. Crit Rev Oncol Hematol 2009;69:108 –24. 7. Bertolini F, Shaked Y, Mancuso P, Kerbel RS. The multifaceted circulating endothelial cell in cancer: towards marker and target identification. Nat Rev Cancer 2006;6:833– 45. 8. Martin-Padura I, Bertolini F. The circulating endothelial cell in cancer: towards marker and target identification. Curr Pharm Des 2008;14: 3780 –9.
592 Clinical Chemistry 57:4 (2011)
9. Strijbos MH, Gratama JW, Kraan J, Lamers CH, den Bakker MA, Sleijfer S. Circulating endothelial cells in oncology: pitfalls and promises. Br J Cancer 2008;98:1731–5. 10. Goon P, Lip GYH, Stonelake PS, Blann A. Circulating endothelial cells and circulating progenitor cells in breast cancer: relationship to endothelial damage/dysfunction/apoptosis, clinicopathologic factors, and the Nottingham prognostic index. Neoplasia 2009;11:771–9. 11. Georgiou HD, Namdarian B, Corcoran NM, Costello AJ, Hovens CM. Circulating endothelial cells as biomarkers of prostate cancer. Nat Clin Pract Urol 2008;5:445–54. 12. Duda DG, Cohen KS, di Tomaso E, Au AP, Klein RJ, Scadden DT, et al. Differential CD146 expression on circulating versus tissue endothelial cells in rectal cancer patients: implications for circulating endothelial and progenitor cells as biomarkers for antiangiogenic therapy. J Clin Oncol 2006;24:1449 –53. 13. Erdbruegger U, Haubitz M, Woywodt A. Circulating endothelial cells: a novel marker of endothelial damage. Clin Chim Acta 2006;373:17–26. 14. Mancuso P, Antoniotti P, Quarna J, Calleri A, Rabascio C, Tacchetti C, et al. Validation of a standardized method for enumerating circulating endothelial cells and progenitors: flow cytometry and molecular and ultrastructural analyses. Clin Cancer Res 2009;15:267–73. 15. Dignat-George F. Detection of circulating endothelial cells and endothelial progenitor cells by flow cytometry. Cytometry B Clin Cytom 2006;70: 104 –5. 16. Woywodt A, Blann AD, Kirsch T, Erdbruegger U, Banzet N, Haubitz M, Dignat-George F. Isolation and enumeration of circulating endothelial cells by immunomagnetic isolation: proposal of a definition and a consensus protocol. J Thromb Haemost 2006;4:671–7. 17. Duda DG, Cohen KS, Scadden DT, Jain RK. A
18.
19.
20.
21.
22.
23.
24.
25.
protocol for phenotypic detection and enumeration of circulating endothelial cells and circulating progenitor cells in human blood. Nat Protoc 2007;2:805–10. Lee BS, Lee JN, Park JM, Lee JG, Kim S, Cho YK, Ko C. A fully automated immunoassay from whole blood on a disc. Lab Chip 2009;9:1548 – 55. Madou M, Zoval J, Jia GY, Kido H, Kim J, Kim N. Lab on a CD. Annu Rev Biomed Eng 2006;8:601– 28. Chen CL, Chen KC, Pan YC, Lee TP, Hsiung LC, Lin CM, et al. Separation and detection of rare cells in a microfluidic disk via negative selection. Lab Chip 2011;11:474 – 83. Harris DC. Exploring chemical analysis. 3rd ed. New York: W.H. Freeman; 2005. Section 3-4, Propagation of uncertainty; p 58 – 61. Montgomery DC. Design and analysis of experiments. 6th ed. Hoboken (NJ): John Wiley & Sons; 2005. Section 2-2, Basic statistical concepts; p 24 – 8. Delorme B, Basire A, Gentile C, Sabatier F, Monsonis F, Desouches C, et al. Presence of endothelial progenitor cells, distinct from mature endothelial cells, within human CD146⫹ blood cells. Thromb Haemost 2005;94:1270 –9. Dagur PK, Tatlici G, Gourley M, Samsel L, Raghavachari N, Liu PC, et al. CD146⫹ T lymphocytes are increased in both the peripheral circulation and in the synovial effusions of patients with various musculoskeletal diseases and display proinflammatory gene profiles. Cytometry B Clin Cytom 2010;78B:88 –95. Elshal MF, Khan SS, Raghavachari N, Takahashi Y, Barb J, Bailey JJ, et al. A unique population of effector memory lymphocytes identified by CD146 having a distinct immunophenotypic and genomic profile. BMC Immunol 2007;8:15.