Hindawi Publishing Corporation Scientific Programming Volume 2016, Article ID 9792462, 18 pages http://dx.doi.org/10.1155/2016/9792462
Research Article Detection of Common Problems in Real-Time and Multicore Systems Using Model-Based Constraints Raphaël Beamonte and Michel R. Dagenais Computer and Software Engineering Department, Polytechnique Montreal, CP 6079, Station Downtown, Montreal, QC, Canada H3C 3A7 Correspondence should be addressed to Rapha¨el Beamonte;
[email protected] Received 25 November 2015; Revised 3 March 2016; Accepted 16 March 2016 Academic Editor: Dimitrios S. Nikolopoulos Copyright © 2016 R. Beamonte and M. R. Dagenais. This is an open access article distributed under the Creative Commons Attribution License, which permits unrestricted use, distribution, and reproduction in any medium, provided the original work is properly cited. Multicore systems are complex in that multiple processes are running concurrently and can interfere with each other. Real-time systems add on top of that time constraints, making results invalid as soon as a deadline has been missed. Tracing is often the most reliable and accurate tool available to study and understand those systems. However, tracing requires that users understand the kernel events and their meaning. It is therefore not very accessible. Using modeling to generate source code or represent applications’ workflow is handy for developers and has emerged as part of the model-driven development methodology. In this paper, we propose a new approach to system analysis using model-based constraints, on top of userspace and kernel traces. We introduce the constraints representation and how traces can be used to follow the application’s workflow and check the constraints we set on the model. We then present a number of common problems that we encountered in real-time and multicore systems and describe how our model-based constraints could have helped to save time by automatically identifying the unwanted behavior.
1. Introduction System analysis tools are necessary to allow developers to quickly diagnose problems. Tracers provide a lot of information on what happened in the system, at a specific moment or interest, and also what leads to these events with associated timestamps. They thus allow studying the runtime behavior of a program execution. Each tracer has its own characteristics, including weight and precision level. Some tracers only allow tracing kernel events, while others also provide userspace tracing, allowing correlating the application’s behavior to the system’s background tasks. However, each of these tracers shares the fact that an important human intervention is required to analyze the information read in the trace. It is also necessary to understand exactly what the events read means, to be able to benefit from this information. Modeling allows technical and nontechnical users to define the workflow of an application and the logical and quantitative constraints to satisfy. Modeling is also often used in the real-time community to do formal verification [1]. Models and traces could thus be used together to define
specifications to satisfy and to check these against the real behavior of our application. This real behavior, reported in traces, would moreover take into account the influences of other running applications, the system resources, and the kernel tasks. Using kernel traces information, we could therefore extend the set of internal constraints, to add systemwide constraints to satisfy, such as a minimum or maximum CPU usage or a limit on the number of system calls our application can do. This paper describes a new approach for application modeling using model-based constraints and kernel and userspace traces to automatically detect unwanted behavior in applications. It also explains how this approach could be used on top of some common real-time and multicore applications to automatically identify the problems that we encountered and when they occur, thus saving analysis time. Our main contribution is to set constraints over systemside metrics such as resource usage, process preemption, and system calls. We present the related work in Section 2. We explain our approach on using model-based constraints and present
2 some specific constraints in Section 3. We then detail some common real-time and multicore application problems, as part of case studies to evaluate our proposed approach, in Section 4. Results, computation time, and scalability for our approach are shown in Section 5. Future work and the conclusion are in Section 6.
2. Related Work This section presents the related work in the two main areas relevant for this paper, software tracing with a userspace component and analysis of traces using model-based constraints. 2.1. Existing Software Userspace Tracers. To extend the specifications checking of an application, trace data must be available at both the application and system levels. We also need to put emphasis on the precision and low disturbance of the tracer we would use to acquire these traces. In this section, we present characteristics of currently available software tracers with a userspace component and kernel tracing habilities. Basic implementations of tracers exist that rely on blocking system calls and string formatting, such as using printf or fprintf or even that lock shared resources for concurrent writers to achieve thread-safety. Those tracers are slow and unscalable and are thus unsuitable for our research on multicore and real-time systems. They have therefore been excluded. Feather-Trace [4] uses very lightweight static events. It was mainly designed to trace real-time systems and applications and is thus a low-overhead tracer. Feather-Trace’s inactive tracepoints only cause the execution of one statement while active ones execute two. It uses multiprocessor-safe and wait-free FIFO buffers and achieves buffer concurrency safety using atomic operations. This tracer achieves lowoverhead by using its own event definitions of a fixed size. The memory mechanism for these events is based on indexed tables. However, this design choice limits overhead but makes Feather-Trace unable to add system context information to the events, for instance. In its current form, the tracer also cannot use the standard TRACE EVENT() macro to access system events and, even with improvements, would not be able to take advantage of the different event sizes and the information it provides. Also, Feather-Trace does not include a writing mechanism for storing the traces on permanent storage. Finally, the timestamp source used is the gettimeofday() system call, limited to microsecond precision. Paradyn uses dynamic instrumentation by inserting calls to tracepoints directly in the binary executables [5]. Although the instrumentation can be done at runtime [6], Paradyn uses a patch-based instrumentation to rewrite the binary, only imposing a low-overhead latency [7]. This method has been used to monitor and analyze the execution of malicious code. This tracer however offers limited functionality. It cannot switch to another buffer when the buffer is full nor can it store the tracing data to disk while tracing. Furthermore, it cannot support the definition of different event types. It
Scientific Programming thus is not possible to use the Linux kernel static tracepoints defined by the standard TRACE EVENT() macro nor to add system context information. Also, no assurance can be given on the tracing condition for multicore systems. In addition, Paradyn imposes an overhead proportional to the number of instrumented locations. Perf [8] is one of the built-in Linux kernel tracers which was designed to access the performance counters in the processors. Its use was however later extended to interface with the TRACE EVENT() macro and thus access the Linux kernel tracepoints. Yet, perf is mostly oriented towards sampling. It is possible to use perf as a regular tracer but it has not been optimized for this use. If sampling does allow low-overhead, making it interesting for real-time systems, it does so by sacrificing accuracy. Furthermore, the collection process is based on an interrupt, which is both costly and invasive. Finally, perf’s multicore scalability is limited [9]. The Function Tracer, or ftrace, is a set of different tracers built into the Linux kernel [10]. It was created in order to follow the relative costs of the functions called in the kernel to determine the bottlenecks. It has since evolved to include more comprehensive analysis modules such as latency or scheduling analysis [11]. Ftrace is directly managed through the debugfs pseudofilesystem and works through the activation and deactivation of its tracers. It can connect to the static tracepoints in the kernel through its event tracer using the TRACE EVENT() macro [12]. It collects only data defined in this macro using the TP printk macro, to save analysis time on the tracer side. This behavior, however, comes with the drawback of not being able to add system context information to trace events. Finally, ftrace can also connect to userspace applications using UProbes, since Linux kernel 3.5. This instrumentation is using interruptions though, which adds unacceptable overhead for most realtime and high performance applications and systems. SystemTap [13] is a monitoring system for Linux primarily aimed at the community of system administrators. It can instrument dynamically the kernel using KProbes [14] or interface with static instrumentation provided by the TRACE EVENT() macro. It can also be used to instrument userspace applications using UProbes, since Linux kernel 3.8. The instrumentation is done in both cases using a special scripting language that is compiled to a kernel module. The data analysis is directly bundled inside the instrumentation and the results can be printed at regular interval on the console. As far as we know, the analysis being done in-flight, there are no efficient built-in facilities to write events to stable storage. Moreover, userspace probes as well as kernel probes, even if they have been statically compiled in precise places, incur an interrupt to work. If this interrupt is avoidable on the kernel side by using only the static instrumentation provided by TRACE EVENT(), this is not possible on the userspace side. Interrupts add overhead that can be problematic for real-time tracing. LTTng-UST provides macros for adding statically compiled tracepoints to programs. Produced events are consumed using an external process that writes events to disk. Unlike Feather-Trace, LTTng-UST uses the Common Trace Format, allowing the use of arbitrary event types [15].
Scientific Programming The architecture of this tracer is designed to deliver high performance. It allocates per-CPU ring-buffers to achieve scalability and wait-free properties for event producers. Moreover, control variables for the ring-buffer are updated using atomic operations instead of locking. Also, read-copy update (RCU) data structures are used to protect important tracing variables. This avoids cache-line exchanges between readers that occur with traditional read-write lock schemes [16, 17]. A similar architecture is available for tracing at the kernel level. Moreover, kernel and userspace timestamps use the same clock source, allowing events to be correlated across layers at the nanosecond scale. This correlation is really useful to understand the behavior of an application. Finally, previous work demonstrated LTTng’s ability for high performance tracing of real-time applications [18]. LTTng is therefore the best candidate to trace real-time and multicore systems while correlating userspace and kernel activities. 2.2. Model-Checking Analysis and Data Extraction Tools for Traces. In this section, we present different approaches used for model-checking analysis on traces. We also review interesting tools aiming at extracting data from traces. Tango [19, 20] is an automatic generator of backtracking trace analysis tools. It works using specifications written in the Estelle formal description language. It is based on a modified Estelle-to-C++ compiler. Tango generates tools that are specific to a given model and that allow checking the validity of any execution trace against the specifications, using a number of checking options. However, Tango can only be used for single-process specifications and needs a NIST X Windows Dingo Site Server to do its analysis. Moreover, it was mainly designed to validate protocol specifications and therefore does not provide a way to specify constraints based on the system’s state. Other algorithms to automatically generate trace checkers are presented in [21]. These algorithms follow the same idea as Tango as they use formulas written in a formal quantitative constraint language, Logic of Constraints, in correlation with traces. They can thus analyze a traced simulation for functional and performance constraint violations. The specifications file is converted to C++ source, which is then compiled to generate an executable checker. Using simulation traces, the executable will produce an evaluation report mentioning any constraint violation. However, this tool uses text-format traces and is thus very sensitive to any change in the trace format. Scalasca [22] aims to simplify the identification of bottlenecks using execution traces. It offers analysis using both aggregated statistical runtime summaries and event traces. The summary report gives an overview of which process, in which call-path, consumes times and how much. The event traces are used for a deep study of the concurrent behavior of programs. Scalasca analyzes the traces at the end of the execution to identify wait states and related performance properties. It then produces a pattern-analysis
3 report with performance metrics for every function call-path and system resource. If it allows extracting interesting metrics from the runtime of an application, Scalasca does not allow providing our own specifications. SETAF [23] is a framework to adapt the system execution traces and dataflow models to have the required properties for analysis and validation of the QoS. SETAF works using UNITE, which describes a method to use system execution traces in order to validate the distributed system QoS properties [24]. SETAF acts as an overlay used by UNITE to transform the traces and provide the missing information. To do so, it requires the user to first manually analyze the execution trace to identify what properties need to be added to the dataflow model and thus provide the correct adaptation pattern. This adaptation pattern will allow adding information leading to the creation of a valid execution flow and new causality relations between log formats in UNITE but requires the user to have deep understanding of the trace format and UNITE requirements. Trace Compass [25] is a graphical interface in Eclipse for the LTTng tracing tools. It supports multiple types of trace formats and provides different views showing specific analysis of the traces. Amongst these views, Trace Compass provides analysis for real-time applications [26] and an analysis of the system-level critical path of applications [27]. The latter aims to recover segments of execution affecting the waiting time of a given computation. Finally, Trace Compass also allows the creation of state system attribute trees and storing metrics throughout time in the state history tree database. This database provides efficient queries to the modeled state of the traced system for any given point in time. To our knowledge, model analysis is not yet exploiting all the available information. By combining model analysis and trace analysis tools, the gap of unused information can be reduced. This would allow the specified behavior of the system to be verified through its execution trace, during or after running our application. Previous work has also been done on automatic kernel trace analysis using pattern matching, through state machines [28]. This work shows that trace events could be used to follow the workflow on an application and thus link the states of a state machine to the states of a running application.
3. Using Model-Based Constraints to Detect Unwanted Behaviors When designing a high performance application, the developers usually know what they expect their application to do. They know the order of the operations to perform and different metrics along with their average values. It is in fact these values that allow the developers to verify that their application is performing well and doing what they want it to do. In this section, we will present our approach, which uses finite state machine models and constraints over kernel and userspace traces to detect unwanted behaviors in programs. These models will require instrumented applications to delimit the constraints application. We will first detail the
4
Scientific Programming
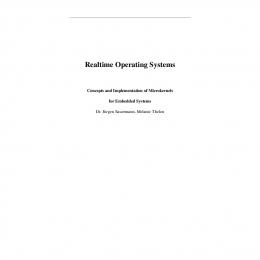
“event (1)” ···
S
“event (2)” verifications
S+1
···
initializations
Figure 1: State machine representation that can be used to check metrics using traces.
general representation and then propose some model-based constraints that could be applied to existing applications.
3.1. General Representation. Whether it is to check a limit in terms of time or resources used by an application, metrics are usually taken between two states during the execution. We first have the start state, appearing before the application’s work that we want to check. This state serves as a base to calibrate our metrics. We then have the second state, the end state for that check, at which point we can validate that we are within the limits. Even if, during debugging, these states are usually read by the developer knowing the application, they can be fixed in the application workflow using a state machine representation. This representation can then be used to analyze constraints. Events generated from userspace tracepoints can thus be used to identify the state changes in our application.
3.1.1. Internal Structure. Our representation is based on four elements: the states, the transitions, the variables, and the constraints. The states are here to represent the different states of our application. The transitions represent the movement from a state to itself or another. The state changes in the traced application can be identified and replicated in the traced system model through the events received in the trace. The variables are used to get and store the values of the metrics we need to verify. There are three main categories of variables: the state system free variables (not based on the state system such as those used to store timestamps or values available directly from the received events), the counter variables (or counters, such as those used to store the number of system calls throughout time), and the timer variables (or timers, such as those used to store the time spent running a process). The variables are categorized depending on the number of calls needed to get their value from our state system. Our state system is based on the Trace Compass state attribute tree. We build our own state history tree database containing the different metrics that we want to keep accessing later during the analysis. These metrics and their evolution are thus saved to a file during the first analysis of the kernel trace and are thereafter accessible using simple requests to the state system. The state system free variables, counter variables, and timer variables are variables that, respectively, need 0, 1, and 2 calls to our state system to obtain their values at a given timestamp. This means that state system free variables can be read directly from the userspace trace, while counters and timers need a kernel trace to be available.
Counters do not need more than one call to our state system as their value is considered being the last one encountered: once a counter is incremented, it will keep this value until the next incrementation. On the other side, the new value of a timer is stored in the state system at the end of the activity, adding up to that timer. This means that when requesting the value of a timer at a given timestamp, we need to verify if the timer is currently running. We thus need to get the last value of the timer and its next value to interpolate the current running value. The constraints are used to express specifications of the expectations for the run of the applications. They are composed of two operands and one operator. The operands are either variables or constant values to be compared. The operator is one of the standard relational operators, equal (==), not equal (=), ̸ greater (>), greater or equal (≥), less (