scans of paintings by Vincent van Gogh (VG) and his contemporaries. [1]. The method of .... inals,â painted naturally and fluidly from life, and âcopies,â in which ... were still lifes set up with objects at hand, painted in an indoor envi- ronment.
DETECTION OF FORGERY IN PAINTINGS USING SUPERVISED LEARNING G¨ung¨or Polatkan, Sina Jafarpour, Andrei Brasoveanu, Shannon Hughes, Ingrid Daubechies Departments of Electrical Engineering, Computer Science, and Mathematics Princeton University, Princeton, NJ 08544 ABSTRACT This paper examines whether machine learning and image analysis tools can be used to assist art experts in the authentication of unknown or disputed paintings. Recent work on this topic [1] has presented some promising initial results. Our reexamination of some of these recently successful experiments shows that variations in image clarity in the experimental datasets were correlated with authenticity, and may have acted as a confounding factor, artificially improving the results. To determine the extent of this factor’s influence on previous results, we provide a new “ground truth” data set in which originals and copies are known and image acquisition conditions are uniform. Multiple previously-successful methods are found ineffective on this new confounding-factor-free dataset, but we demonstrate that supervised machine learning on features derived from HiddenMarkov-Tree-modeling of the paintings’ wavelet coefficients has the potential to distinguish copies from originals in the new dataset. Index Terms— Forgery Detection, Image Classification, Digital Painting Analysis, Blur Identification, Hidden Markov Trees. 1. INTRODUCTION Determining a painting’s authenticity can be extremely challenging. Typically, art experts reach decisions after thorough consideration of many different types of evidence. Correspondence from the artist’s lifetime and documents tracing the painting’s history of ownership provide clues. Technical analyses of the pigments and other materials used and the method of their preparation, study of the creative process as documented in underlayers of the painting (observed through Xray and infrared imaging), and visual aspects of appearance and style of the work are compared against those of the artist’s other works. Yet even these analyses combined may be inconclusive, leaving art experts in search of yet more sources of usable evidence. It has recently been proposed that computational tools from image analysis and machine learning can provide an additional source of analysis of questioned paintings [2]. This assumes that an artist’s brushwork is characterized by signature features (caused, e.g., by the artist’s habitual physical movements) which might be found by machine learning methods and used as an additional piece of evidence to rule upon authenticity. Indeed, early attempts in this area have already found considerable success [2, 3, 4, 5, 6]. 2. PREVIOUS WORK The First and Second International Workshops on Image Processing for Artist Identification (IP4AI) invited research groups to compare their methods on a common data set consisting of high-resolution scans of paintings by Vincent van Gogh (VG) and his contemporaries [1]. The method of each group was also successful in distinguishing the one copy from five originals in a challenge set up by the NOVA ScienceNOW television program [7].
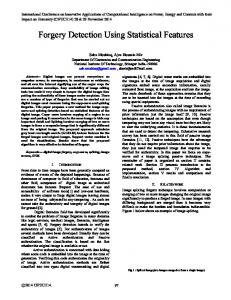
Characterization of particular artists’ paintings via computerized tools has thus far focused on the statistics of the wavelet coefficients of paintings. For example, Lyu, Rockmore, and Farid found that real Brueghel drawings can be distinguished from imitations via a variety of statistics of the wavelet coefficients [3]. This approach was further extended to the faces of a Perugino painting thought to be painted by several hands; the three faces that clustered in this analysis agreed with the three that art experts think were painted by the same hand. Meanwhile, Berezhnoy and Postma [4, 5] found methods for color and texture analysis by complementary colors of VG and specifying the spatial distribution of brushstrokes at different directions by circular filtering. Li and Wang [6] have used texture features obtained by training a 2D Hidden Markov Model on local wavelet coefficients combined with features obtained from detecting and segmenting individual brushstrokes from the images, such as length and average curvature of individual strokes. In previous work, we performed two analyses [2]. We found that parameters of an HMT, trained on the wavelet coefficient trees of paintings, could be used in a successful classification of VG or non-VG in most situations. The exceptions were either stylistically atypical true VGs or non-VGs in the style of VG, so we interpreted this as a stylistic analysis of the paintings. A second analysis focused on the overall quantity of high-frequency detail in a painting and seemed to distinguish copies, forgeries, and other more hesitant works regardless of artist (these had more fine scale detail) from more fluid originals (which had less fine scale detail). We interpreted this analysis as characterizing the artist’s fluency in each painting. Here for convenience, we’ll summarize the results of this analysis in a single “hesitancy index”: the average of the median wavelet coefficient energies we previously calculated separately for each of the two finest scales. In the first IP4AI dataset, this index is significantly higher for copies than for originals (see Figure 1). 3. A CONFOUNDING FACTOR UNCOVERED: BLUR For the second IP4AI-workshop, an expanded data set was provided with a new VG copy and additional VG originals. Applying our previous methods to the enlarged data set did not separate this copy from the new originals, but clustered all the newly added paintings separately in one cluster. Close examination eventually provided an explanation: the newly acquired digital images were sharper than earlier ones; the paintings had been digitized by a new scanner. This showed that variations in the quality of the digitization process for different paintings had to be considered. The data set is obtained by scanning the photographic record (8” × 10” Ektachrome slide) of each painting from the museum archives. For logistical reasons, these are the highest quality photographs we can access: since the paintings are either on display for the public or securely locked down at virtually all times, both a significant expense and a major inconvenience to the museum and its patrons would be required to
gather new high-quality photographs of the 130+ paintings in our dataset. Even under uniform scanning conditions, the level of (visually not very noticeable) photographic blur in the dataset varied, presumably due to variations in age and quality of the museum’s Ektachromes. Surprisingly, this blur had been correlated with authenticity in the first IP4AI dataset. We computed a “blur index” for each painting, a number that reflects the degree of (visually unnoticeable) blurriness of each image, based on the detection scheme described in [8]. This scheme is based on 3 levels of the Haar wavelet transform of a square portion of the image, used to build edge maps of several types. The blur index is computed as an `2 -norm of three blur coefficients, one for each of the R, G, and B channels, based on their edge maps. To validate the use of this blur index on the VG data set, we tested it on images artificially blurred with Gaussian or custom motion filters, for several different levels for the extent of the blur, in all cases unnoticeable by visual examination with the naked eye. The blur index algorithm then recovered correctly the level of blur. 2
S506: Two Children(copy)
IP4AI 1 IP4AI 2 Nova Challenge Forgeries/Copies
Hesitancy Index in Log Scale
1
F418: Wacker Forgery
0
−1
F634: copy by VG of painting by Millet
−2
F687: Nova Challenge Copy
−3
−4
0
0.1
0.2
F652, F734: VG retraced brushstrokes after they had dried 0.3
0.4
0.5
0.6
0.7
0.8
0.9
ground truth (known originals vs. copies) and which we could digitize under completely uniform acquisition conditions. We asked Charlotte Caspers, an art conservation student from Stichting Restauratie Atelier Limburg specializing in art reconstruction, to paint a series of small paintings. Caspers painted both “originals,” painted naturally and fluidly from life, and “copies,” in which she attempted to copy her original as exactly as possible. She reported that originals took her about 20 minutes each (on average) to paint; copies took about two hours. Other than this, there was no difference in the painting conditions, with each pair being painted in sequence over a period of approximately two weeks. All paintings were still lifes set up with objects at hand, painted in an indoor environment. The paintings were allowed to dry for approximately two weeks, then placed directly face-down on a Epson 1640XL flatbed scanner and scanned at 800 dpi to acquire high-resolution digital images. The data set is available for public usage [9]. Original and copy within each pair were painted with the same materials, but a different set of materials was used for each pair. See Table 1 for details. Commercially prepared canvases were covered in a thin layer of colored paint before painting. Soft brushes were sable or synthetic; hard brushes were flat hog hair. These copies are likely hard to distinguish from the originals, since they were painted by the same artist, and shortly afterwards. Being able to reliably classify patches of copies vs. originals under these stringent circumstances would be a strong proof-of-concept for our approach. Indeed, we found that our previous hesitancy indices failed to show a consistent difference between these new originals and copies. We were also unable to find a consistent difference using the Gabor wavelet energy approach in [2].
1
Blur Index
Fig. 1. Hesitancy index vs. blur index for the extended VG dataset Figure 1 plots hesitancy vs. blur index, for the full expanded VG dataset. In both datasets that were previously available, i.e. the IP4AI1 dataset (in red) and the NOVA dataset (in green), the copies appear among those paintings with the very highest hesitancy indexes. For example, the hesitancy index for F6871 allowed us to distinguish it from the rest of the NOVA set. However, the copies also are, rather improbably, among the very sharpest paintings in both datasets. For example, both the copies and another hesitant VG all rank in the top 7 sharpest paintings in the 76 member IP4AI1 dataset. Similarly, in the NOVA dataset, the blur index of F687 (the copy) was .0973, much lower than for any of the other 5 (F458 (.9891), F270a (.9846), F415 (.9250), F451 (.8989), F218 (.6543)), although all were digitized with the same scanner. Finding that this potential confounding factor existed in both datasets (and that moreover our hesitancy index is strongly correlated with it) led us to suspect that blur might have unfairly assisted our team, and others, in previous copy detection challenges. 4. A NEW DATASET: UNIFORM ACQUISITION CONDITIONS To investigate more carefully whether these previously successful analysis methods have the potential of distinguishing originals from copies, we needed to gather a new dataset on which we would have 1 The
F-number labels for each VG painting were developed by art historian Jacob Baart de-la-Faille for his 1928 catalog of VG’s oeuvre. Today, art experts commonly use these to refer to VG’s works.
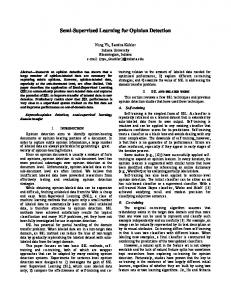
Fig. 2. Portions of 3 Caspers paintings in our dataset. 5. NEW FEATURES FOR COPY/FORGERY DETECTION 5.1. Color Representation We use a coordinate representation of colors in which Euclidean distance mirrors human perceptual distance well, but computation from the original RGB remains simple. HSL [10] represents each color by (1) its Lightness L (grayscale luminance value), ranging from 0 (black) to 1 (white), (2) its Hue H, expressed as an angle, and (3) its Saturation S, again from 0 to 1. All are easily computed from RGB. These 3 coordinates are polar coordinates for a cylindrical color space; the cylinder’s entire bottom represents black, the entire top, white. To match coordinate distances to perceptual ones, this cylindrical color description is converted to a double cone (black at the bottom tip, widening as L increases, to a disk with fully saturated colors on the rim and middle gray at the center for L = .5, and tapering back again to white at the top). We use cartesian coordinates (XYZ) for the resulting double cone, computed from HSL by: X Y Z
= = =
L S cos(H) min{2L, 2(1 − L)} S sin(H) min{2L, 2(1 − L)}
5.2. Features: Hidden Markov Trees (HMT) Paintings are divided into 1024 x 1024 patches and feature are extracted independently from each. We use a Hidden Markov Tree (HMT) multiresolution model [11] that captures statistical structure of the image. For each subband, the wavelet coefficients form a quad-tree with structural local dependencies at different levels. Figure 3 sketches this structure for one subband. At each scale the wavelet coefficient distribution is modeled as a mixture of two Gaussian distributions: one with small variance, controlling the (small) coefficients corresponding to smooth regions, and one with large variance, controlling (potentially large) coefficients corresponding to edges. For the implementation, we use dual-tree complex wavelet coefficients, able to represent more directions than tensor-product orthonormal bases of wavelets. The hidden nodes of the HMT control the magnitude of the wavelet coefficients. At each level, we have several HMT parameters: • αT : A 2 × 2 transition probability matrix Pr[child|parent]. • σS : Variance of the narrow Gaussian distribution. • σL : Variance of the wide Gaussian distribution. The HMT parameters for all scale levels are estimated from the data using the expectation maximization algorithm and then form the set of features for our classification task. Each patch’s resulting feature vector is 132-dimensional: for each subband, we have 2 variances for each of the 6 finest scales and 2 (non-redundant) transition probabilities for each of the 5 finest scale transitions, giving a total of 6 × (2 × 6 + 2 × 5) = 132. Such a model “simulates” the practice of art scholars, in the sense that each style has some hidden parameters, and scholars try to estimate them (in a less mathematically explicit way) based on their observations and a model based on their knowledge background. σL
σ
S
Fig. 3. Quad-tree HMT model of one subband of complex wavelet coefficients. Blue nodes represent hidden layer variables (Small or Large), and Green nodes represent the wavelet coefficients. Each layer is a mixture of two Gaussians with controlling parameter αT .
6. RESULTS ON NEW DATASET USING NEW FEATURES Finally, we formulate copy/forgery detection as a machine learning problem. Let X and Y be the sets of features and labels, respectively. We have Y = {−1, 1}, where −1 labels a patch from a copy and +1 a patch from an original image. The feature vector for patch i is xi ∈ R132 , where 132 is the total number of HMT features. Then let (x1 , y1 ), ......, (xm , ym ) be a sequence of training examples from X × Y; our goal is to find the function of xi (the hypothesis h) that corresponds best to the labels yi , without overfitting. This is a supervised learning task. We use the WEKA (Java-)software for data mining [12] to solve this classification problem by means of Support Vector Machines (SVM) with polynomial kernel. We designed three different tests, differing in the choice of the training set; results for all the tests are given in Table 1. For Test 1, illustrated in Figure 4, the training set, used to classify the two paintings in one pair, incorporates all the patches of all the other
6 other pairs: copies + originals
all patches from both copies and originals TRAINING SET
pair being tested
all patches in original and copy
TEST SET
Fig. 4. Test 1: For each pair to be tested, all the training set patches are taken from the other 6 pairs. pairs, but no patches of the pair in contention; the patches of the original and copy of the latter pair are all in the test set. For our dataset, this means that the training set does not contain any patches painted with the same medium/materials combination as the test set. Table 1 indicates the percentage of patches classified correctly in the total test set, as well as for the original and copy separately. This is the hardest test, and it worked (not convincingly) for only 2 pairs of the 7. In the 5 other pairs, a majority of patches in the copy or the original was misclassified. The results seem to show that at present generalizing from one medium to another is not possible. 6 other pairs: copies + originals
pair being tested
all patches from both copies and originals
pair being tested
some patches in original and copy TRAINING SET
other patches in original and copy TEST SET
Fig. 5. Test 2: The training set contains all the patches from the other 6 pairs and some of the investigated pair. In Test 2 (Figure 5), the training set of Test 1 is augmented with some pairs of corresponding patches for the original/copy pair under contention. Given the restrictions of our dataset [9], in which we never had two different paintings with the same materials, we used patches of the same painting (but different patches) as a simulation of having several paintings at our disposal in the same materials. In this, we make the assumption that different regions of the same painting can be used as independent examples for the machine learning, much as patches from two different paintings would be. Having training examples done in the same materials helps: the results for the top 3 pairs (but not for the bottom 4 pairs) improve significantly. Test 3 (Figure 6), studies the accuracy of predicting after training on a set that uses exclusively the same materials and medium as the test set. Again, given the restrictions of our dataset, we had to use different patches of the same painting as a “simulation” of having several paintings at our disposal in the same materials. To avoid having training and testing patches depict the same piece of the scene, which could unfairly assist the classifier, patches of the image were divided into 4 disjoint sets A, B, C and D. We then used only A-patches from the original and B-patches from the copy for training, and only C-patches from the original and D-patches from
Table 1. Results for Caspers Data Set: Accuracy for each Test. (Abbreviations: CP = Commercially Prepared, S = Soft, H = Hard, Sm = Smooth, Bl = Blended, TI = Thick Impasto, Tot.= Total, Cp. = Copy, Or.= Original) Pair 1 2 3 4 5 6 7
Ground Smooth CP Board CP Canvas CP Canvas Bare linen canvas Chalk and Glue CP Canvas Smooth CP Board
Paint Oils Oils Acrylics Oils Oils Acrylics Oils
Brushes S& H S& H S& H S S S S
Style
TI TI TI Sm,Bl
Tot. 48% 58% 50% 50% 63% 50% 67%
copy
Test1 Cp. 22% 58% 33% 89% 43% 100% 83%
Or. 75% 58% 67% 11% 83% 0% 50%
Tot. 58% 75% 75% 50% 58% 50% 72%
Test2 Cp. 44% 67% 72% 44% 50% 71% 72%
Or. 72% 83% 78% 56% 66% 29% 72%
Tot. 78% 78% 72% 75% 50% 38% 55%
Test3 Cp. 78% 67% 55% 50% 0% 75% 22%
Or. 78% 89% 89% 100% 100% 0% 88%
pable of succeeding in situations where accurate training examples, as we had here, are not available. 8. ACKNOWLEDGEMENTS
original
The authors thank Eugene Brevdo at Princeton University for valuable discussions and sharing information from previous work, Charlotte Caspers for painting the images in the new dataset, and the Van Gogh Museum and the Kr¨oller-Muller Museum in the Netherlands for making the Van Gogh dataset available. 9. REFERENCES
TRAINING SET
TEST SET
4 sets of patches without any overlap
Fig. 6. Test 3:Training patches taken from only the investigated pair. the copy for the test (see Figure 6). This simulates the situation in which authentication of a painting has to be carried out by comparing only with other paintings (of the same materials and medium), without having original/copy pairs to assist in learning. Again, this test was promising for the first 3 pairs (the only ones in which, maybe not coincidentally, hard as well as soft brushes were used), not so for the others. In the 3rd pair, where acrylic rather than oil paint was used, we have a clear majority of correctly classified patches for both the original and the copy, but the accuracy with which ”copy” patches were labeled went down from Test 2 to Test 3. Further work is needed to understand these results better. 7. CONCLUSIONS Authentication of paintings can be difficult, even for experienced art scholars. Quantitative features obtained through digital image analysis could potentially be helpful in identifying copies or forgeries. We reexamined features found useful in recent work and identified a possible confounding factor in their experimental success: images of copies were sharper than those of originals in the datasets studied. We introduced a new data set of copies and originals that is free of this confounding factor. We then used HMTs to model the wavelet coefficients of paintings and supervised machine learning, with the trained HMT model’s parameters as input features, to try to distinguish copies from originals. We offer our well-above chance results on many test cases as a proof-of-concept that quantitative features capable of distinguishing copies from originals can in fact be obtained through digital signal processing on the works in question. However, more work must be done to see if the methods are also ca-
[1] C. R. Johnson, Jr., ed., “Proc. 1st int. workshop on image processing for artist identification (http://digitalpaintinganalysis.org/workshop/proceedingsip4ai1.pdf),” Van Gogh Museum, Amsterdam, 2007. [2] C. R. Johnson, et. al., “Image processing for artist identification: Computerized analysis of Vincent van Gogh’s brushstrokes,” IEEE Signal Processing Magazine, July 2008. [3] S. Lyu, D. Rockmore, and H. Farid, “A digital technique for art authentication,” PNAS, vol. 101, no. 49, pp. 17006–10, 2004. [4] N. H. Berezhnoy, E. O. Postma, and H. J. van den Herik, “Computer analysis of van Gogh’s complementary colours,” Pattern Recognition Letters, vol. 28, pp. 703–709, 2007. [5] N. H. Berezhnoy, E. O. Postma, and H. J. van den Herik, “Automatic extraction of brushstroke orientation from paintings,” Machine Vision and Applications Journal, 2007. [6] J. Li and J. Z. Wang, “Studying digital imagery of ancient paintings by mixtures of stochastic models,” IEEE Trans. on Image Processing, vol. 13, no. 3, pp. 340–353, March 2004. [7] E. Postma, I. Daubechies, E. Hendriks, J. Li, C. Cohen, S. V. Heugten, N. G. Tyson, and C. Caspers, “Nova Challenge,” http://www.pbs.org/wgbh/ nova/sciencenow/0302/02.html, 2008. [8] H. Tong, M. Li, H. Zhang, and C. Zhang, “Blur Detection for Digital Images Using Wavelet Transform,” 2004. [9] C. Caspers, “Caspers Data Set,” http://www.math. princeton.edu/ipai/datatsets.html, 2008. [10] M. K. Agoston, Computer Graphics and Geometric Modeling: Implementation and Algorithms, Springer, 2005. [11] R. G. Baraniuk J. K. Romberg, H. Choi and N. Kingsbury, “Hidden Markov Tree modeling of Complex Wavelet Transforms,” IEEE Trans. on Signal Processing, pp. 133–136, 2000. [12] I. H. Witten and E. Frank, Data Mining: Practical machine learning tools and techniques, 2005.