c ESO 2011
Astronomy & Astrophysics manuscript no. hooh June 2, 2011
Letter to the Editor
Detection of interstellar hydrogen peroxide ⋆ P. Bergman1 , B. Parise2 , R. Liseau3 , B. Larsson4 , H. Olofsson1 , K. M. Menten2 , and R. G¨usten2 1
arXiv:1105.5799v2 [astro-ph.GA] 1 Jun 2011
2 3 4
Onsala Space Observatory, Chalmers University of Technology, SE-439 92 Onsala, Sweden e-mail:
[email protected] Max Planck Institut f¨ur Radioastronomie, Auf dem H¨ugel 69, 53121 Bonn, Germany Department of Earth and Space Sciences, Chalmers University of Technology, SE-439 92 Onsala, Sweden Department of Astronomy, Stockholm University, AlbaNova, SE-10691 Stockholm, Sweden
Received ?; accepted ? ABSTRACT
Context. The molecular species hydrogen peroxide, HOOH, is likely to be a key ingredient in the oxygen and water chemistry in the interstellar medium. Aims. Our aim with this investigation is to determine how abundant HOOH is in the cloud core ρ Oph A. Methods. By observing several transitions of HOOH in the (sub)millimeter regime we seek to identify the molecule and also to determine the excitation conditions through a multilevel excitation analysis. Results. We have detected three spectral lines toward the SM1 position of ρ Oph A at velocity-corrected frequencies that coincide very closely with those measured from laboratory spectroscopy of HOOH. A fourth line was detected at the 4σ level. We also found through mapping observations that the HOOH emission extends (about 0.05 pc) over the densest part of the ρ Oph A cloud core. We derive an abundance of HOOH relative to that of H2 in the SM1 core of about 1 × 10⁻¹⁰ . Conclusions. To our knowledge, this is the first reported detection of HOOH in the interstellar medium. Key words. astrochemistry – ISM: abundances – ISM: individual objects: ρ Oph A – ISM: molecules
1. Introduction Hydrogen peroxide, HOOH, is believed to play an important role in the Earth’s atmospheric ozone and water chemistry. It is a key constituent in the gas- and liquid-phase radical chemistry and has an oxidizing potential in the liquid phase. Gasphase HOOH has been seen in the Martian atmosphere by ground-based observations (Clancy et al. 2004; Encrenaz et al. 2004). However, recent Mars observations with the Herschel Observatory (Hartogh et al. 2010) failed to detect HOOH at levels below those previously seen. The non-detection was attributed to seasonal variations. Interestingly, HOOH is among the simplest molecules that show internal rotation. The internal rotation, or torsion, manifests itself as a rotation of the two O-H bonds about the O-O bond. This hindered internal rotation can be described with a torsion potential in which the two minima (the most stable configurations) do not coincide with the cis or trans alignment of the two O-H bonds1 . The twofold barrier gives rise to a quartet of sublevels for each torsional state. These sublevels are denoted τ = 1, 2, 3, 4 (Hunt et al. 1965). Moreover, HOOH is a light, † point slightly asymmetric prolate rotor (belonging to the C2h group, see Hougen (1984) for a discussion), with only c-type transitions and with a dipole moment of 1.6 D (Cohen & Pickett ⋆ Based on observations with the Atacama Pathfinder EXperiment (APEX) telescope. APEX is a collaboration between the Max-PlanckInstitut f¨ur Radioastronomie, the European Southern Observatory, and the Onsala Space Observatory. 1 When the two O-H bonds point in the same direction, this is referred to as the cis position, while the 180 degree opposite case is called the trans position. For HOOH, the trans potential barrier height is 557 K, while the cis barrier height is almost 4000 K (Pelz et al. 1993).
1981; Perrin et al. 1996). Because of this, no pure rotational transitions occur, and only transitions corresponding to a combined ro-torsional motion change can take place. The mm and submm spectrum of HOOH has been studied rather extensively in the laboratory (Helminger et al. 1981; Petkie et al. 1995) and is available in the JPL database (Pickett et al. 1998). To our knowledge, HOOH has not so far been detected in the interstellar medium. Also, very few abundance limits have been reported. Blake et al. (1987) derived an upper limit for HOOH of 4.5 × 10⁻¹⁰ with respect to H2 from their Orion spectral scan data. Boudin et al. (1998) reported an upper limit of 5.2 % of solid HOOH relative to H2 O ice toward NGC 7538 IRS9. As in the Earth’s atmosphere, HOOH is expected to be closely connected to the water and molecular oxygen chemistry also for those physical conditions prevailing in molecular clouds. In current pure gas-phase models, HOOH is formed by reaction of H2 with HO2 or via the reaction involving two OH radicals. However, these reactions proceed very slowly2 . Alternatively, Tielens & Hagen (1982) suggested that HOOH could be formed on grain surfaces by the successive additions of H atoms to molecular oxygen. If this is the case, HOOH could be closely related to the amount of O2 on grains. The 119 GHz line of O2 was detected toward the cloud ρ Oph A with an abundance of 5 × 10⁻⁸ relative to H2 by Larsson et al. (2007) using the Odin satellite. The ρ Oph A molecular cloud, at a distance of about 120 pc, has been the subject of several studies. Continuum observations (Andr´e et al. 1993; Motte et al. 1998) and C18 O observations (Liseau et al. 2010) revealed several cores. Very recently, Bergman and coworkers found a very high degree of deuteration toward the SM1 core in ρ Oph A from observations of deuterated H2 CO 2
http://www.physics.ohio-state.edu/∼eric
2
P. Bergman et al.: Detection of interstellar hydrogen peroxide
Table 1. Observed HOOH lines Frequency (MHz) 219166.86 251914.68 268961.17 318222.52 318712.10 670595.82
Transition JK′ ′ ,K ′ − JK′′′′ ,K ′′ τ′ − τ′′ a c a c 30,3 − 21,1 4−2 61,5 − 50,5 2−4 40,4 − 31,2 4−2 50,5 − 41,3 4−2 51,4 − 60,6 3−1 11,0 − 00,0 3−1
Eu (K) 31.2 65.5 41.1 53.4 67.0 32.2
Aul (s−1 ) 8.58 × 10⁻⁵ 2.46 × 10⁻⁴ 1.84 × 10⁻⁴ 3.31 × 10⁻⁴ 4.12 × 10⁻⁴ 5.79 × 10⁻³
(Bergman et al. 2011). These observations suggest that grain surface reactions were at work to produce the very high deuterium levels observed in the gas-phase material. In this Letter we continue our study of the ρ Oph A cloud by reporting on observations of several HOOH transitions. We have detected four HOOH lines and two of these lines were mapped over the central part of this cloud. In Sect. (2) we describe our observations and present our results. There, we also describe in more detail the energy level structure and symmetry of HOOH, which is important for discussing the detected lines. Then, in Sect. (3), we discuss the implications of our results.
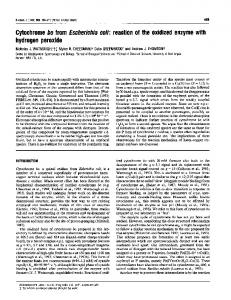
2. Observations and results We have used the APEX 12 m telescope located at about 5100 m altitude in the Chilean Andes (G¨usten et al. 2006) to observe HOOH. For the lower frequency lines we used the Swedish heterodyne facility instruments APEX-1 and APEX-2 (Vassilev et al. 2008). The 7-pixel longer wavelength (450 µm) module of the MPIfR-built CHAMP+ receiver array (Kasemann et al. 2006) was used for the observations of a highfrequency line. The 7 pixels, spaced by 18′′ , are arranged in a hexagon around a central pixel. The observations took place on several occasions during 2010; April 2-11, July 7, August 4-8, and September 10-13. The targeted HOOH lines are listed in Table 1. The frequency, transition quantum number designation, energy of upper level, and Einstein A-coefficient are listed. All values have been compiled from the JPL catalogue (Pickett et al. 1998). The frequency uncertainty for the listed lines is 0.1 MHz or better and this corresponds to 0.14 km s−1 at 219 GHz. We also present in Fig. 1 the energy diagrams for all levels below 100 K. Owing to the symmetry of HOOH, four different radiatively decoupled ladders occur: A1↔3 , A2↔4 , B1↔3 , and B2↔4 . The subscript indicates the pair of torsional quantum numbers τ involved. The c-type electric dipole transitions must also obey τ = 1 ↔ 3 or τ = 2 ↔ 4 (Hunt et al. 1965) and are drawn as downward arrows connecting the upper and lower levels in Fig. 1. The A-species have a nuclear spin weight of 1 and the B-species have a spin weight of 3 (Hougen 1984). This is, of course, due to the nuclear spin directions of the two H atoms (in the same way as the ortho and para symmetries occur for H2 O or H2 CO). The ground-state symmetry species is that of A1↔3 with the B1↔3 state only about 2.5 K higher energy. This means that the energy difference between the species with different nuclear spin weights is much smaller than the corresponding difference for H2 O or H2 CO. The torsional τ = 2, 4 states are about 16 K above the τ = 1, 3 states. This difference stems from the tunneling through the trans barrier and is comparable to the gas kinetic temperatures of 20 − 30 K found in ρ Oph A (Loren et al. 1990; Liseau et al. 2003; Bergman et al. 2011).
Fig. 1. HOOH energy level diagrams. The energy is given in K on the vertical axis, and at the bottom the quantum numbers Ka and τ are shown. To the left of each level the rotational quantum numbers JKa ,Kc are listed. The upper diagram shows the levels with a nuclear spin weight of 1 (A1↔3 and A2↔4 ), while those levels with a spin weight of 3 (B1↔3 and B2↔4 ) are shown in the lower diagram. The allowed c-type transitions within each of the four ladders are indicated as arrows. The red arrows represent detected lines, while the red-dashed arrows indicate nondetections.
In Fig. 2 we show the HOOH spectra toward the core of ρ Oph A. The upper five spectra are toward the SM1 core, α(J2000) = 16h 26m 27.2s and δ(J2000) = −24◦ 24′ 04′′ . The 670 GHz CHAMP+ spectrum is an average of all pixels and is centered 30′′ north of the SM1 position (usually denoted SM1N). In Fig. 3 spectra of the 219166 MHz line for the ob-
P. Bergman et al.: Detection of interstellar hydrogen peroxide
Fig. 2. HOOH spectra toward ρ Oph A. The transition is indicated in each spectrum. The T A∗ intensity scale is in K and the velocity (vLSR ) scale is in km s−1 . The velocity resolution is 0.25 km s−1.
3
Fig. 3. Map spectra of the 219166 MHz HOOH line toward ρ Oph A. The map offset (0′′ , 0′′ ) corresponds to the SM1 position. The T A∗ intensity scale, in K, and the velocity (vLSR ) scale, in km s−1 , are indicated in the upper right spectrum. The velocity resolution is 0.25 km s−1.
Table 2. Observed HOOH line velocities, widths, and intensities R
T mb dv a (K km s−1 ) 0.167(0.018) 0.165(0.018) 0.040(0.011) 0.106(0.013) < 0.044 < 0.12b < 0.051c a integr. from 2.5 to 4.5 km s−1 , errors are 1σ, upper limits are 3σ b average value from three pixels closest to the SM1 position c average value from all pixels, central pixel on SM1N
Freq. (MHz) 219167 251915 268961 318223 318712 670596
Beam size (arcsec) 28 25 23 20 20 9
vLSR ( km s−1 ) 3.8 3.7 3.7 3.8
FWHM ( km s−1 ) 0.84 0.75 (1.2) 0.78
served map positions are shown. In the southern part the line is centered at 3.7 km s−1, while further north, at offset (0′′ , +60′′ ), the line is at 3.2 km s−1. This NS velocity gradient is almost identical to the one seen for H2 CO and its deuterated variants (Bergman et al. 2011). The narrow peaks to the NW are adjacent to where the sulphur species peak as noted by the same authors. In addition to the map in Fig. 3, we also mapped the 251 GHz line, albeit with a poorer S/N ratio and will not discuss it further here. The beam Rsizes, velocity-integrated main-beam brightness temperatures ( T mb dv) , fitted LSR velocities (vLSR ), and line widths (FWHM) are tabulated in Table 2. The T mb -scale was established assuming main-beam efficiencies of 0.75, 0.73, and 0.4, for APEX-1, 2, and CHAMP+ , respectively. The upper limits are 3σ and for the CHAMP+ line two intensities are listed in Table 2; one for the three pixels closest to the SM1 position and the other by averaging data from all pixels. The tabulated errors and upper limits depend only on the channel noise.
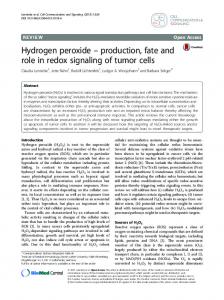
Using the integrated line intensities in Table 2 (corrected by a beam-filling factor corresponding to a source size of 24′′ , see Bergman et al. (2011)), we performed a rotation diagram analysis (Goldsmith & Langer 1999). From this we can determine the rotation temperature, T rot , as well as the HOOH column density, N(HOOH). The resulting rotation diagram is displayed in Fig. 4. The fit is based on the detected τ = 2 ↔ 4 lines. We derive T rot = 22 ± 3 K and a total HOOH column density of (8 ± 3) × 1012 cm−2 where the errors depend on the uncertainty of the integrated intensities and a calibration uncertainty of 10 − 15%. This rotation temperature is very close to the estimates of the kinetic temperatures from H2 CO at the SM1 position. Obviously, the non-detection of the τ = 1 ↔ 3 lines (open squares in Fig. 4) is not consistent with the fit. Especially the 670 GHz line should have been detected given these values of T rot and N(HOOH). Hence, we conclude that the τ = 1, 3 states are not populated according to a simple LTE model. The nondetection of the 670 GHz line could be a result of subthermal excitation. The spontaneous rate coefficient is large (Table 1) and for a typical value of a collision coefficient (∼ 10−10 cm3 s−1 ), the critical density of the 670 GHz transition is about two orders of magnitude higher than the H2 density determined from H2 CO and CH3 OH observations in the same source (Bergman et al. 2011). From the energy diagrams (Fig. 1) it is clear that there is a lack of radiative de-excitation routes out of the Ka = 0 levels in the τ = 1, 3 states (as opposed to the τ = 2, 4 states). The population of the τ = 1, 3 states could therefore be confined to the Ka = 0 levels if the collisional excitation is inefficient. However, a full statistical equilibrium analysis is needed for understanding the details of the excitation. This also requires some basic knowledge of the collision coefficients. For now we assume that the τ = 1, 3 population is negligible compared to the τ = 2, 4
4
P. Bergman et al.: Detection of interstellar hydrogen peroxide
Fig. 4. HOOH rotation diagram. The detected lines (only τ = 2 ↔ 4 lines) are shown as open triangles with error bars. The size of the error bars corresponds to the total uncertainty (noise and calibration). The 3σ upper limits (not included in the fit) are shown as open squares and downward arrows and originate from transitions between τ = 1, 3 states. The fitted rotation temperature is noted, as is the total column density. The column density for unpopulated τ = 1, 3 states is also given. population. In this case, we instead find a total molecular column density of (3 ± 1) × 1012 cm−2 .
3. Discussion Given the good agreement of the velocities of our detected HOOH lines (together with the ≈ 0.1 km s−1 accuracy of the laboratory frequencies) with those from other species we are very confident that the lines belong to HOOH. From our mapping of the 219 GHz line it is also evident that the NS velocity gradient seen for HOOH reflects that of other species. Moreover, the derived rotation temperature of 22 ± 3 K is what would be expected for the ρ Oph A cloud core. For this fairly low excitation temperature one would not expect many lines from other species to be present and, using the JPL and Cologne databases (Pickett et al. 1998; M¨uller et al. 2005), we found no lines from other species that could possibly interfere with the identification. Of course, the narrow lines (with FWHM typically < 1 km s−1 ) seen toward the ρ Oph A cloud core also make line confusion much less likely. From the H2 CO and CH3 OH analysis of the SM1 core Bergman et al. (2011) determined an H2 column density of 3 × 1022 cm−2 . Assuming that the HOOH level populations mainly reside in the τ = 2, 4 states, we arrive at an HOOH abundance of about 1 × 10⁻¹⁰. This is well below the limit of 4.5 × 10⁻¹⁰ found toward Orion KL by Blake et al. (1987). According to current gas-phase schemes (e.g., the OSU chemical reaction database), formation of HOOH in the gas phase is not efficient. Only two very slow reactions are proposed for its formation, reaction of H2 with HO2 , or reaction of two OH radicals. On grains, HOOH is formed through successive hydrogen additions to O2 . This was first proposed by Tielens & Hagen (1982), based on theoretical arguments. Recent laboratory experiments have been made to investigate this route, up to formation of water molecules: O2 + H + H → HOOH HOOH + H → H2 O + OH.
(1) (2)
Miyauchi et al. (2008) have investigated the reaction of H atoms with solid O2 at 10 K. Subsequently, Ioppolo et al. (2008)
have investigated the same reaction in the temperature range 1228 K. Both studies showed that the conversion of O2 stops at some point before exhaustion of O2 because of shielding of O2 in the deepest layers. The experiment of Ioppolo et al. (2008) shows that the shielding decreases with increasing temperature, pointing to the fact that the O2 ice may become more porous when close to its sublimation temperature (30 K). Because this shielding may not be very relevant in space, Oba et al. (2009) investigated the formation of HOOH and H2 O when codeposing O2 and H in the temperature range 10-40 K. The H2 O/HOOH ratio in the formed ices is observed to depend strongly on the temperature, and on the O2 /H flux. The measured H2 O/HOOH ratio is lower than 5 in all experiments (T = 10, 20 K and O2 /H-flux between 3.8 × 10⁻⁴ and 1.9 × 10⁻² ), although higher values may be obtained in the case of lower O2 /Hflux. The present detection of HOOH may open the possibility to quantify the importance of reactions (1) and (2) in the formation of water. Ioppolo et al. (2008) have modeled the formation of water in typical dense clouds (their Figure 4). The laboratory results lead to a revision of the energy barriers involved in the models, and their new model (only accounting for the three main routes of water formation on the grains) predicts a fractional abundance for HOOH of a few 10−14 with respect to H nuclei. This is more than three orders of magnitude lower than our detection. Further understanding will require detailed chemical modeling of grain chemistry. This will be the scope of a forthcoming paper. The observation of water in the ρ Oph A region with the Herschel Observatory as well as the confirmation of the O2 detection would also be very valuable in setting constraints on the models. Acknowledgements. We acknowledge the excellent observational support from the APEX staff. We are grateful to A. Gusdorf for doing some of the CHAMP+ observations. BP is funded by the Deutsche Forschungsgemeinschaft (DFG) under the Emmy Noether project number PA1692/1-1.
References Andr´e, P., Ward-Thompson, D., & Barsony, M. 1993, ApJ, 406, 122 Bergman, P., Parise, B., Liseau, R., & Larsson, B. 2011, A&A, 527, A39+ Blake, G. A., Sutton, E. C., Masson, C. R., & Phillips, T. G. 1987, ApJ, 315, 621 Boudin, N., Schutte, W. A., & Greenberg, J. M. 1998, A&A, 331, 749 Clancy, R. T., Sandor, B. J., & Moriarty-Schieven, G. H. 2004, Icarus, 168, 116 Cohen, E. A. & Pickett, H. M. 1981, Journal of Molecular Spectroscopy, 87, 582 Encrenaz, T., B´ezard, B., Greathouse, T. K., et al. 2004, Icarus, 170, 424 Goldsmith, P. F. & Langer, W. D. 1999, ApJ, 517, 209 G¨usten, R., Nyman, L. Å., Schilke, P., et al. 2006, A&A, 454, L13 Hartogh, P., Jarchow, C., Lellouch, E., et al. 2010, A&A, 521, L49+ Helminger, P., Bowman, W. C., & de Lucia, F. C. 1981, Journal of Molecular Spectroscopy, 85, 120 Hougen, J. T. 1984, Canadian Journal of Physics, 62, 1392 Hunt, R. H., Leacock, R. A., Wilbur Peters, C., & Hecht, K. T. 1965, J. Chem. Phys., 42, 1931 Ioppolo, S., Cuppen, H. M., Romanzin, C., van Dishoeck, E. F., & Linnartz, H. 2008, ApJ, 686, 1474 Kasemann, C., G¨usten, R., Heyminck, S., et al. 2006, in Society of Photo-Optical Instrumentation Engineers (SPIE) Conference Series, Vol. 6275, Society of Photo-Optical Instrumentation Engineers (SPIE) Conference Series Larsson, B., Liseau, R., Pagani, L., et al. 2007, A&A, 466, 999 Liseau, R., Larsson, B., Bergman, P., et al. 2010, A&A, 510, A98+ Liseau, R., Larsson, B., Brandeker, A., et al. 2003, A&A, 402, L73 Loren, R. B., Wootten, A., & Wilking, B. A. 1990, ApJ, 365, 269 Miyauchi, N., Hidaka, H., Chigai, T., et al. 2008, Chemical Physics Letters, 456, 27 Motte, F., Andr´e, P., & Neri, R. 1998, A&A, 336, 150 M¨uller, H. S. P., Schl¨oder, F., Stutzki, J., & Winnewisser, G. 2005, Journal of Molecular Structure, 742, 215 Oba, Y., Miyauchi, N., Hidaka, H., et al. 2009, ApJ, 701, 464 Pelz, G., Yamada, K. M. T., & Winnewisser, G. 1993, Journal of Molecular Spectroscopy, 159, 507
P. Bergman et al.: Detection of interstellar hydrogen peroxide Perrin, A., Flaud, J.-M., Camy-Peyret, C., et al. 1996, Journal of Molecular Spectroscopy, 176, 287 Petkie, D. T., Goyette, T. M., J., H. J., De Lucia, F. C., & Helminger, P. 1995, Journal of Molecular Spectroscopy, 171, 145 Pickett, H. M., Poynter, R. L., Cohen, E. A., et al. 1998, J. Quant. Spec. Radiat. Transf., 60, 883 Tielens, A. G. G. M. & Hagen, W. 1982, A&A, 114, 245 Vassilev, V., Meledin, D., Lapkin, I., et al. 2008, A&A, 490, 1157
5